
The men, the myths, the legends: Why millennial “dudes” might be more receptive to marketing than we thought
This article was originally published on Nielsen.com.
Millennial males are, in theory, elusive creatures. They’re commonly thought of as cord cutters who can’t be—and don’t want to be—reached. But many marketers remain eager to connect with this young, digitally-savvy group.
And why wouldn’t they?
Oft perceived as innovators, trend starters, and predictors of the next big thing, Millennial males lead the pack, in one way or the other. Today’s Millennials are the most racially diverse generation in U.S. history, with nearly 43% identifying as non-white*. They also have spending power. Varying estimates place this group’s purchasing power anywhere between $125 billion and $890 billion annually while some estimates attribute these young shoppers with $200 billion of direct buying power plus an additional $500 billion in indirect influence, based on Millennials’ powers of persuasion over their Baby Boomer parents†.
With significant spending power and men 18-34 years old representing over 30% of the adult male TV market, understanding these consumers’ media consumption habits and what motivates them are critical insights for marketers. New research from NielsenIQ offers a sneak peek into the hearts and minds of this desirable demographic.
They’re living in a digital world
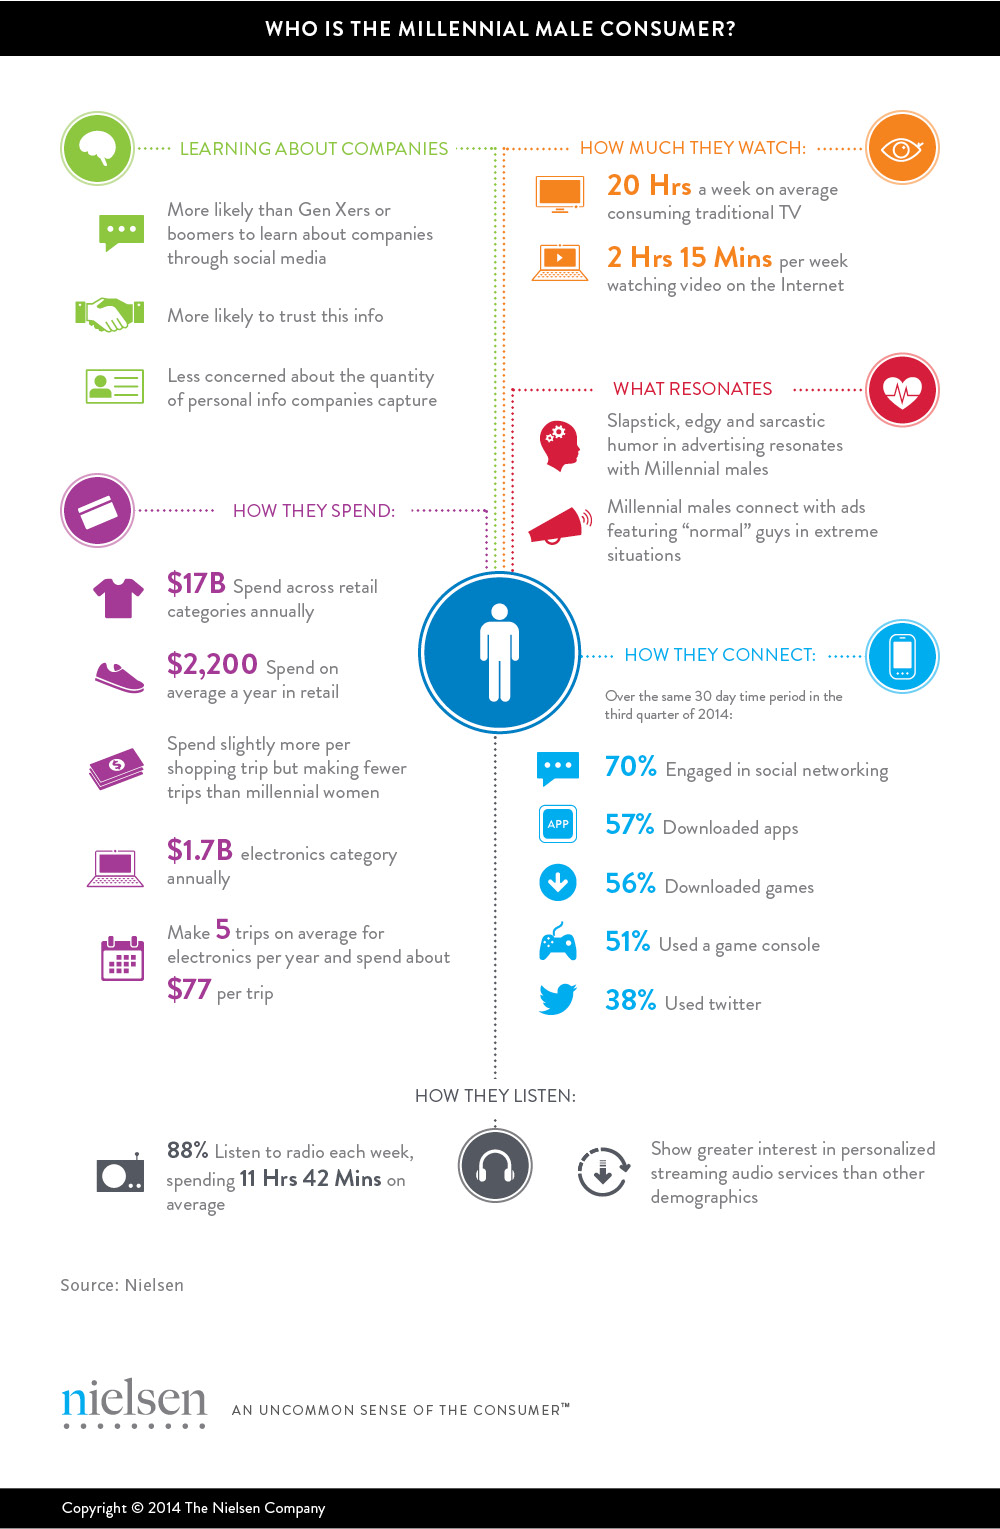
Millennial males spend less time on average each week consuming traditional TV—only 20 hours, compared to 23 hours for Millennial females, 28 hours for Gen X males and 38 hours for Boomer males. However, they make up much of the difference online. This group spends significantly more time per week (2 hours 15 minutes) than any other demographic watching videos on the Internet.
While these young men are united by age, the group is diverse and their habits can vary by their ethnicity. African-American Millennial males, for example, spend significantly more time watching content than Millennial men as a whole: these viewers spend nearly 33 hours a week with traditional TV and three hours watching videos on the Internet. Hispanic Millennial men watch slightly less than the average Millennial man, spending an hour less (19 hours) on traditional TV and less than 2 hours watching online videos. Asian-American Millennial men, on the other hand, spend the most time watching videos on the Internet, almost 4 hours watching online video, but also notably spend the least amount of time watching traditional TV (11.5 hours).
Millennial men are also heavy music listeners. Eighty-eight percent of all Millennial males in the U.S. listen to radio each week, spending more time than their female counterparts tuned in (11 hours and 42 minutes vs. 10 hours and 46 minutes). They also show greater interest in personalized streaming audio services—think Spotify or Pandora—than other demographics.
When it comes to social networking, 70% of Millennial males were engaged in social networking while only 38% of older men used social media platforms over the same 30-day period in the third quarter of 2014. So how did their social profile break down? Thirty-eight percent of Millennial men used Twitter, 56% downloaded games, 57% downloaded apps, and 51% used a game console, compared with 14%, 24%, 36%, and 23%, respectively, for non-Millennial men.
Tailor-made marketing
Millennials are more likely than Gen X or Boomers to hear of what’s going on with companies through social media tools, such as Facebook, Twitter, or blogs. They’re also more likely to trust the information they learn about a company through social media than information offered elsewhere. Millennials, and males in particular, are less concerned about the increasing amount of personal information that companies capture about their customers these days. While the media has predicted that Millennial males are all but impermeable to marketing, data shows that Millennial males are not only receptive to marketing, but that they proactively try to learn more about the companies they hear about or do business with—and their interest is growing.
But just as Millennial men consume content differently than Millennial women, they also identify with ads differently. So what resonates? “Normal” guys in extreme or exaggerated situations have the strongest effect with this segment, and though humor is a winning characteristic across all audiences, slapstick, edgy, and sarcastic humor resonates highly with younger men. Advertisers in some categories are working overtime to reach this coveted segment, and by tailoring their outreach, they’re finding success. For example, within the computers and electronics category, 76% of all impressions served to a campaign aiming to reach Millennial males do so successfully, compared with 57% for campaigns aiming to reach the general Millennial population.
They don’t spend it all in one place
While some companies have found success getting ads to resonate with Millennial men, the bigger question marketers want to know is: What makes these trend-setting consumers swipe their credit cards?
The answer, it turns out, is frequently electronics. Within the electronics category, Millennial males’ spending represents more than 10% of total annual spend on electronics category among adults. On average, a Millennial man shops five times for electronics each year and spends about $77 per trip.
Overall, Millennial men’s spending across retail categories represents 8% of total adult audiences. That puts them close behind their female counterparts, who account for 9% of total spending across retail categories. Millennial males spend slightly more per shopping trip, but Millennial women shop more often. On average, a Millennial man spends $2,200 a year in retail, with key categories for the group being mass merchandisers, home improvement, digital apparel/merchandise, electronics, and apparel.
Even though Millennial men don’t have the same level of discretionary income of other demographics (with a $1 trillion in collective student loan debt‡, more than a third unemployed and more than two-thirds at graduation age without bachelor’s degrees*), this group is widely considered to be influencers and highly covetable to marketers in their own right. Reaching any demographic has its challenges, but understanding how this young and trendy group consumes content and how receptive they are to marketing messages can help marketers and advertisers focus their efforts and see returns in store. Investing in getting to know your intended audience is as important, or even arguably more important, than the messages themselves.
Methodology
Mobile Insights Methodology
Mobile Insights is NielsenIQ’s largest survey tracker of mobile subscribers, capturing approximately 30,000 respondents age 13 years and over on a monthly basis. The survey is primarily conducted online but also includes a supplemental Spanish Language Version (SLV), which is conducted over the phone for Hispanic respondents (SLV respondents are 18+ years old). Mobile Insights data is also weighted to be nationally representative of the U.S. population.
TV Methodology
These insights include live usage plus any playback viewing within the measurement period. Time-shifted TV is playback primarily on a DVR but includes playback from video on demand (VOD), DVD recorders, server-based DVRs and services like Start Over. Second-quarter 2014 TV data is based on the following measurement interval: March 31, 2014-June 29, 2014. Since February 2011, DVR playback has been incorporated into the persons using television (PUT) statistic.
Watching Video On The Internet Methodology
Traditional TV (March 13, 2014-June 29, 2014) via NielsenIQ NPOWER/NPM Panel. Inclusive of live usage plus any playback viewing, such as DVR, VOD, DVD recorders, server-based DVRs and services like start over. Video on the Internet (April 1, 2014-June 30, 2014) via NielsenIQ VideoCensus. Radio (March 28, 2013-March 26, 2014) via RADAR 121.
NBI Methodology
NielsenIQ Buyer Insights provides a direct connection between what people watch and what they buy to more effectively plan, measure and activate media based on actual sales. Our single source database matches NielsenIQ currency-level TV exposure data with online and offline credit/debit card transactions in an anonymous, privacy-friendly way. The buyer annual spending metrics are based on the September 2013 – August 2014 date range across the following Retail categories: Mass Merchandiser, Home Improvement, Digital Apparel/Merchandise, Electronics, Apparel, Department Stores, Sporting Goods, Jewelry Stores, Furniture Stores, Shoe Stores, Pet Stores, Kid’s Stores, Book Stores, Logistics, Auto Parts, Office Supplies, Optical Stores, Daily Deals.
TVBE Methodology
NielsenIQ TV Brand Effect measures the impact of commercials by surveying viewers the day after they were exposed to the ad on TV in their natural viewing environment, providing a comprehensive understanding of commercials’ ability to break through to viewers, and communicate the brand and key message.
NielsenIQ Online Campaign Ratings Benchmarks Methodology
This NielsenIQ Online Campaign Ratings Benchmarks report includes data from thousands of NielsenIQ Online Campaign Ratings campaigns through May 18, 2014, highlighting on-target percentage benchmarks for NielsenIQ Online Campaign Ratings™. The annual report provides a baseline for measuring online campaigns and evaluating campaign success.