America’s sweetest treat is delivering candy crushing growth
When it comes to food, many Americans are putting their health first. As a result, sales of everything from organic eggs to bagged salad to sparkling water are on the rise. That’s not to say, however, that we don’t love a good indulgence as well. In fact, candy is a top treat across the U.S. that generates billions in sales for brands and retailers that are able to appeal to the sweet tooth in all of us.
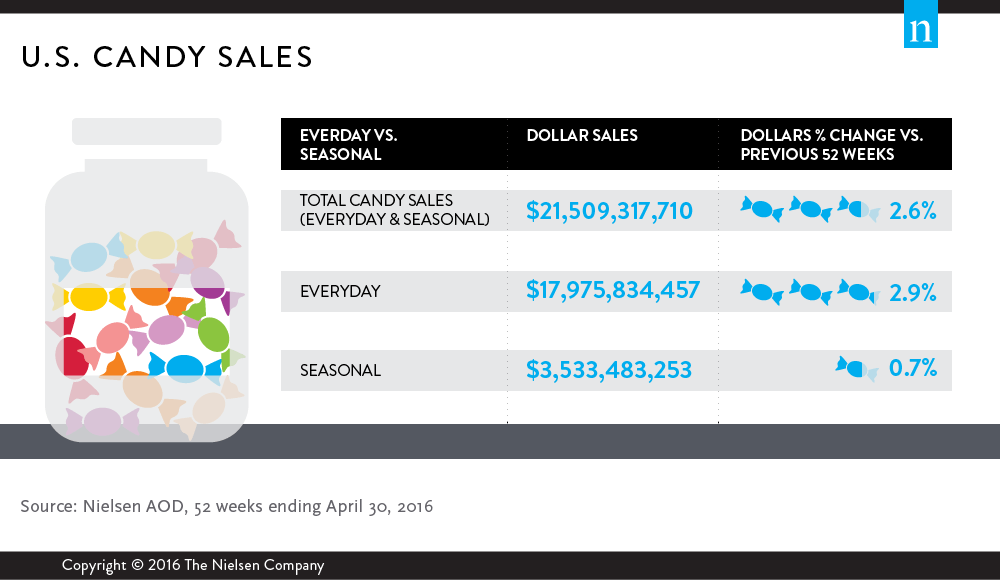
And health trends and aspirations aside, we see that candy sales are actually growing—and not just because June its National Candy Month. In fact, U.S. consumers spent $21.5 billion on candy in the 52 weeks ended April 30, 2016, and annual sales have grown 2%-4% over the past five years. And candy isn’t just a hit during major holidays like Easter and Halloween, which generates $3.5 billion in sales. Americans are candy lovers through and through, spending more than $17.9 billion on every day, non-seasonal treats.
Within the U.S. grocery channel, candy ranks third in category growth, just behind new age beverages and salty snacks. So who’s driving that trend? Sweet-tooth children may be at the top of the list. Nielsen research from third-quarter 2015 about center of store sales found that the request for sweets is highest among families with children under age 18, with the most purchases coming from parents of 3-7 year olds (63%) and 8-12 year olds (65%). As kids reach their teenage years (13-17), candy sales drop to 54%.
But what’s just as important as candy itself is the brand that wraps up these sweet treats. Nielsen’s “Private Label & Branded Score Card” study uncovered that candy is among the top 10 branded categories that posted absolute dollar gains over the last four years. Americans buy branded candy products more frequently than private-label candy, and it reaches consumers in more powerful (and sometimes non-resistant) ways.
So what types of confectionary treats are Americans indulging in? Chocolate! This rich and decadent treat remains the preference over non-chocolate candies, generating nearly $11.2 billion in sales in the last 52 weeks. Non-chocolates, however, aren’t far behind. While Americans purchased $6.7 billion worth of non-chocolates over the past year, up 4.7% over the previous period, indicating that non-chocolates are gaining in popularity. Comparatively, chocolate sales were up just less than 2% over the last year.
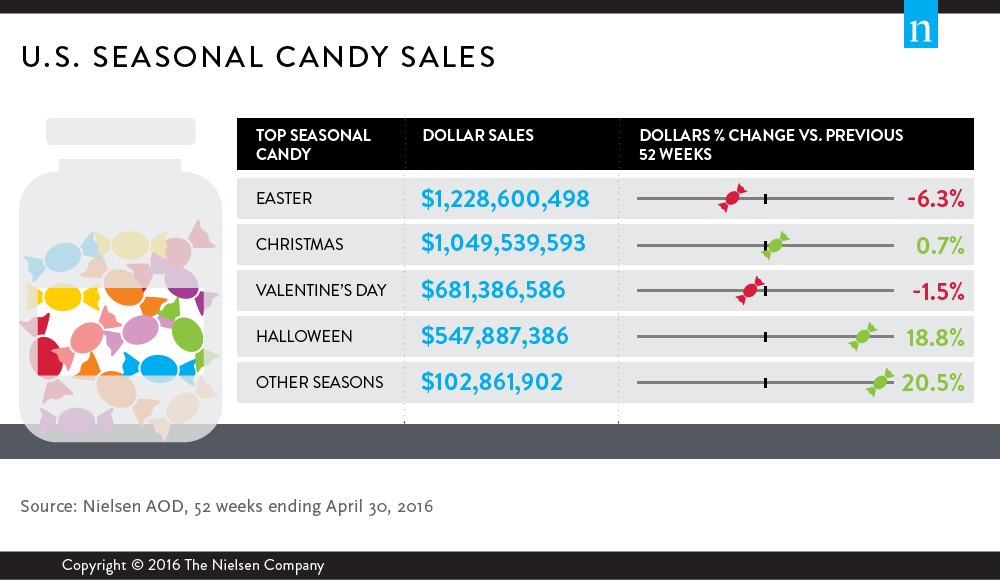
But as exciting as National Candy Month is, there’s no mistaking the power of seasons in the candy business. In fact, seasonal candy accounted for 19% of total sales ($3.5 billion) in the last 52 weeks. It has also generated a higher dollar percent increase over the last five years than non-seasonal sweets. In order of highest sales, the biggest holidays for category sales growth in the candy aisle are Easter; Christmas, Valentine’s Day and Halloween.
Remember, life is sweet—especially during the month of June!
Methodology
The insights in this article were derived from:
- The sales data was derived from Nielsen Answers On Demand, for the 52 weeks ended April 30, 2016
- Nielsen’s “Private Label & Branded Score Card” study was based on Nielsen Answers, Total U.S., All Outlets Combined (plus Convenience), All Departments, All Brands, % Change, 52 week periods vs. year ago.