CPG data analytics management
A number of forces already present in the CPG industry have been thrust forward during the pandemic: the meteoric rise of ecommerce and omnichannel, changing customer behavior, advertising personalization and growing supply chain complexity.
All of these phenomena are generating data and many CPGs are overwhelmed by it, experiencing data overload.
This common issue is part of the digital transformation occurring at many large CPGs. It needs to be addressed by cross-functional teams as opposed to being regarded as an IT task. Silos prevent information and skill sharing which is necessary for CPGs to move forward.
The agility that challenger brands possess has allowed them to gain market share during the pandemic, and harnessing data has contributed to their success.
These smaller brands lack the infrastructure that creates silos. The proximity of teams, shared tasks and rapid, data-driven decision making has given them an edge that is eroding established CPG’s dominant position.
Effective data management, analysis and usage requires input from–and benefits–several teams. The insights data analysis can provide are relevant to ecomm managers, KAMs, revenue management, supply chain teams, category managers and other teams. Data-driven conclusions are also critical to the C-suite. Business leaders need to be data literate so that they can recognize and express their data needs, and make it a priority.
CPGs should designate people as owners of data sets and processes. This way responsibilities are clearly laid out and decisions about data sources and access rights can be made rapidly. Historically, CMI/ business insights/ shopper insights teams (as they’ve variously been called) have bought and handled data so they are well positioned to guide these initiatives.
The potential for data
Insights gleaned from data can be powerful enough to spearhead a company’s strategy. McKinsey reports that data-driven CPGs are outperforming their counterparts and can increase net sales value by 3 to 5 percent.
The list of potential applications for data analysis is long and growing. Currently, it can provide new product development ideas, optimize pricing and promotions, personalize marketing, analyze sales performance and predict which causals will produce future sales.
Data analysis can provide shopper behaviour insights and provide opportunities for unexpected and profitable partnerships. New applications for data analytics continue to emerge.
Reliable data
There is a lot of excitement around data now, and for good reason.
However, for data to be effective it must be accurate.
If, for example, an ecomm manager approaches a retailer saying their OOS is 20%, that data needs to be correct. Eroding a retailer relationship is not an option.
The most accurate availability data is location-based data. This kind of data is collected at the SKU level from every online point of sale. With it, a brand can approach a retailer and show them precisely which estores have high OOS rates, and during what periods. This information can benefit both the retailer and the brand.
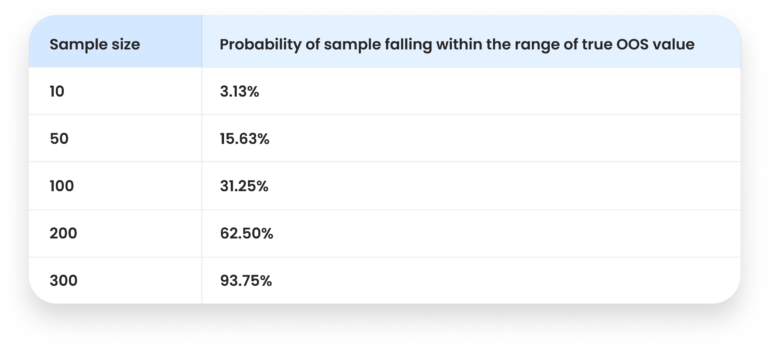
Most solution providers use sample-based data for OOS rates. This kind of data is misleading and non-actionable. It’s misleading because the analysis it provides only reflects the reality in a small selection of stores. For example, our research shows that a sample of 10 online stores yields an accuracy rate of only 3.13% and a sample of 100 stores gives an OOS rate that is only accurate for 31.25% of total estores.

Further, sample-based data is non-actionable. Since this kind of data only refers to a small selection of estores (Walmart US, for instance, has over 4000), it’s not possible to locate exactly which stores have OOS rates that need to be addressed. With location-based analytics, it’s possible to filter stores by location, period and varying OOS rates.
Digital shelf and other types of data held by CPGs
CPGs typically receive a never-ending flow of data that comes from a range of sources. Supply chain teams, for example, can have thousands of data collection points originating from planning teams, factories, distribution centers, retailers, service providers and other partners.
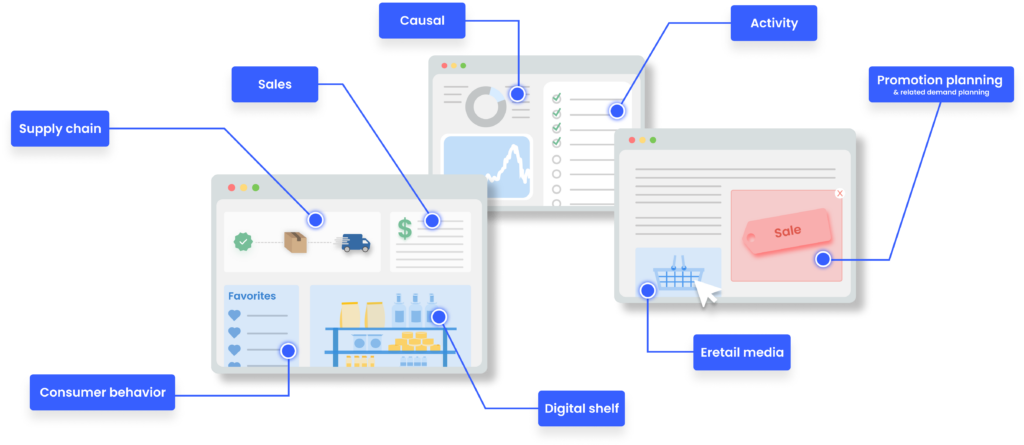
Common sources of data include:
Activity data, which indicates what field reps in the field are doing and achieving. It details the actions they take, at which stores, warehouses and outlets, and when or how often.
Digital shelf data, such as price, availability, promotion status, visibility, competitor activity and more. CPGs also have similar data about the physical shelf collected in-store by reps with additional points like planogram compliance, store demographics, end caps, etc.
Sales data, ideally by SKU, by store, by day, both current & historical. This data is very powerful when combined with digital shelf data.
Causal data. This data tracks the business levers (aka digital shelf KPIs) that play a role in the sale of a product. With these insights, it’s possible to pinpoint which digital shelf KPIs need to be optimized to increase sales.
Promotion planning and related demand planning data. With this data, scheduling promotions in different regions and predicting the lift they will bring is compared with actual sales figures. This helps isolate contributing factors and maximize promotional performance.
Supply chain data. This usually includes shipment and depletion data, backorders, warehouse lead times and much more. During the pandemic supply chain data became particularly important. As a result, the tech behind it has been developing quickly, and the data points have multiplied. For instance, real-time item tracking has become the industry standard.
Consumer behavior data. Social media analytics have evolved quickly. Identifying emerging shifts and trends in consumer behavior is possible in near real-time, a powerful lever for brands.
Eretail media data. A tectonic shift is occurring in online advertising. The approaching end of third party cookies and an increase in direct to consumer selling has created a lucrative opportunity for retailers to create their own media platforms through their online stores. The shopper data they collect is valuable to advertisers because it offers personalized targeting. This proliferation of retail media networks is changing the equation for CPGs. They no longer have to rely on Google, Facebook and Amazon for this kind of data.
Over time, and increasingly, CPGs acquire a lot of detailed data.
The big question is: how to make it actionable?
Read the second article in this series to find out.
