
Churn in High Frequency Retail: Defining It. Reducing It.
With varying time span from one visit to another, defining churn for high frequency retailers is challenging. Harness the power of big data and predictive analytics to determine churn propensity. Then act to reduce it.
Imagine John, exemplary one-stop-shopping, loyal customer who visits twice a month, shops more than 5 departments each time, maintaining a high average shopping basket—the classic gold-tier shopper. John, however, hasn’t been to the store for more than 2 weeks. Should we be worried? Is he on vacation, was captured by competitors?
Every high frequency retailer searches for the pieces to this puzzle. Because visit frequency changes for a variety of reasons, how should retailers define churn and detect churn propensity to react to it before it’s too late? In John’s case, when should he be targeted with personalized offers to get him back to the store?
These challenges warrant a robust definition of churn propensity. One that accounts for each customer’s signature shopping pattern, a set of parameters rigorous enough to alert for churn propensity and early enough to take mitigating action.
Defining churn propensity
ciValue defines churn as revisit likelihood of less than 5% in the next six months. We analyze it using a robust predictive model that contemplates variables such as:
● Frequency & variation of past visits
● Loyalty tier at the store and category level (which sums to hundreds of variables)
Here is one retailer example that analyzes churn propensity as a function of time elapsed from the last visit.
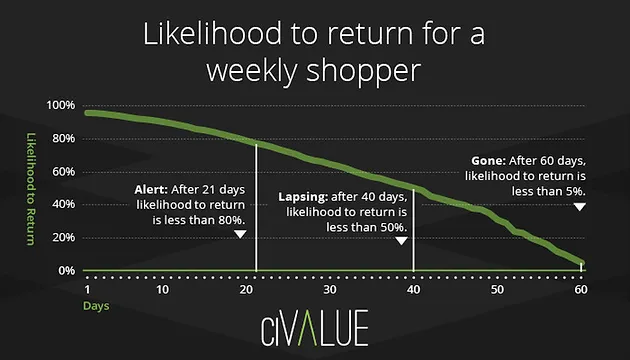
Source: ciValue.
The chart above highlights churn propensity as a function of days elapsed since the last visit. The x-axis shows time elapsed since the last visit and the y-axis shows the likelihood for a repeat visit. After 40 days, customers are 50% likely to never visit the store in the next six months (lapsing). After 60 days, customers are 95% not likely to visit the store in the next 6 months.
In the previous blog post, we visited the concept of tiers. A deep tier-view at the category level allows you to foster a one-to-one relationship with your customer by understanding their needs and building offers to entice them to spend a larger share of the basket with you.
Minimizing churn propensity
A retailer is fairly helpless to reverse a churned customer. So the goal of any analysis is to identify churn propensity in time to convince the customer to stay. That necessitates a more granular analysis than mere store visit frequency.
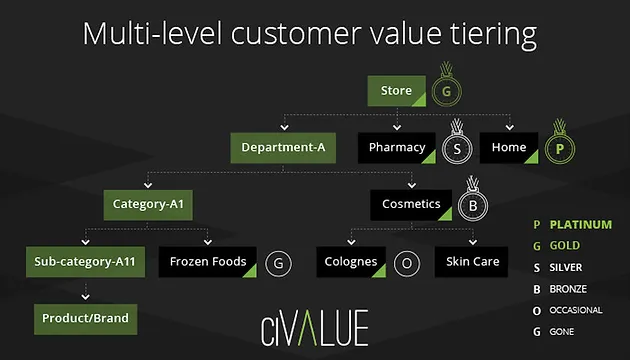
Source: ciValue.
In the example above, a customer might be a store-level platinum loyalty member. He may also be just a silver at the pharmacy and bronze at cosmetics. More important? The customer is lapsing at colognes and is gone from frozen foods. Maybe they had switched their frozen food buys elsewhere, and more and more of their basket followed. Only proactive offers can reverse this process.
Identifying churn propensity on time is only one side of the equation. To deal with a churn, the retailer has to understand why the shopper entered his store in the first place and if possible find what changed in his purchasing habits that resulted in a churn. This requires using the RFM model at the category level (Read more here) to analyze the reason for churn: Shopping online, splitting the basket, changing shopping behavior, etc.
Combining loyalty tiers and category-level analysis is where big data steps in. Identifying churn propensity at the customer level lets you personalize offers specifically designed to attract the lapsing customer to back to your store.
Conclusion
Time elapsed since the last visit, loyalty tier, category loyalty and customer history all help to alert to propensity to churn and preempting it. Visit frequency does not provide sufficient granularity to identify churn propensity.
The combination of big data and predictive analytics identifies churn propensity as early as possible to deliver specific offers to revive loyalty and reduce basket splitting among retailers. It lets you take timely action to get those straying customers back to the store.