When we think about “living the dream” or “living the good life”, we usually think about health, family, work, experiences and finances. But what is really the most important in the eyes of consumers, and how do those factors stack up against each other?
This was the focus of our most recently published global study, where we asked thousands of consumers around the world about which factors they personally see as being an essential part of ‘the good life’ or the life they’d like to have. Would the results differ by age group or from country to country? And have any new trends emerged this year?
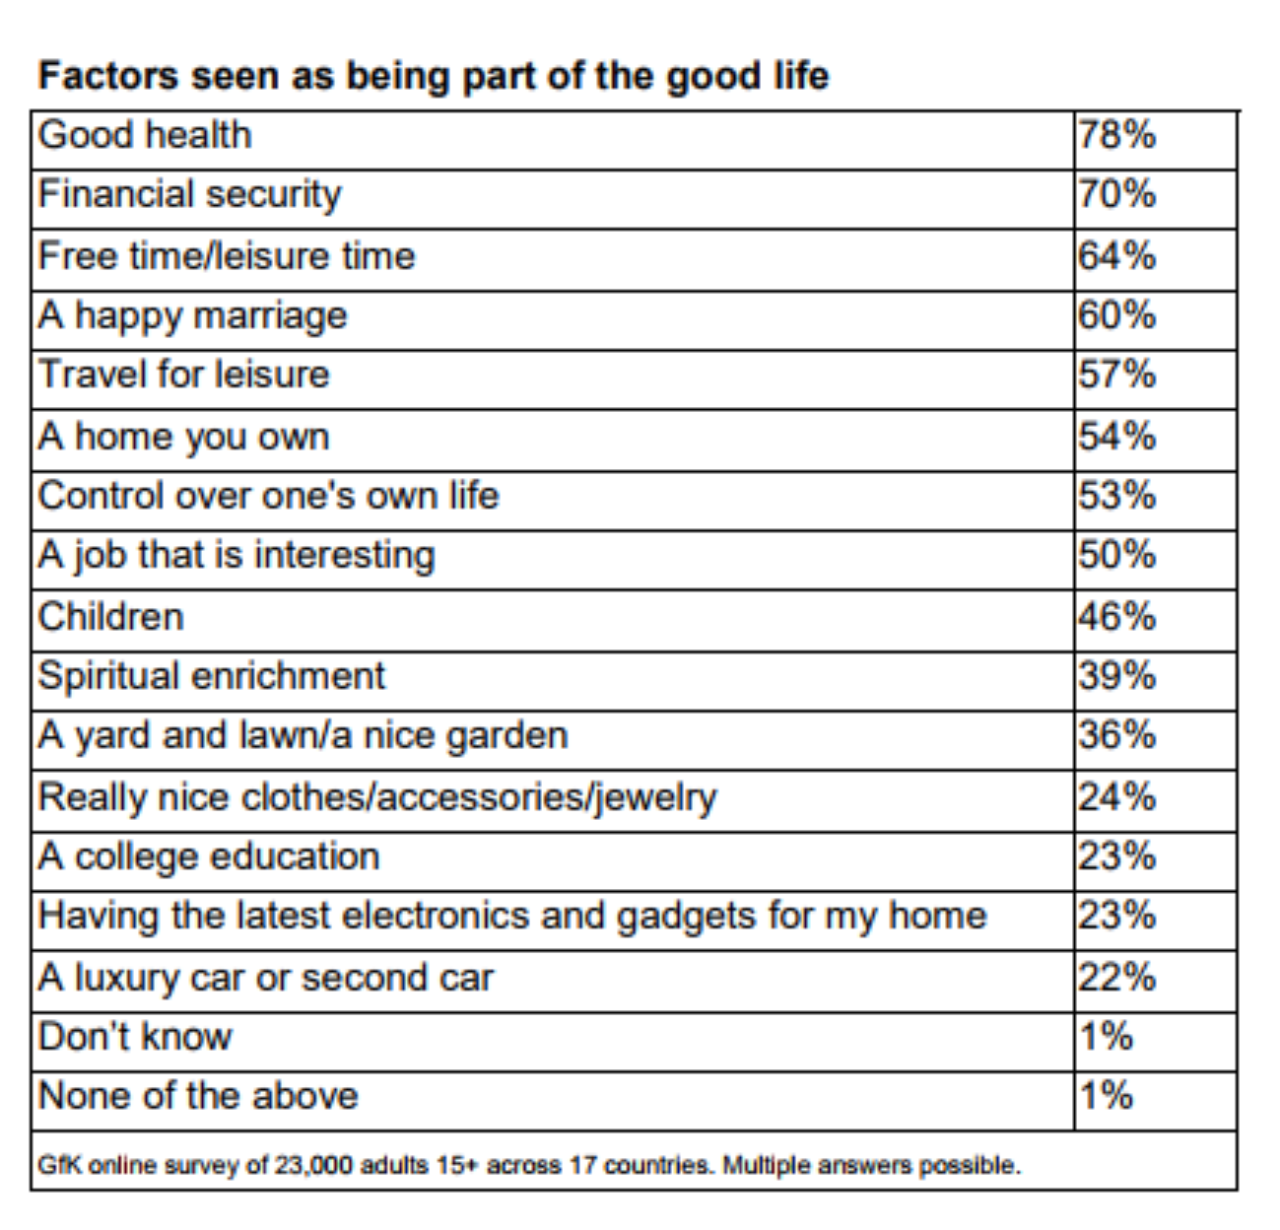
Here are the factors in order of international popularity, according to consumers.

Top factors internationally
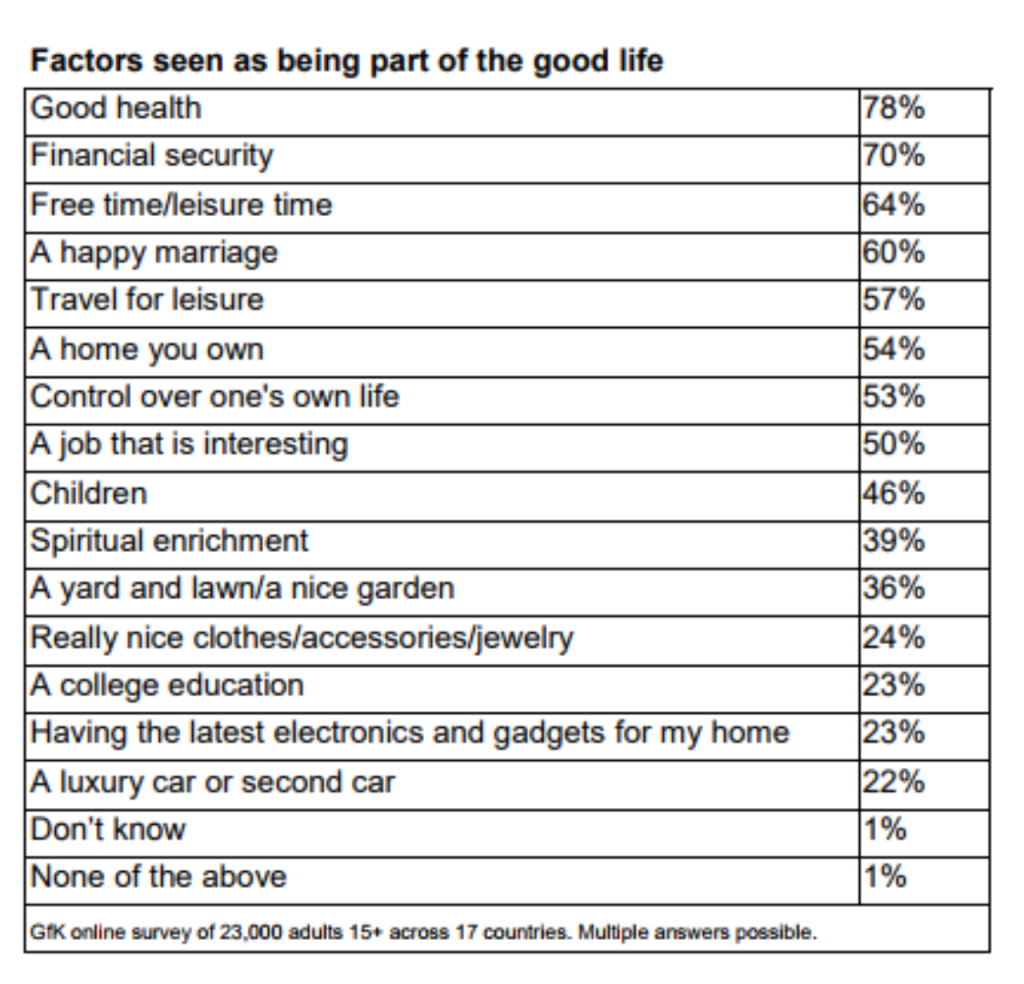
As seen above, the top ranking factors internationally for being part of “the good life” are good health, financial security, and free time/leisure time, followed by a happy marriage, the ability to travel for leisure, owning a home, control over one’s own life and a job that is interesting.
What’s also revealing is the factors that rank lower on the list, such as children, spiritual enrichment, having a nice yard and a lawn, and having a luxury car or second car.
For brands and marketers, the results of this global study have implications on the future and what consumers value most. Are your products and services aligned with the consumer’s vision of their ideal life? What kind of messaging and advertising will resonate best with consumers and which products and services have the most increasing or decreasing mass appeal?
In digging a little deeper, we see that there are variances for each age bracket, with younger age groups seeing a college education as more essential to the good life, and older age groups placing more emphasis on financial security. Clearly, those with more life experience value the security blanket that health and wealth provides, whereas it could be argued that the younger demographic trends more toward prioritizing accumulating those life experiences.
What are the differences regionally?
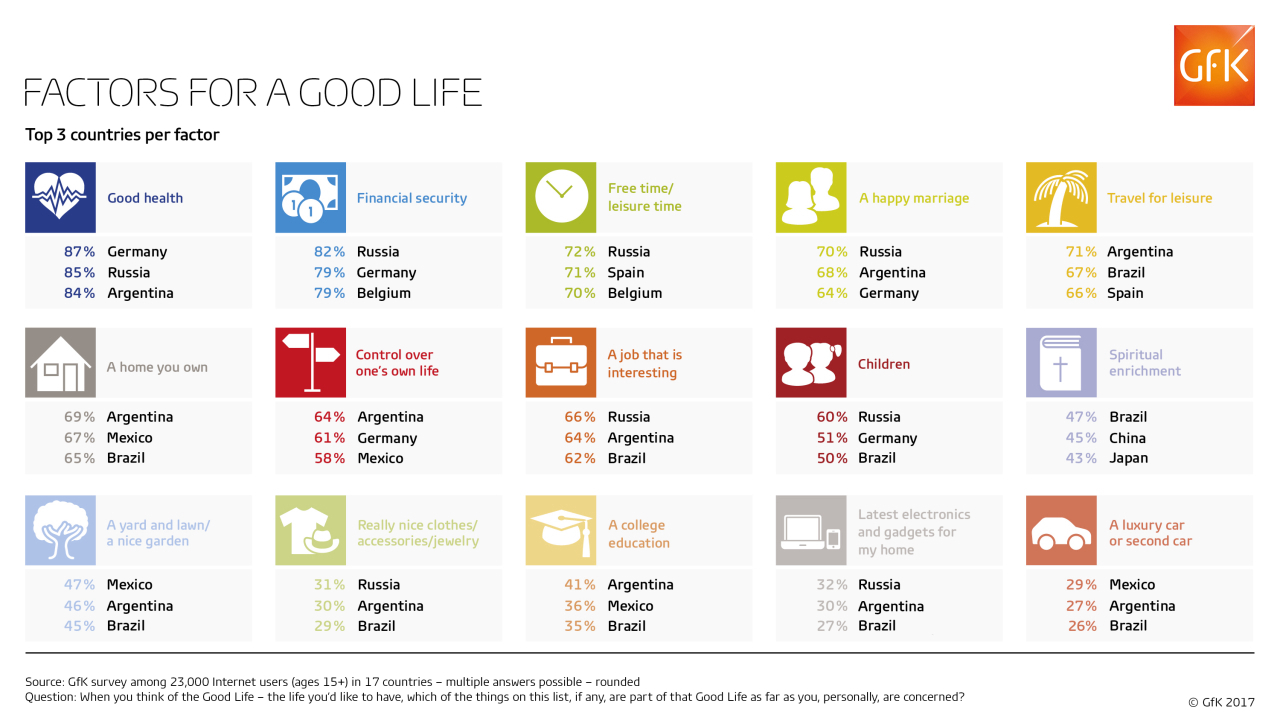
To help identify specific market opportunities, we offer a country by country breakdown of the results from our global study.

Financial security, which is the second highest ranking factor internationally, has the most resonance with consumers in Russia, followed by Germany and Belgium. On the other hand, when it comes to travelling for leisure as part of the good life, Argentina takes the lead, followed by Brazil and Spain.
What this means for brands
So what does it really mean to live the good life, and how can businesses respond? As consumers internationally increasingly value time and experiences over materials and possessions, balanced with more practical factors like good health and financial security, they will continue to look to brands to help them achieve the life they’d like to have. The brands that are able to deliver on fulfilling this promise will live “the good life” of their own, with a healthy business, financial security, and control of their own life.
About the study
The survey question asked, “When you think of the Good Life – the life you’d like to have – which of the things on this list, if any, are part of that Good Life as far as you, personally, are concerned?: A home you own; Good health; A happy marriage; A job that is interesting; Children; A yard and lawn/a nice garden; Free time/leisure time; Spiritual enrichment; A college education; Financial security; A luxury car or second car; Travel for leisure; Really nice clothes / accessories / jewelry; Having the latest electronics and gadgets for my home; Control over one’s own life; None of the above; Don’t know”
GfK interviewed 23,000 consumers online in 17 countries in the summer 2017. Data are weighted to reflect the demographic composition of the online population aged 15+ in each market. The global average given in this release is weighted, based on the size of each country proportional to the other countries. 4 Countries included are Argentina, Australia, Belgium, Brazil, Canada, China, France, Germany, Italy, Japan, Mexico, Netherlands, Russia, South Korea, Spain, UK and USA.


