Non-alcoholic beverage sales are growing
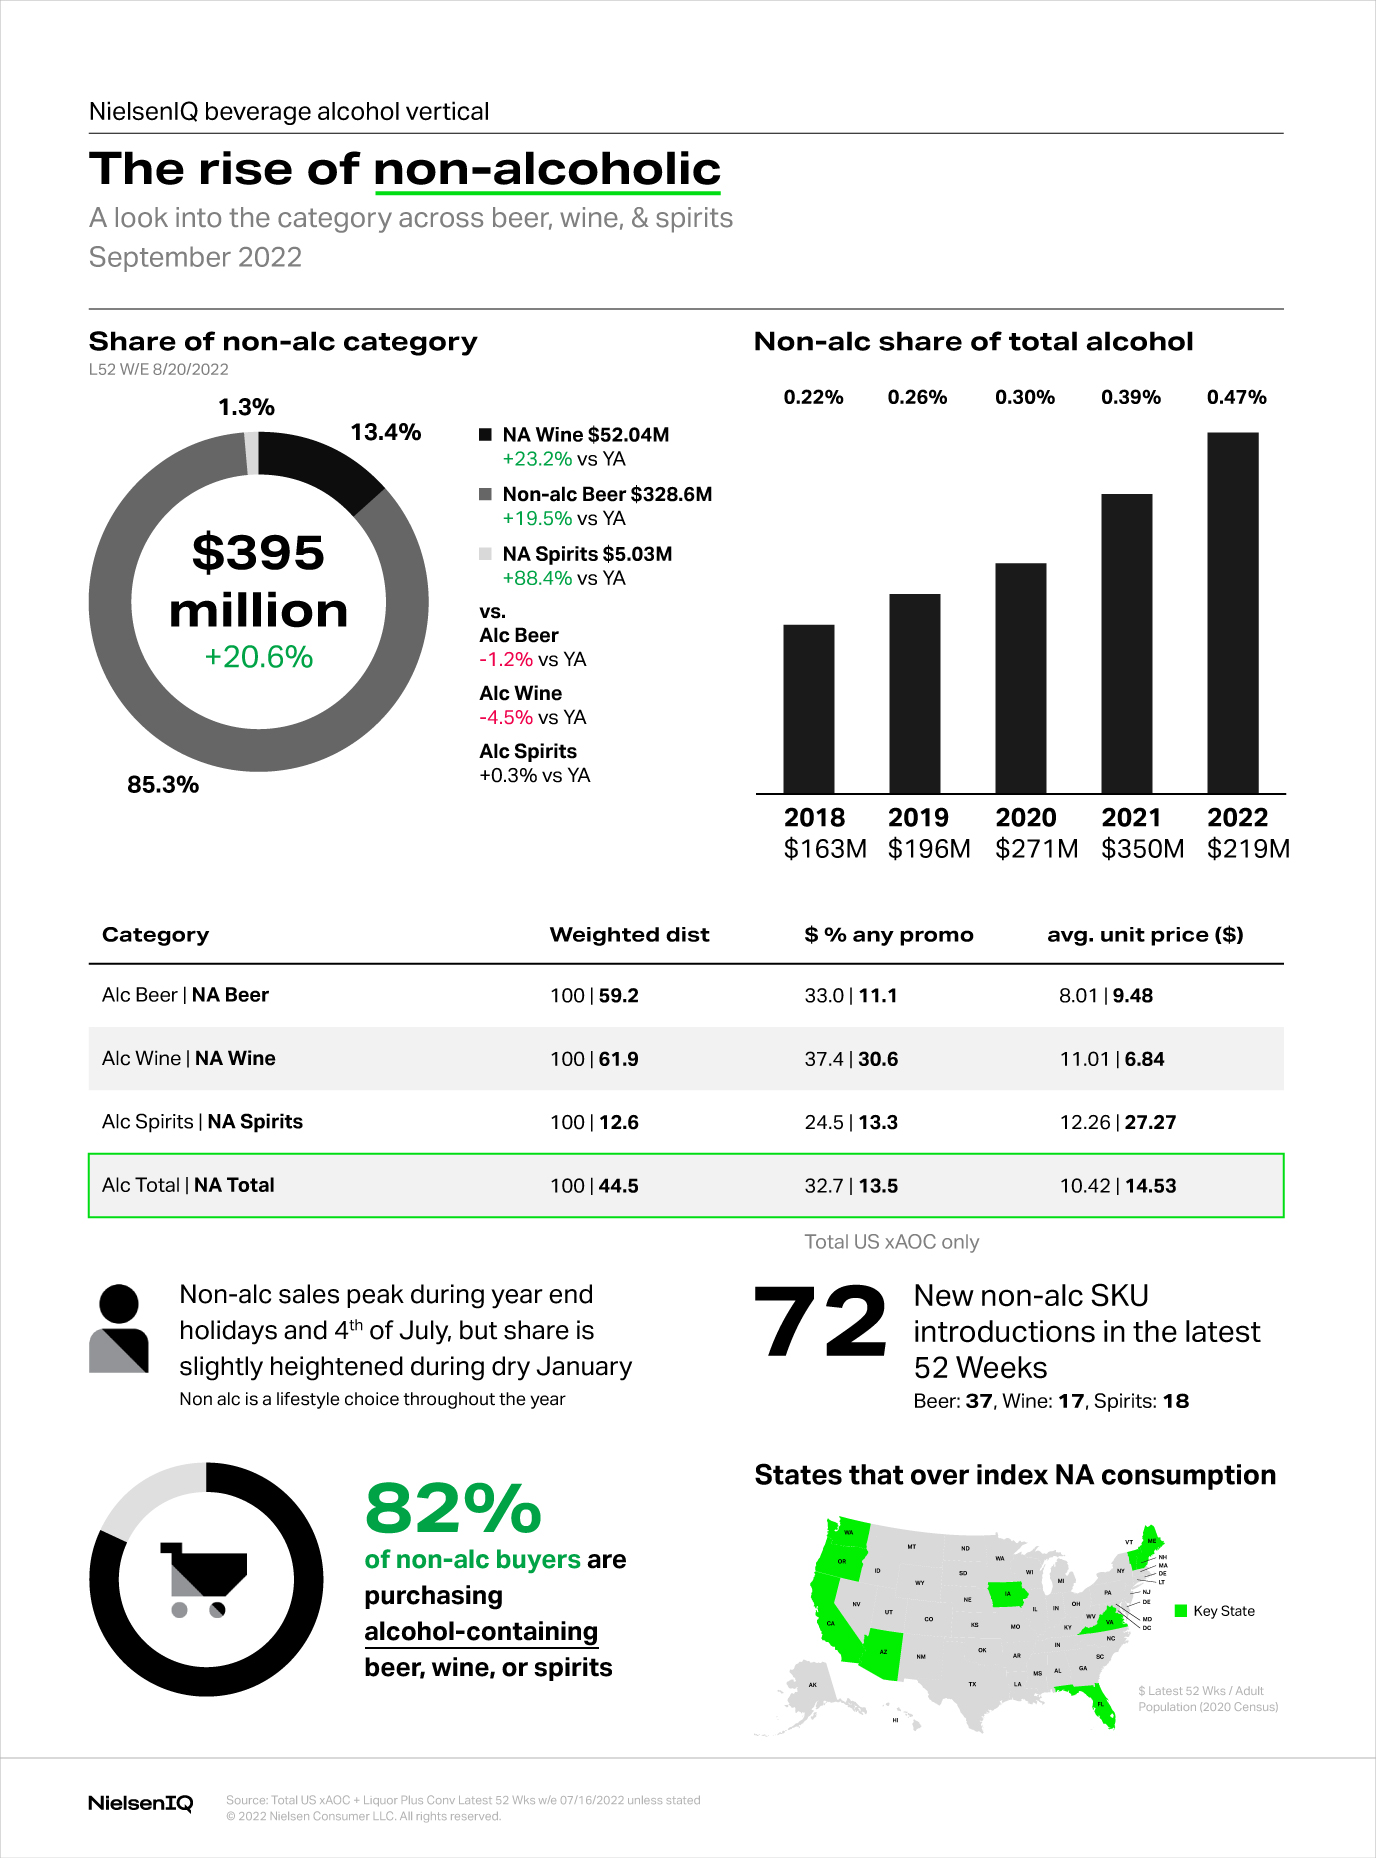
The increasing growth of non-alcoholic beverage trends across the U.S. is being reflected in sales figures. Between August 2021 and August 2022, total dollar sales of non-alcoholic drinks in the US stood at $395 million, showing a year-on-year growth of +20.6%.
To break this down into sectors:
Non-alcoholic beer took up 85.3% of sales, with a market worth $328.6 million, up +19.5% from a year ago.
Non-alcoholic wine took up 13.4% of sales, with a market worth $52.04 million, up +23.2% from a year ago.
Non-alcoholic spirits took up 1.3%, worth $5.03 million, up +88.4% from a year ago.
Meanwhile, as non-alcoholic beverage trends continue to rise, sales of the alcoholic versions of these drinks have dropped. As of August 2022:
Non-alcoholic beer took up 85.3% of sales, with a market worth $328.6 million, up +19.5% from a year ago.
Non-alcoholic wine took up 13.4% of sales, with a market worth $52.04 million, up +23.2% from a year ago.
Non-alcoholic spirits took up 1.3%, worth $5.03 million, up +88.4% from a year ago.
A look inside the non-alcoholic beverage market
In the past year to date, sales of non-alcoholic beer, wine and spirits accounted for 0.47% of total alcohol sales in the U.S. While this is still a small figure, this percentage share has steadily grown over the past 5 years:
- In 2021: it was 0.39% of total alcohol sales
- In 2020: 0.30% of total alcohol sales
- In 2019: 0.26% of total alcohol sales
- In 2018: 0.22% of total alcohol sales
As non-alcoholic spirits have been notably less available, there are opportunities for these to become more readily available for consumers to buy.
Between mid-July 2021 – mid-July 2022, 72 new non-alcoholic drink SKUs were introduced to the US market: 37 were non-alcoholic beer, 17 non-alcoholic wine and 18 non-alcoholic spirits.
As a rough guide, sales of non-alcoholic beverages tend to peak around July 4th and near the end-of-year holiday season.
It’s also notable that certain states over-index for non-alcoholic beverage consumption: Florida, California, Oregon, Arizona, Washington, Iowa, Virginia, Vermont, Maine and New Hampshire.
But these consumers aren’t necessarily adopting total sobriety, as 82% of non-alcoholic drink buyers are also still purchasing drinks that contain alcohol.
A closer look at non-alcoholic beverage trends
Want to know more?
Interested in accessing alcohol industry trends like this whenever you’d like? NielsenIQ BevAl Solutions are coded to display the alcohol trends and data you need in a friendly, easy to use platform. Empowering you with actionable data at your fingertips.