

Prime Day 2025
Retailers should analyze Amazon’s results to inform their own strategies, both for this period and for future promotional events. Manufacturers, meanwhile, should benchmark their performance against competitors and category trends to assess their relative success.
Equally important is tying these insights back to your organization’s Prime Day playbook. Did your performance align with your investment? What executional areas need improvement to ensure you capture your fair share of sales during future Prime Days and other key retail moments?
Start with this analysis to understand what happened and how to improve going forward.
Unwrap more insights around Prime Day
Open up more insights around Prime Day. Get the when, where and how of shopping trends and opportunities for brands and retailers.
Event Performance: A Mixed Bag
The biggest structural shift this year was Amazon’s decision to expand Prime Day from two days to four. This change proved to be a major success, driving a 35% year-over-year increase in sales compared to the two-day event in 2024. An additional outcome of this was substantially lower daily averages for the retailer, making this year’s event less explosive than previous years.
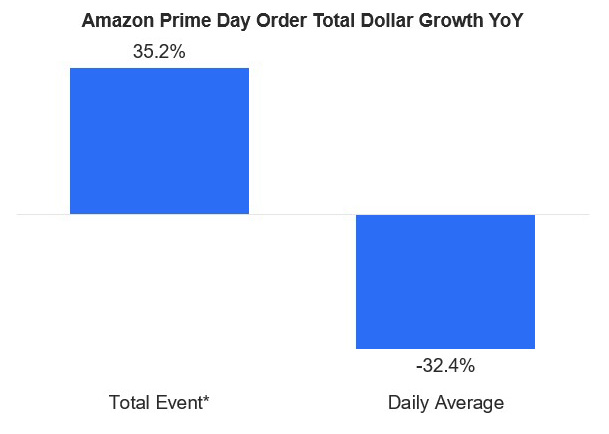
It’s also important to view Prime Day’s performance in the broader context of the retail calendar. In 2025, Amazon’s average daily order total during Prime Day was 136% higher than the year-to-date daily average. Daily order total is a strong proxy for sales and includes all parts of the shopper receipt (product sale, taxes, shipping). By comparison, in 2024, Prime Day’s daily average was 247% above the year-to-date average (Source: NIQ Digital Purchases).
This year’s event also made history, with two days—July 9 and July 11—ranking among Amazon’s top ten biggest sales days ever by order total. This pattern may reflect broader shopping rhythms across the four-day event, with Days 1 and 3 serving as browsing and cart-building periods, and Days 2 and 4 driving the bulk of purchases.
Category Performance: Who Showed Up and Showed Out
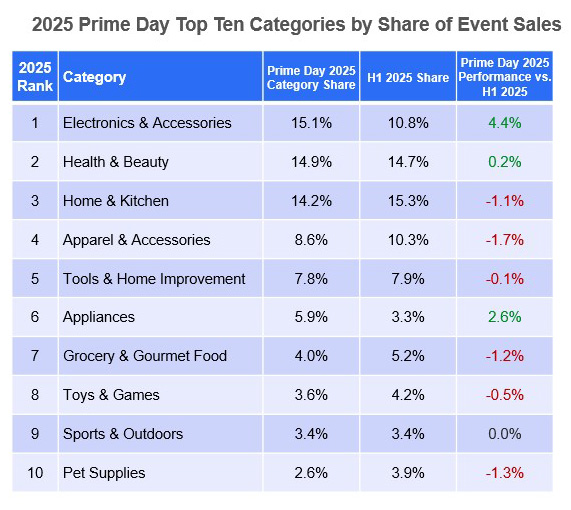
While overall results provide a high-level view, category-level performance is where manufacturers should really focus their attention. This year’s top-performing categories were Electronics & Accessories, Health & Beauty, and Home & Kitchen, accounting for 15.1%, 14.9%, and 14.2% of total sales, respectively.
Taking a closer look, we can identify which products were the most successful within selected top-performing categories during this year’s Prime Day.

Manufacturers should take this opportunity to analyze their competitive set by comparing sales share and growth rates against category norms to determine whether Prime Day helped them gain market share. This analysis should be viewed in the broader context of investment, including both financial and operational resources. By evaluating deal funding, media spend, and labor allocation, brands can better understand their return on investment and refine their strategies for future tentpole events.
With that in mind, Prime Day also brings unique shopper basket dynamics.
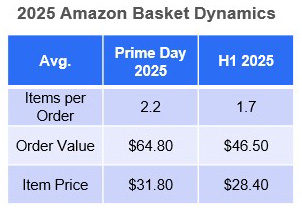
Brands should note that Prime Day Shoppers spend more during the event, transcending the classic “spearfishing” reputation to order 0.5 more items per order with a 40% bigger average basket.
Evaluating which price points resonated most with shoppers during Prime Day is also critical, as pricing strategy plays a critical role in driving conversion during highly promotional events
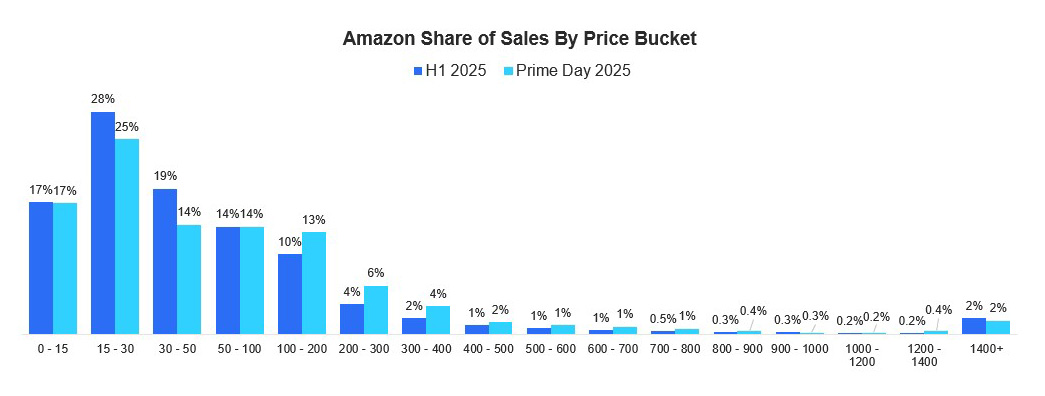
The most popular price buckets during Prime largely resembled what we have seen in 2025 thus far. Notable differences include were for products priced between $100-$400, with all price buckets in this range seeing Prime Day share of sales over-index by more than 1%. Shoppers often defer pricier purchases for shopping holidays like Prime Day, likely driving the surge here.
Prime Day Shopper Dynamics
As you plan for future Prime Days and other major retail events, it’s vital to understand the unique shopping behaviors that define this period.
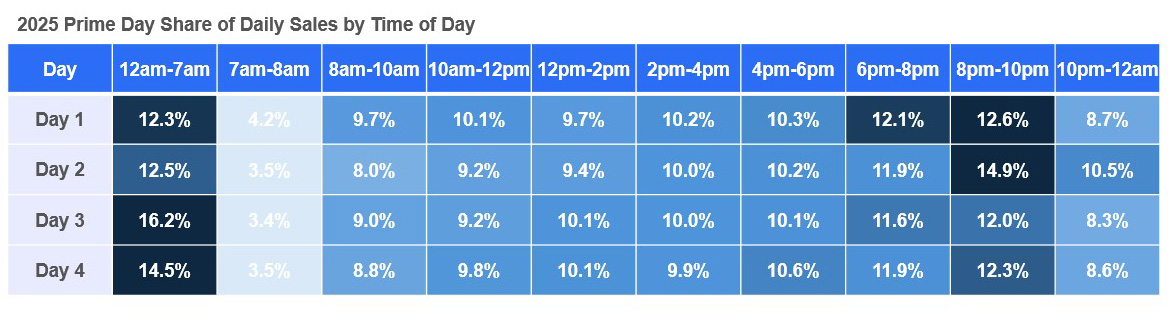
One key insight is the timing of purchases. This year the dominant shopping windows were sharp and specific: 12am to 7am and 8pm and 10pm were the top-performing hours. Understanding these peak hours can help brands better align their promotional and media strategies to maximize impact for future events.
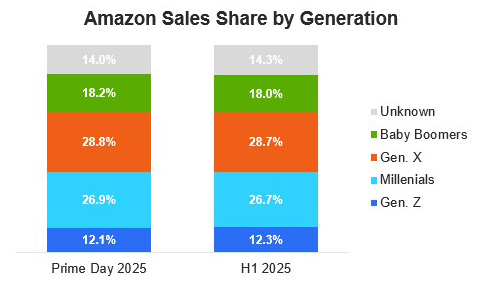
When it comes to generational trends, shopping shares largely matched what has been observed so far in 2025. Most importantly, Gen X and Millennials are the top shopping generations for the platform, highlighting key demographics that brands may want to prioritize in future campaigns.
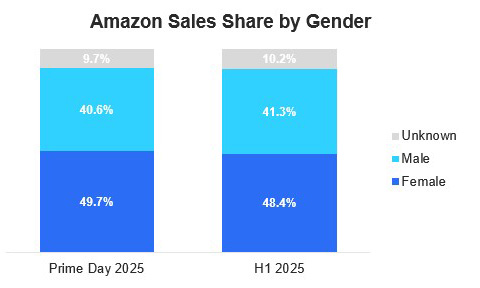
When looking at gender dynamics, women accounted for a higher share of sales compared to H1 2025 (a reversal of the trend we saw last year) suggesting a potential shift in engagement that brands should monitor closely.
When examining income levels, we found that, unlike last year, lower-income shoppers were not the top sales share over-indexing demographic during Prime Day. This trend may reflect broader economic pressures, with Prime Day considered by many to be a discretionary-purchase oriented event.

With Prime Day 2025 now behind us, it’s critical for retailers and brands to quickly assess their performance during the event and begin planning for upcoming sales moments, most notably the Cyber 5 period around Thanksgiving.
Top performers will want to identify and address barriers to success, such as gaps in digital shelf execution or inefficiencies in media and promotional spend. By resolving these issues, they can build a stronger, more effective playbook for future tentpole events.
What to Do Now
NIQ is here to help
If you want to go deeper into your product performance, shopper dynamics, or competitive landscape, let’s talk. The brands that win are the ones that learn fast and act faster.