Gauging consumer spending
Verret: Thank you for taking the time to chat with me, Ernie. I’ll start with the big question that’s been top of mind for many: Do election years have an impact on U.S. consumer spending?
Tedeschi: In general, the answer appears to be no. Consumer spending typically grows over the year leading up to the election—and then continues growing the year after the election.
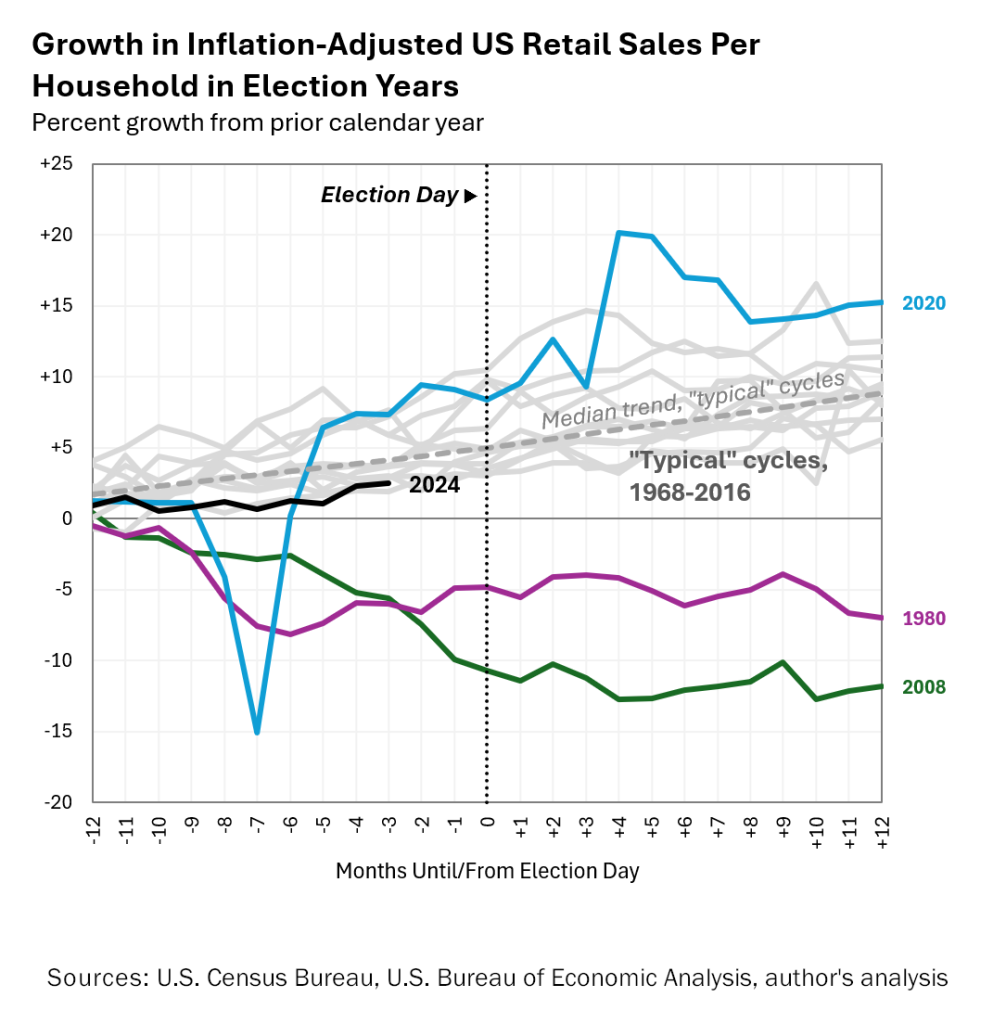
The figure below shows the level of real (inflation-adjusted) average retail sales per household over the 12 months before and after Election Day.
Each line represents a presidential election cycle since 1968 (e.g., 2024), and each line is benchmarked to average real retail sales per household over the prior calendar year. In other words: The 2024 line is telling us that real retail sales are currently 2.5% above 2023 levels.
The gray lines are “typical” elections. They represent every presidential cycle since 1968 (except for 2020, 2008, and 1980—more on that in a moment). The gray dashed line is the trend line calculated from the median of these typical cycles—think of the dash line as what’s “typical of typical.” As you can see, real consumer spending growth is normally fairly steady, with a median of about +0.25% per month (3.3% annualized) over the year prior to Election Day. There’s a small acceleration in growth in the year after the election, to +0.3% a month (3.9% annualized), but this shift isn’t statistically meaningful and barely noticeable on the chart, so we shouldn’t read too much into that. So far, 2024 has been within the range of past typical spending experiences, albeit slightly below the median trend.
There have been three outlier election cycles over the past half century that took place in the middle of economic downturns: 1980, 2008, and of course 2020 (during the pandemic). We show these cycles in the figure but do not include them in our calculations of a “typical” election cycle. Obviously, their dynamics are not good analogs for 2024’s election.
Watch
Yale economist Ernie Tedeschi discusses the impact of election years on consumer sentiment with NIQ thought leaders Lauren Fernandes and Courtenay Verret.
Let’s talk about consumer sentiment
Verret: Our recent Mid-Year Consumer Outlook showed that 43% of U.S. consumers feel they are financially worse off than they were a year ago, citing increased costs of living and job insecurity. This number is higher than the global average of 32%.
The survey also showed that U.S. consumers’ concerns over the ability to provide basic needs for their family rose by 6% from January to July, whereas globally, this concern remained neutral.
Is this sentiment reflected in what we’re seeing more broadly in the U.S. economy, or does the political rhetoric of election years tend to exacerbate these sentiments?

Tedeschi: This number isn’t an isolated finding. The widely followed University of Michigan Survey of Consumers found that, in September, 45% of respondents reported being financially worse off than they were a year ago—nearly identical to NIQ’s finding.1
There’s no question consumer attitudes display a partisan bias in the U.S., especially recently. In the Michigan survey, Republican sentiment was consistently 40 points above Democratic sentiment during the Trump Administration. Within six months of President Biden taking office, that number had flipped: Democratic sentiment was 40 points above Republican sentiment—and remains so now. Interestingly, this spread has remained more or less stable throughout 2024.
But it’s not just political bias. Several nonpolitical factors appear to be affecting consumer attitudes too. One is inflation and prices. In the Michigan survey—again, similar to findings from NIQ’s Mid-Year Consumer Outlook—40% of September respondents said household finances were worse because prices were higher than a year ago. These proportions aren’t much lower than when inflation peaked in 2022. At first blush, this seems hard to reconcile with what we know about objective economic data:
- Measures of inflation like CPI have cooled considerably over the past two years—so much so that the Federal Reserve felt comfortable beginning to cut interest rates in September.
- Real hourly wages are also up nearly 3% since June 2022—and are above pre-pandemic levels.
But these findings may not be contradictory after all. Consumers could be reacting as much to high price levels as to inflation (price growth). Even when inflation is back to normal, price levels remain high. Catch-up in real wages may help consumers acclimatize to higher prices, but psychologically, consumers attribute higher wages to their own merit and inflation to external factors. In other words, high wage growth doesn’t “balance out” bad vibes from inflation.

Zoom in on the labor market
Verret: What role does the labor market play in these consumer sentiment numbers?
Tedeschi: Here, the story is more mixed. By many measures, the job market is strong in level terms.
1
The unemployment rate in September was 4.1%—a low rate.
2
The working-age employment-to-population ratio and labor force participation rate are among the highest they’ve been since the dot-com boom of the late 1990s.
3
Over the last three months, the U.S. has added an average of 186,000 jobs a month, versus a “break-even” pace of about 100,000 needed to keep up with labor force growth—a solid performance.
However, measures of momentum like the rate of hiring, the rate of voluntary quits (which economists interpret as a sign of confidence in the labor market), and the rate of job openings have fallen not just to 2019 levels, but in some cases to 2017 or even earlier levels when the economy was weaker.
In the Conference Board’s U.S. Consumer Confidence survey, 31% of respondents thought jobs were “plentiful,” whereas 18% said jobs were “hard to get”—a difference of 13 percentage points. That difference, which is tracked closely by some economists and called the “labor market differential,” is the lowest it’s been since 2017 (other than in the middle of the pandemic), indicating a labor market in which it’s more difficult to find work than it was a year ago. It’s possible, then, that even though unemployment and layoffs are low, Americans are guarded about a labor market where it appears difficult to switch jobs or find new work.
The consumer say/do gap
Verret: This year, we’ve talked a lot about the consumer say/do gap—the disconnect between what consumers say versus what they actually do. Is it possible our current consumer sentiment is indicative of this phenomenon?
Tedeschi: I’m often asked whether low consumer sentiment matters for spending. In this instance, the answer appears to be “no.” Real retail sales grew 3.5% over the 12 months ending in July—a robust pace—and consumer spending has been a primary factor in the stronger-than-expected recent U.S. GDP data. Consumers may say they’re feeling down, but they’re spending like they’re happy.
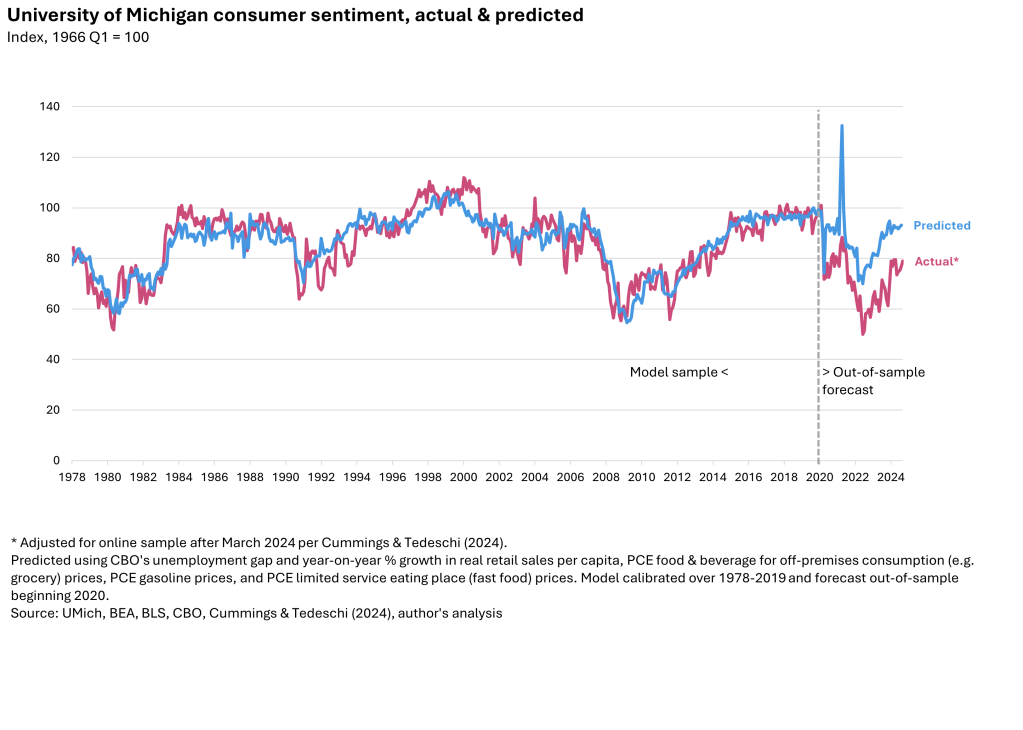
The chart below illustrates a simple model of consumer sentiment that uses just five metrics: the unemployment rate; growth in real retail sales; and inflation in grocery prices, gasoline, and fast food. The model is estimated over the 1978-2019 period and explains almost 80% of the pre-pandemic variation in sentiment. When forecast out to present day, beginning in 2020, the model suggests that consumers are spending as if sentiment were 25 points higher than it actually is.


Tedeschi: But this also means there may not be much upside to spending if consumers do grow more optimistic on surveys—because, say, interest rates fall lower, because the memory of inflation fades, or because the job market becomes more confident. In other words, while happier consumers would be welcome, if they’re already punching above their spending weight, then more optimistic consumers may not change their spending behavior significantly from where it currently is.

Candidate policies
Verret: It feels like we’re in a delicate position now, with inflation and interest rates slowly starting to come down. Are there any candidate policies in particular that might have a substantial impact on consumer spending power, particularly in CPG and Tech & Durables?
Tedeschi: There are a few notable policies that could potentially have an impact.
1. Tariffs
One policy proposes broad tariffs of 10-20% on all imported goods, and up to 60% on goods imported from China. These would cover everything: food, energy, durables, and tech.
Roughly a quarter of consumer goods spending is on imports or imported content (e.g., imported parts that go into domestic goods). The economic evidence is clear that ultimately consumers bear most of the burden of higher tariffs, so this proposal is of significant relevance for consumers and producers alike.
Consumers will have to make tough choices in the face of higher tariffs. Recent analysis I’ve done at The Budget Lab at Yale University found that, depending on the specific proposal, the initial cost to consumers of higher tariffs would average $1,900-$7,600 per household per year in 2023 dollars, depending on the specific proposal. That puts substantial pressure on incomes and spending. However, consumers may be able to mitigate that cost somewhat if they can switch to cheaper domestic substitutes of comparable quality—or to imported goods that are tariffed at a lower rate than the imports they buy now.
Higher tariffs will be more of a mixed bag for producers, depending on their specific situation. Firms dependent on imported goods or parts will feel pinched and will have to do some combination of raising prices, taking a hit on margins, or reconfiguring supply chains and production. For domestic firms who compete with foreign products, however, higher tariffs will create a tremendous amount of room for additional price increases and margin, since domestic products won’t be taxed. But remember that consumers will be hunting for better buys to replace expensive imports. In competitive markets, this may limit opportunities for domestic producers to take advantage of the margin opportunities tariffs provide.


2. No taxes on tips
Both campaigns have proposed excluding tipped income from taxation. This idea would modestly boost after-tax income. My colleagues at The Budget Lab found that this could save consumers $60 billion over 10 years—if the proposal were limited to just an income tax deduction and came with strict guardrails. If it came without guardrails and exempted payroll taxes, too, it could save about $200 billion over a decade, or about 0.02-0.06% of GDP. The effect may be larger if consumer tipping increased or if existing income were reclassified as tips because of the proposal.
Tipped workers tend to be low-income: Around 5% of families in the lowest fifth of income brackets had tipped income, versus just 2% of families in the top fifth. That means that the effect of this proposal is likeliest to be increased retail spending concentrated among lower-income groups. However, many low-income workers don’t pay federal income taxes, so the design of the proposal will be key. If just an income tax deduction, only 2% of bottom-fifth families will see any benefit; among those who do, their average benefit will be $220 per family. If tips count against payroll taxes as well, all 5% of bottom-fifth families with tipped income will see a tax benefit, averaging $590.
3. Expanded child tax credit
Another policy proposes expanding the Child Tax Credit (CTC) based in part on the 2021 expansion under the American Rescue Plan (ARP), raising it to $3,000 per child and $3,600 per child under 6 years old. The policy would give lower-income parents access to the full CTC rather than phasing it in with income. Unlike the 2021 ARP expansion, this CTC would rise to $6,000 for newborns. This proposal would cost about $1.4 trillion over 10 years, or roughly $140 billion a year.2
The experience from the 2021 CTC expansion was that parents generally used the extra money for necessities: food, utilities, rent, and clothing, as well as child care and school supplies. Researchers from the Annie E. Casey Foundation noted that food expenditures in particular jumped noticeably during the 2021 expansion. At the time, the majority of the credit appeared to go toward new spending rather than savings or paying down debt. The economic outlook for next year is uncertain: If the economy remains strong and out of recession, then families might choose to save more of any expanded CTC, giving it a bit less bang for the buck than it had in 2021. If the economy turns south, however, an expanded CTC may act as a form of stimulus—and families may spend out an even greater share of it than they did in 2021.

One to watch
Verret: Ernie, you’ve unpacked a lot about where things stand and what we might expect heading into a new year and a new administration. One thing’s for sure: Given how central these questions about the economy, overall outlook, and economic policy are, this election will be particularly relevant for consumers, retailers, and manufacturers.
Thank you so much for your time today. We look forward to our next conversation with you.
Tedeschi: Thank you, Courtenay. It’s been a pleasure chatting with you.
1 Tedeschi: As a caveat, however, other work I have done suggests recent changes to the Michigan survey have made it more pessimistic than in years past.
2 Estimated using the Child Tax Credit calculator from the Committee for a Responsible Federal Budget. Assumes full extension of the 2017 tax cuts.

Want to learn more?
As 2025 rapidly approaches, retailers and manufacturers are strategizing for the year ahead. From the economy, to product replacement cycles, to the impact of GLP-1 medications, Yale economist Ernie Tedeschi breaks down five key areas of focus, leveraging our Mid-Year Consumer Outlook.


