Omnichannel fast facts on the in-store and e-commerce landscapes
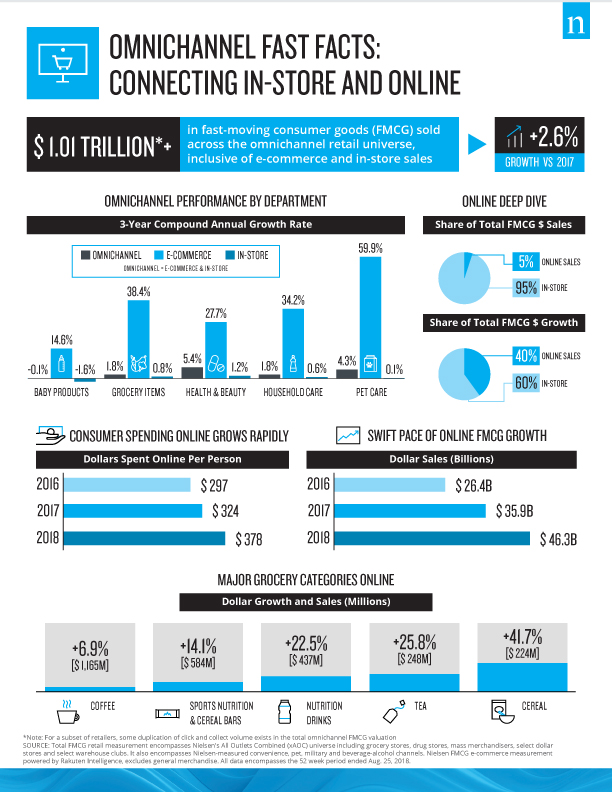
There’s no doubt that e-commerce is reshaping the global retail industry. But while online shopping is driving much of the growth, offline sales in the fast-moving consumer goods (FMCG) market are up this year as well. Specifically, on- and offline FMCG sales totaled more than $1.01 trillion* in the year ended Aug. 25, 2018, which is 2.6% more than a year ago. It is worth noting that e-commerce accounted for 5% of total omnichannel sales, but drove 40% of its growth.
Relative to total FMCG spending, U.S. consumers are increasing their online spending more than their in-store spending. In the year ended June 30, 2018, the average U.S. consumer spent $5,110 on FMCG items, which is up 1% from the prior year. Comparatively, the average consumer spent $378 online during the same period in the year ended Aug. 25, 2018, which represents an increase of more than 16% from a year earlier.
While it might be tempting to look at on- and offline shopping trends individually, doing so limits the ability to see the synergies between the two channels. For example, click-and-collect shopping has increased 30 percentage points in the past two years: it represented 18% of online grocery sales in 2016 and now represents nearly half (48%).
Here’s a look at the current multichannel shopping landscape across the U.S.
*For a subset of retailers, some duplication of click and collect volume exists in the total omnichannel FMCG market valuation