
Flavored options are a winner in whiskey sales
Flavored whiskey is in the spotlight
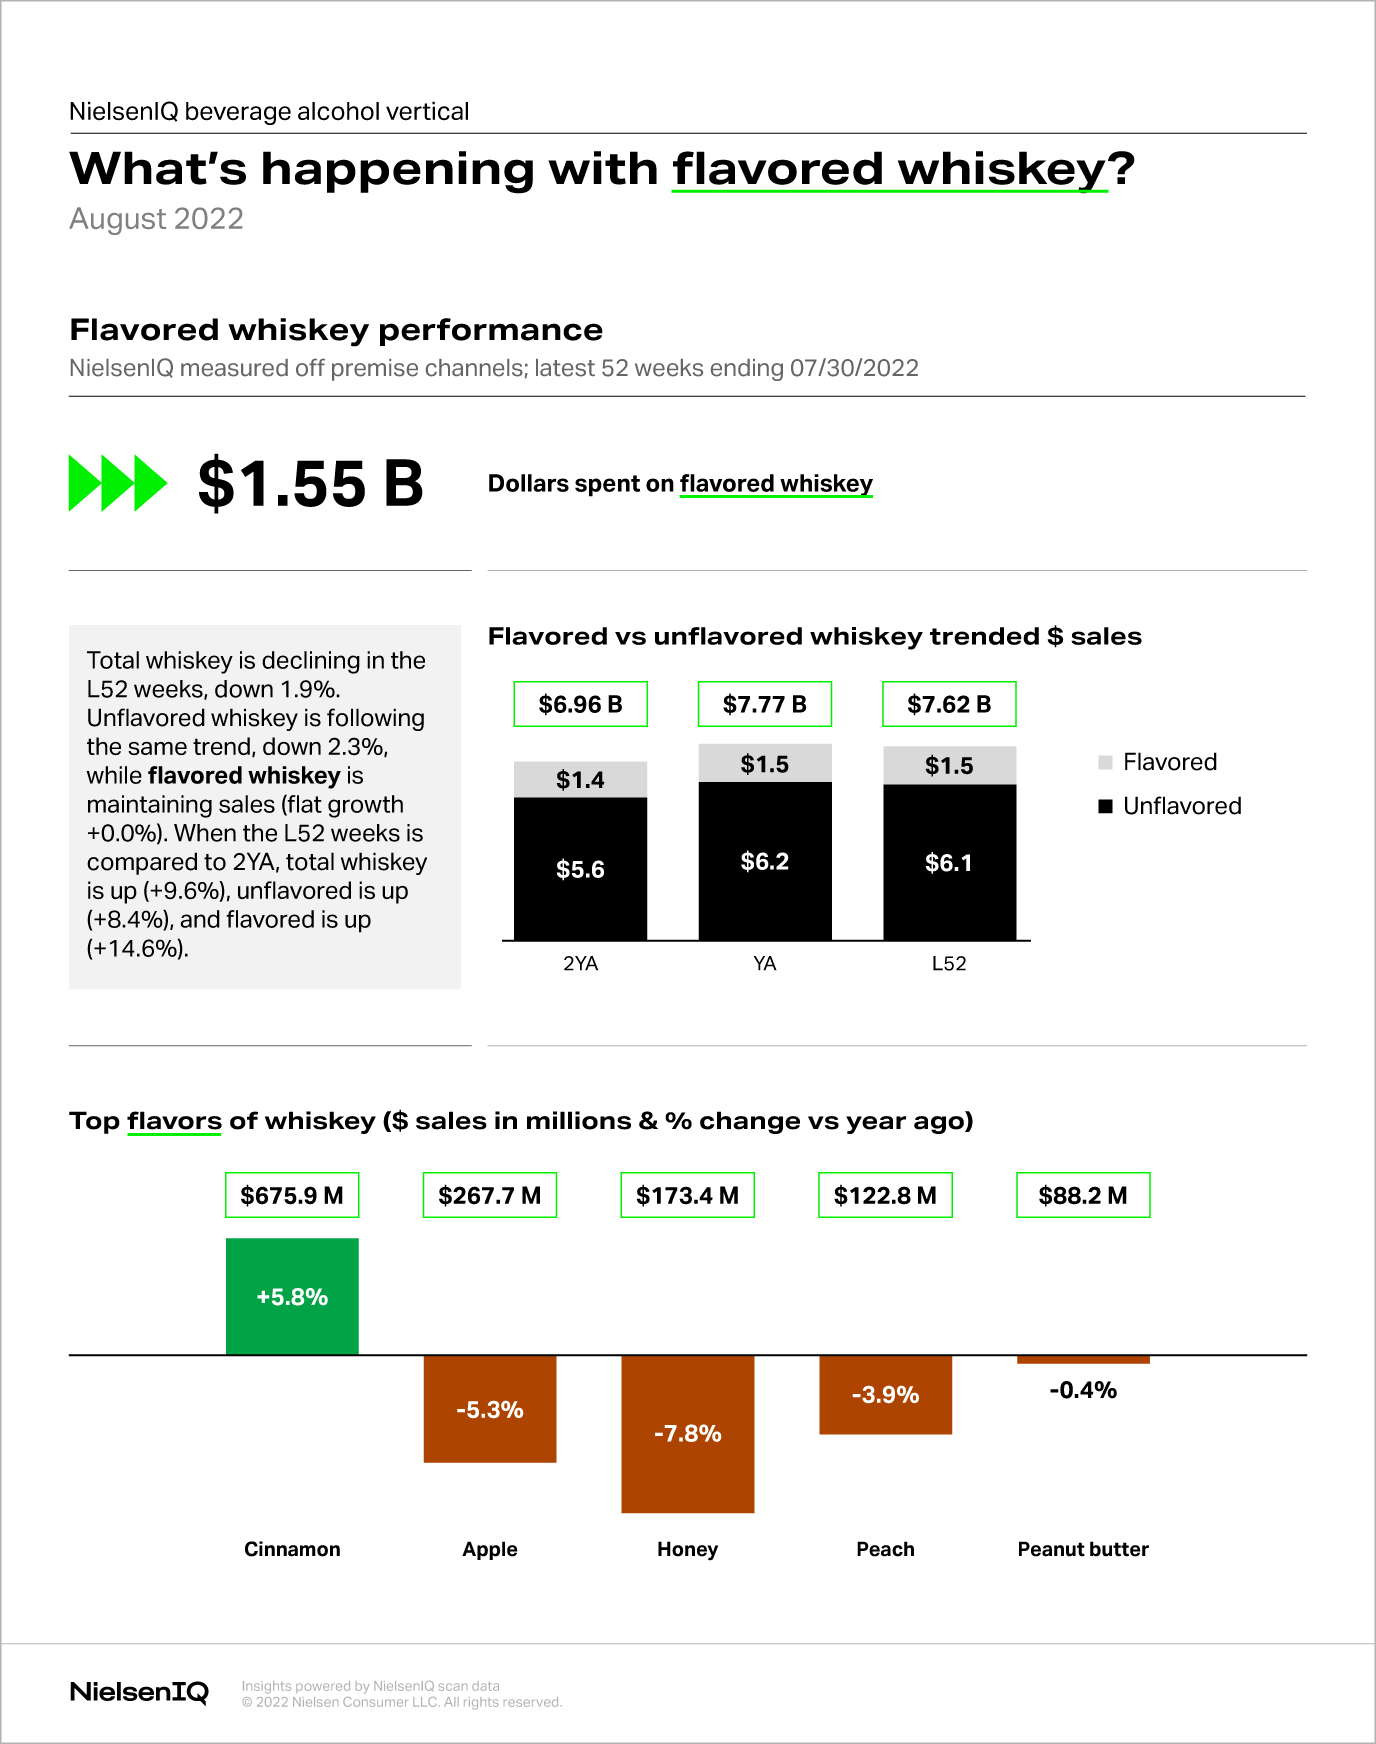
At the end of July 2022, NielsenIQ data shows that whiskey sales were up by 9.4% in comparison to two years ago. Within this time period, sales of unflavored whiskey grew by 8.4%, but flavored whiskey was the real star of the show with sales jumping up by 14.6% in comparison to two years prior.
But things aren’t entirely clear cut. When the same figures are broken down for the past year, Nielsen IQ’s whiskey data shows that in the past 12 months, the overall whiskey category has seen declining sales—after a peak in popularity in 2020.
Between August 2021–2022, overall U.S. whiskey sales dropped by 1.9%. Our whiskey data shows that sales of unflavored whiskeys decreased by 2.3% and only sales of flavored whiskey have shown flat growth. In short, flavored options are attracting the most consumer interest in the category right now.
A closer look at flavored whiskey trends
Cinnamon spices things up
In the 52 weeks up to August 1st 2022, flavored whiskey data shows overall sales of $1.55 billion.
Cinnamon whiskey is the trending choice right now. In the past year, sales of this spiced alcohol have reached $675.9 million— an increase of 5.8% from the previous year.
Apple is the next biggest hitter, with sales of $267.7 million. However, sales of this fruity favorite have dropped by 5.3% over the past year, according to our flavored whiskey data.
Honey is the third most popular, with sales of $173.4 million, followed by peach ($122.8 million) and peanut butter (88.2 million). Although all have still made strong sales, they have declined over the past year, with honey dropping by 7.8%, peach by 3.9%, and peanut butter by 0.4%.
Right now, it seems that our love affair with flavored whiskey is set to continue and the nation is filling their lowball glasses with a warming cinnamon choice, but as our flavored whiskey data shows, this can quickly change and there could very well be a new favorite for 2023. Watch this space.
Source: NielsenIQ Scan data: 2 years = August 1st 2020 – August 1st 2022; 1 year = August 1st 2021 – August 1st 2022.

Looking to learn more?
Interested in accessing alcohol industry trends like this whenever you’d like? NielsenIQ BevAl Solutions are coded to display the alcohol trends and data you need in a friendly, easy to use platform. Empowering you with actionable data at your fingertips.