
The Omnichannel Reporting Challenge
Consumer Packaged Goods (CPG) e-commerce insight leaders face a daunting challenge in today’s omnichannel retail environment: the need to close reporting gaps and gain a complete view of their market. One consistent blind spot that is likely contributing to strategic missteps and underreporting more than any other is the Amazon blind spot.
So exactly how large of a gap are we talking about here? Consider that
a recent NIQ analysis shows that some CPG e-commerce insight leaders are leaving more than half of their addressable category unreported to the C-suite.
Yes, you read that correctly – more than half.
As we know, in today’s omnichannel (in-store plus online) environment, no CPG channel functions truly independently – signaling that your organization’s Amazon blind spot is almost certainly contributing to strategic misfires or misreporting relative to your products, categories, and competitors’ performance.
So how can you tell if your organization has the omnichannel view it needs to remain competitive?

How Full is Your Omni View?
A quick way to assess is to ask yourself: How many of the following business questions is my organization able to answer accurately and confidently?
- How are your sales and share online and in-store performing vs. those of your competition?
- What are your current sales and share within Amazon vs. those of your competition?
- What share of sales and growth does Amazon account for?
- What brands within your portfolio are growing online and in-store? How does this compare with who is growing within your competitive set?
- Who are your biggest competitors in-store, online, within Amazon, and across emerging marketplaces?
- How well are your Amazon product pages performing vs. those of your competition?
- What does your performance look like at the item level in Amazon?
- Where are your greatest opportunities for growth online and in-store?
If you’re like most organizations we chat with, chances are your omnichannel strategies could benefit by increasing your market read for one, some, or many of the above. If this is the case, keep on reading!
Let’s start with the basics…

Omnichannel vs. Multichannel Retail
Omnichannel retail and multichannel retail are two entirely different beasts that require distinct strategies and tactics. In multichannel retail, online and offline channels operate in independent silos with little consideration put toward a seamless shopping experience. Across the industry, the multichannel mindset is fading fast as many see it for what it is: an outdated approach. The response has been to adopt omnichannel retail, which strategically capitalizes on the obvious synergy that exists between in-store and online channels and embraces opportunities to report in a fashion that more accurately and meaningfully captures the behaviors of the shoppers of today (and tomorrow). Omnichannel strategies recognize that customer journeys are no longer linear, with consumers switching between channels depending on their needs and preferences.
From this point forward, we’ll assume the reporting needs of your CPG organization safely fall into the “omni” bucket.
The Total Omnichannel Opportunity
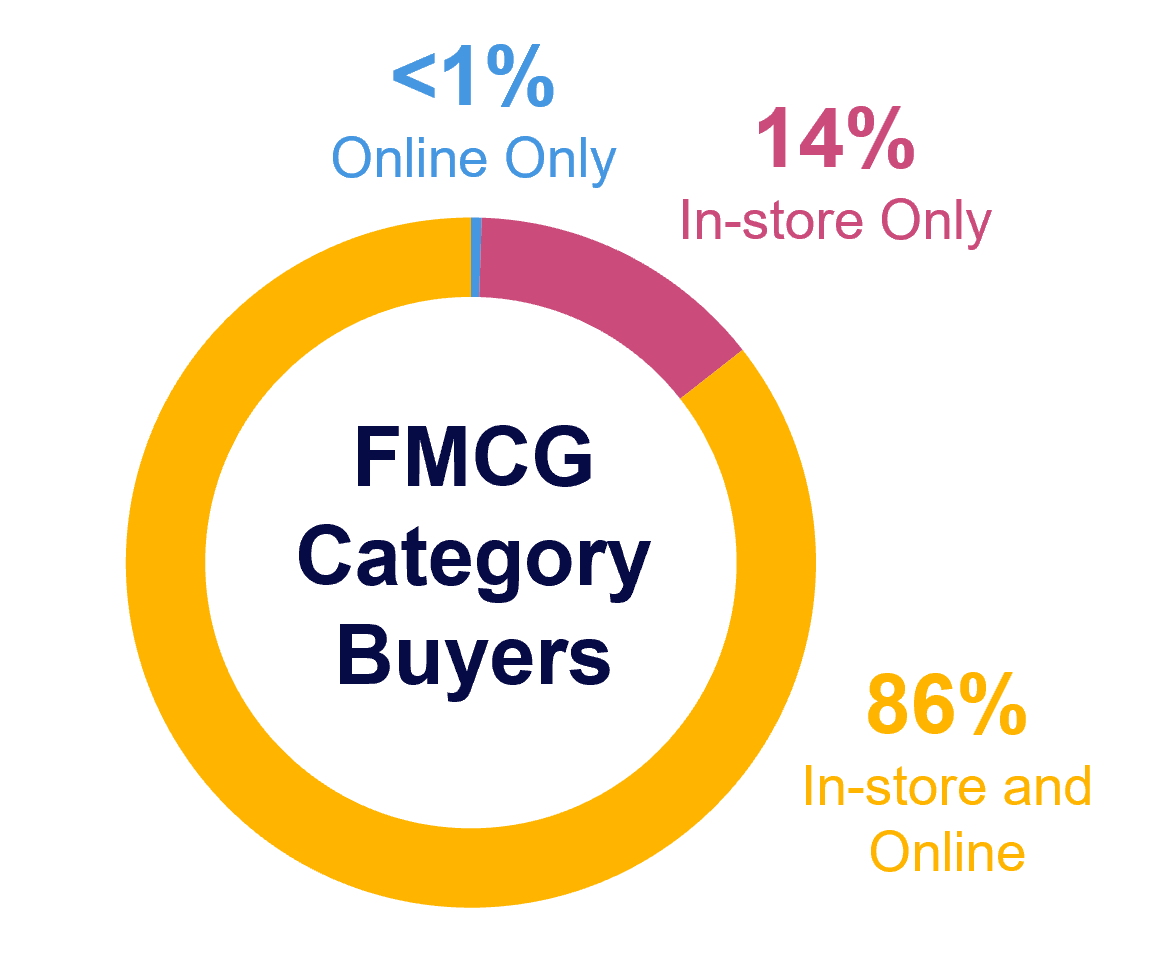
According to NIQ Omnishopper data, 2022 brought close to 15 million new online CPG shoppers to the table. Within the US, 86% of CPG dollar sales are represented by “omnichannel shoppers.” Of those omnichannel shoppers, many are making purchases across Amazon’s wide-reaching network of online and brick-and-mortar markets.
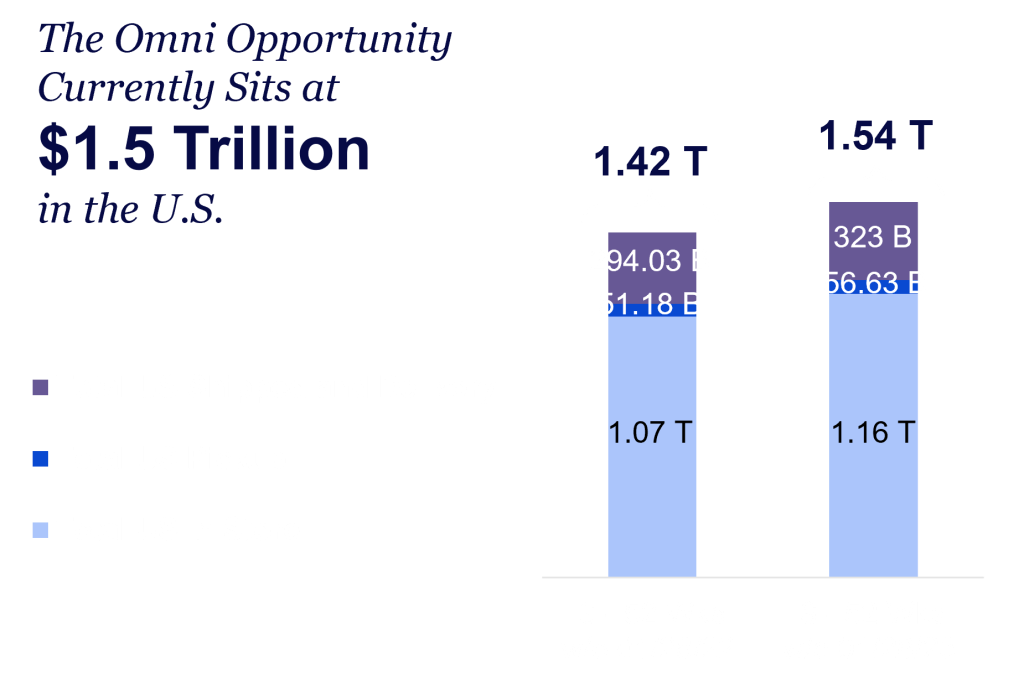
Now that we can visualize how vast the omni landscape is, let’s talk revenue. How big is the omnichannel revenue opportunity, and how much revenue is on the table if your blind spot(s) disappear? $1.54 trillion.
And we know what you’re thinking: Yes, that’s the entire omni landscape.
How much would closing the Amazon blind spot benefit my category and business, specifically? Well, naturally, we dug into those data points too.
Source: NIQ Omnishopper, Total US, 52 weeks ending 12.31.22
Source: NIQ OmniSales Measurement, Total US, Prev 52 Wks – w/e 01/28/23

Source: NIQ OmniSales Measurement, Amazon Sales & Share, Total US, Prev 52 Wks – w/e 01/28/23

From Blind Spots To Breakthroughs
Closing the omnichannel reporting gaps for ecommerce insight leaders.
Reporting on the Omni Landscape Across Departments (U.S. Only)
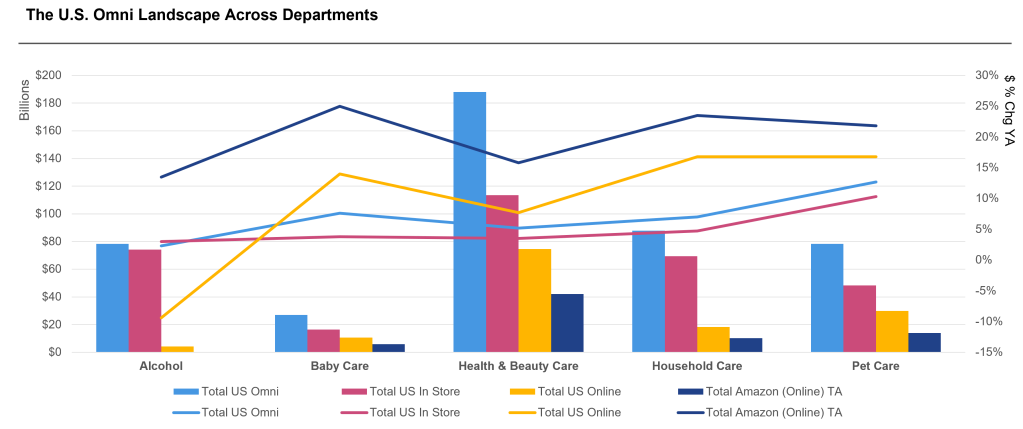
When we drill down to department level, the total opportunity across in-store, online, and Amazon becomes clear. The split between in-store and online activity continues to widen, but the pace and extent of that widening varies by department. While many e-commerce insight leaders have at least a partial view into holistic omni performance metrics, they are often lacking the right level of granularity when it comes to department and category – leading to potentially misguided omnichannel strategies and activations.
For example, within the NIQ analysis pictured above, omni growth is clearly occurring across CPG departments. Digging deeper, we can see that in the 52 weeks leading up to 1/28/23, the food department delivered the largest amount of dollar sales – $877 billion – with both high food prices and inflation across the omni landscape contributing to said growth.
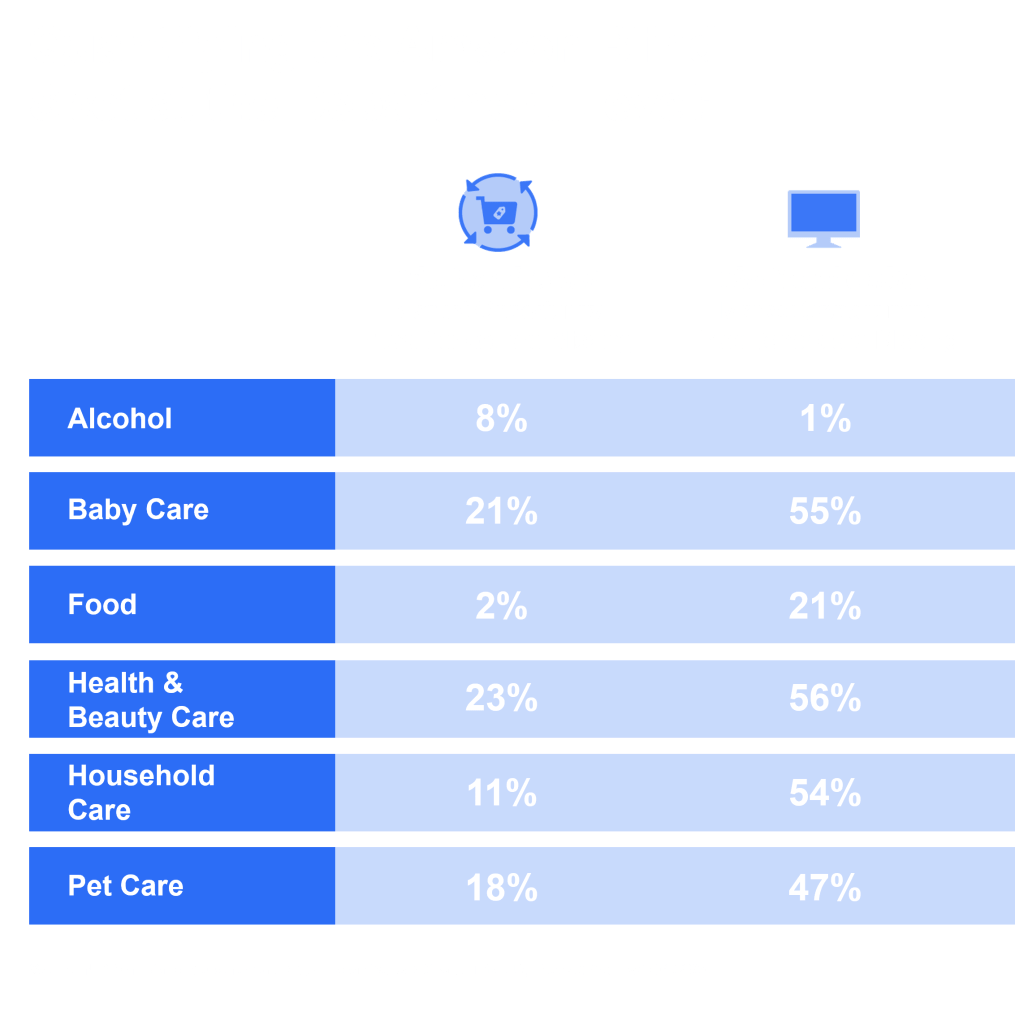
NIQ’s omni data also shows that more food dollars are being spent in-store than online. But notably, within the U.S., 21% of online CPG food is being purchased on Amazon.com. When examining this department alone, we’re talking about a 21% blind spot.
And the pet care department is showing the strongest growth rate (at +12% versus a year ago) across the total US omni environment.
When it comes to softening departments, while the holistic omni landscape for the US alcohol category looks strong, the breakdown below reveals continued softness within online alcohol sales (-9%) versus a year ago. The online alcohol boom sparked in 2020 by Covid has certainly cooled down. Without question, the return to bars and restaurants after the pandemic-related pause has shifted the omnichannel alcohol landscape once again. Beverage alcohol brands continue to struggle with e-commerce related challenges related to the 3-tier distribution system, age verification, and high-fees associated with same-day delivery services.
So, what is the total Amazon blind spot? That comes in at right around $90 billion.
The key takeaway for e-commerce practitioners is clear: Reporting (both laterally and vertically) must be done with accuracy and granularity to deliver a successful omnichannel strategy across departments that capitalizes on the total omni opportunity.
Now that we’ve established the high-level omni opportunity, we’ll dig into what makes it so hard to eliminate the Amazon blind spot. First off, it’s challenging to even obtain these data without the right supplier. On top of that, omni teams are plagued by consistency and accuracy challenges. Even when they have the right data supplier, they need to know what data the supplier should be providing to eliminate said blind spot. Finally, teams need to know how to successfully activate with these data to capitalize on today’s $90 billion Amazon omni opportunity.
Industry-Wide Omni Reporting Challenges Speak to Issues of Overall Accuracy
We all know that useful data is trustworthy data. In the omnichannel ecosystem, “trustworthy” means both accurate and complete. The proliferation of marketplaces, direct-to-consumer (DTC) brands, pure play online retailers, and brick-and-mortar stores has resulted in an increasingly difficult sphere to truly measure end-to-end.
What does a lack of confidence in omni data mean for your business? It means practitioners are unsure of whether they’re maximizing opportunities across their products and categories. It means constant fear that the absolute growth is not competitive – relatively speaking – when attempting to examine overall product and category-level performance. It means misreporting to the C-Suite and skewing organizational strategies in both the long- and short-term.
What are the odds your team feels this way? Well, a 2022 survey from Data Impact revealed that a whopping 82% of e-commerce practitioners do not fully trust the data they have in hand to make accurate and actionable omni retail decisions. Your team is almost undoubtedly struggling with a lack of confidence in their data.


Improving Visibility (and Confidence) Requires an Accurate, Full View into Your Omnichannel Landscape
Trusted, holistic data sources fuel omni insights and improve practitioners’ abilities to eliminate strategic misfires – closing known (and previously unknown) performance gaps and capturing incremental wins in both brick-and-mortar and e-commerce environments.
As we’ve seen, no view is complete without Amazon data. So, what data should I be asking for to improve my organization’s omni visibility – particularly as it pertains to Amazon?
Amazon data gets complicated fast, but that doesn’t mean you can’t pump the brakes to focus on a few specific, critical elements with your CPG data supplier about. Those elements include:
• Data “freshness” relative to Amazon reporting.
• Product-, category-, and department-level Amazon reporting.
• In-store, in-app, and online Amazon data.
• First-party (1P) and third-party (3P) seller-level data.
• Hourly data refreshes to capture Amazon algorithm updates.
Want to see an analysis of your Amazon share?

Activating Holistic Amazon Data Across a Single Department
To better understand exactly why these nuanced data are useful (and how they’re monetized), we’re going to take a close look at a single department, pet care, as a model to show precisely how valuable accurate, granular omnichannel data is to CPG organizations.
We’ve established that there’s a huge revenue opportunity available to organizations that are able to close the Amazon blind spot, and we know the questions we should be asking to get there, but how do we activate the data to win across our key products, categories, and departments?
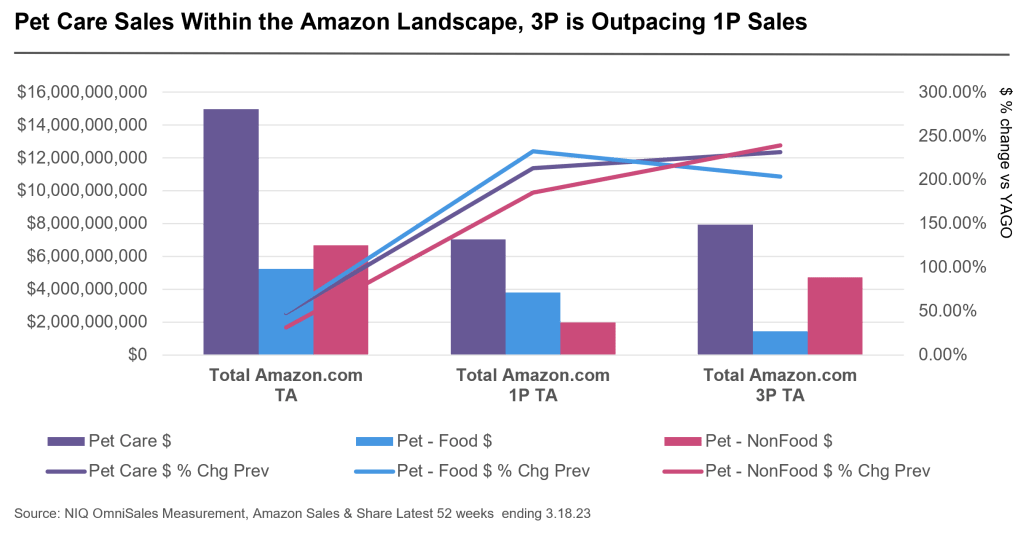
When digging into pet care category performance within the full Amazon retail environment, NIQ data show greater growth coming from 3rd party sellers. When expanding the scope of the analysis to look at non-food vs food-based categories within pet, NIQ data shows that Non-Food pet categories accounts for almost 60% of the 3P volume while Pet Food is only 20% of those Pet 3P sales.
Understanding the performance of 1P and 3P sellers can help e-commerce insight leaders identify new growth opportunities across the omni landscape and make data-driven decisions about how to optimize their omnichannel strategy. This information can also help identify areas of investment to remain competitive.
Within the industry you serve, do you know who the top players are across 1P, 3P?

Who is Winning Across the Competitive Amazon.com Landscape?
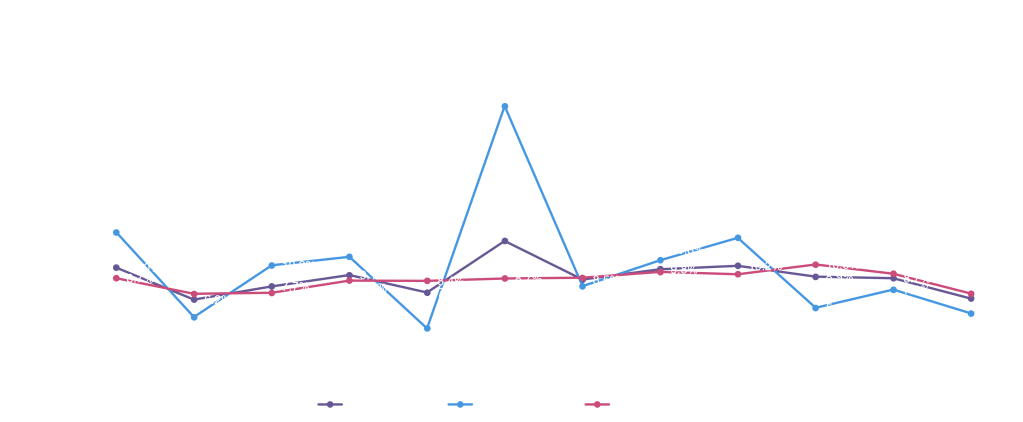
Across the top 5 performing pet food brands within the wet/dry pet food category sold on Amazon.com, most of the category leaders are seeing double digit percentage growth versus a year ago, with the exception of the #4 player who is seeing a 19% decline. At the surface level, this reveals competitive weaknesses; however, at a larger strategic scale, this level of visibility may reveal blind spot growth opportunities.
Amazon Deep Dive: The Wet/Dry Pet Food Landscape Within Amazon Is Tight; Competitive Weaknesses Are Revealed
Source: NIQ OmniSales Measurement, Amazon Sales & Share Latest 52 week ending 3.18.23
For e-commerce insight leaders, a view into competitive performance across the Amazon landscape can dictate strategic activations to grab opportunities away from competitors. Increased visibility into this space can also serve as a grounding function for your own business to assess the true growth of your business versus general category growth. There is real potential for practitioners lacking visibility into the competitive Amazon landscape to possibly misreport on anticipated growth rate figures without the larger, full view of the entire Amazon landscape. How confident are you in the growth figures you are currently reporting across Amazon?
Leveraging Accurate, Precise Omni Data for Key Activation Touchpoints Across the U.S. Omnichannel Landscape
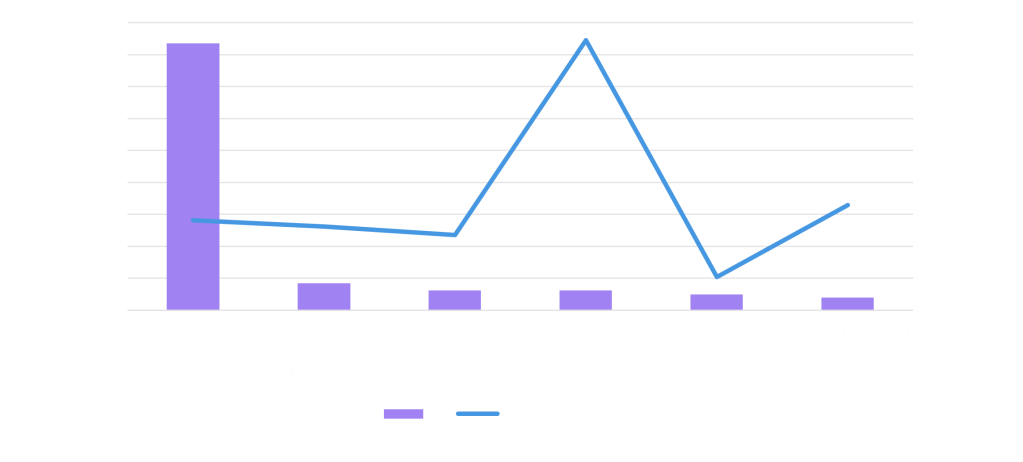
Within an effective omnichannel strategy, leveraging data to know how and where to strike is just as important as knowing when to strike. A quick look into omni shopping across 2022 shows notable peaks and valleys with unique variances across the total omni, in-store, and online environment.
E-commerce insight leaders and C-suite officers would be wise to take special note of the spikes reflecting CPG retail moments throughout the year. Perhaps most surprising is the fact that the biggest spike in CPG omni retail in 2022 came around Amazon Prime Day, not Black Friday or Cyber Monday. It should be noted that online CPG sales – even outside of Prime Day – are much more volatile than in-store sales, which tend to vary little from month to month.
For e-commerce insight leaders, understanding the peaks and valleys relevant to their operational omni environment can be a strategic differentiator. More specifically, e-commerce insight leaders who can clearly determine when to activate promotions and invest critical marketing dollars are better positioned to create winning omnichannel strategies.
Source: NIQ OmniSales Measurement, Total US, 12-month analysis through 4 w/e 1.28.23
Get the Right Data from the Right Data Supplier to Close Your Amazon Blind Spot
/
5 Key Considerations for E-commerce Insights Leaders
1
Without a full view into the omnichannel landscape, e-commerce insight leaders are at risk of leaving more than half of their addressable category unreported to the C-suite.
2
The omni opportunity for CPG e-commerce insight leaders currently sits at $1.5 trillion; for many, Amazon.com is a $90 billion online blind spot.
3
Measuring Amazon means more than Amazon.com. For omnichannel reporting, a full view into Amazon performance should reflect Amazon’s retail landscape across brick-and-mortar and online outlets, updated by the hour.
4
Understanding the performance of 1P and 3P sellers on Amazon can help e-commerce insight leaders identify new growth opportunities across the omni landscape and make data-driven decisions about how to optimize their omnichannel strategies.
5
To be successful, e-commerce insights leaders must have an omnichannel view inclusive of Amazon.
Ready to take the next step toward closing your team’s data gaps?
Explore how a floor-to-ceiling window into the data insights your business requires can eliminate blind spots and help your business capitalize on an effective omnichannel strategy today.