Harness local execution at scale to drive growth
Executing tailored tactics that reflect the nuances of local markets has historically been a challenges for CPG brands. The retail data of the past could only take you so far—individual store data was too granular to make decisions at scale, while market or retail chain data was too broad to pin point specific revenue-driving actions.
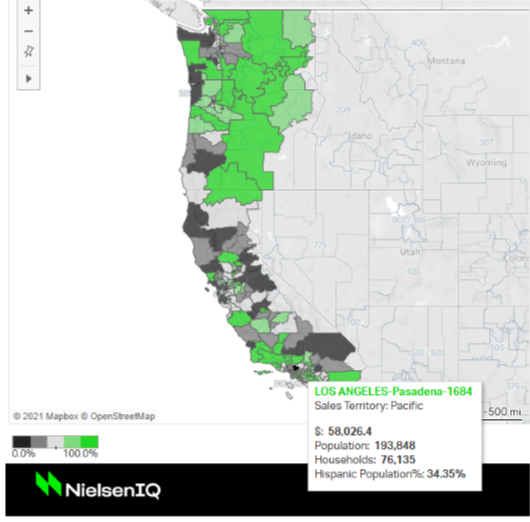
NielsenIQ Precision Areas, a first-of-it’s-kind solution, provides the sweet spot for local execution that drives local growth. Built on patented methodology, the solution links store-level retail sales data, Census Bureau-published demographic data and geospatial data to create and measure 2,200 neighborhood-level areas across the country so manufacturers can finally assess market performance on a local level, at scale.
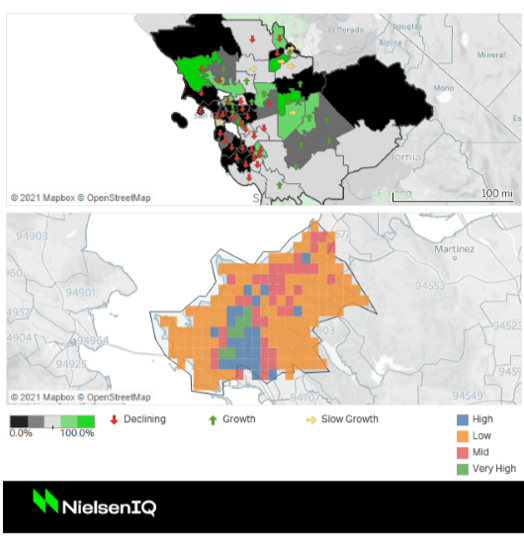
An interactive web application with pre-built visualizations, allows organizations to navigate the impact of demographics or specific points of interest on performance, overlay sales territories to efficiently prioritize opportunities each team member can pursue, or zoom down to 1×1 square-mile grids to pinpoint high-density areas for marketing activities.

Precision Areas Strategy Guide
Learn more about how you can scale local execution through Precision Areas.
Three outcomes from local performance insights
Below are three examples of how national manufacturers are using NielsenIQ Precision Areas to drive impactful local decisions.
1. Grow underdeveloped or declining local market share:
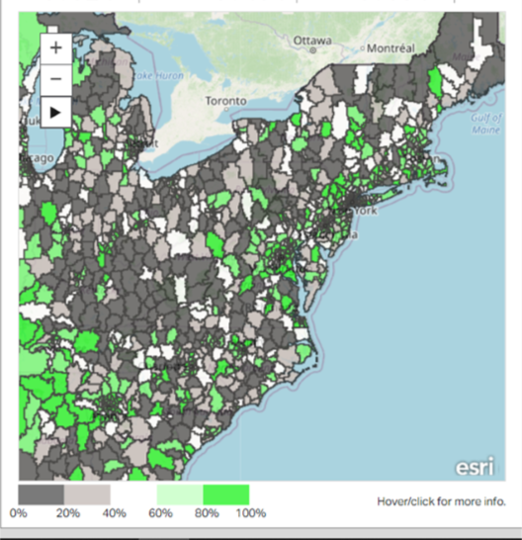
A visual dashboard immediately illuminates the strength of a brand’s market share across the 2,200 precision levels so CPG managers can visually assess areas of leading share and growth opportunities. Double-clicking into a selected area highlights a brand’s performance against key competitors, and modeled analytic data quantifies the impact from different levers in each Precision Area.
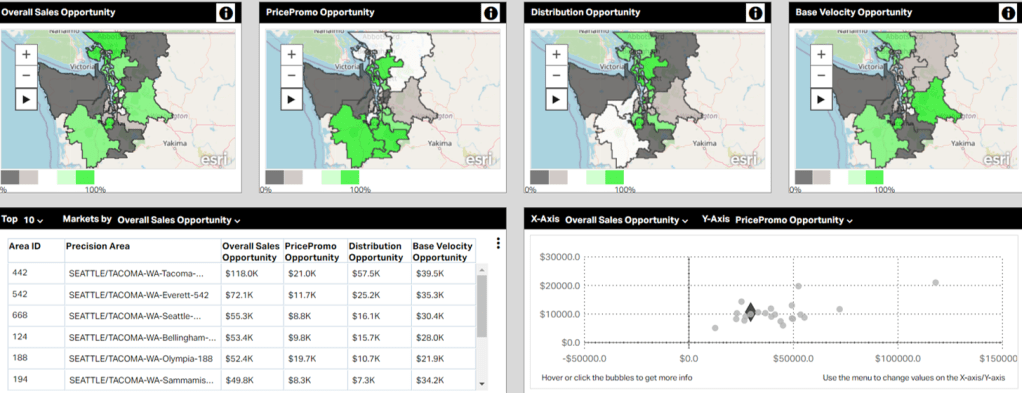
In the dashboard below focused on the Seattle/Tacoma metro area, a national manufacturer quickly identified a distribution or assortment gap in the Tacoma area. A correction could drive an additional $50K in annual sales. Extrapolating that opportunity across 2,200 Precision Areas could amount to $90-$110 million in growth, numbers every executive can support.

Overlaying performance changes also illuminates that two areas have high share, but suffer from declining sales. Running additional promotional support to offset some of the recent price increases could halt the declining sales trend before it grows even worse.
2. Refine digital marketing campaigns:
Digital campaigns can be helpful in targeting prospective customers, but casting too wide of a net often diminishes the ROI of marketing activities. Using a more precise combination of sales performance and demographic data helped one manufacturer refine their target from 200 locations to 35 precision areas. The budget savings offered the option of investing more heavily in their highly targeted areas or repurposing that budget for secondary campaigns.


The company used a combination of metrics from their Precision Areas data to revise their digital marketing plan. They first quantified and ranked their sales opportunity to evaluate if the expected ROI for certain areas was realistic based on the market size. Comparing competitive brand performance across key performance indicators helped refine the value proposition of their marketing message. Next, analysis of demographic information ensured the target audience matched their core customer base. Zooming into the most densely populated areas could have further informed the strategy with secondary marketing tactics like outdoor advertisements to complement the digital campaign.
3. Control distribution allocation:
As persistent supply challenges continue to plague manufacturers, inventory control and order fulfillment remain strained and require constant evaluation and modifications. Add the growing movement in online shopping, with 86% of shoppers now qualifying as omnichannel shoppers, and the logistics for inventory control are a nightmare to manage. Unfortunately, it’s also a mission-critical part of CPG business since shoppers can’t buy your product if it’s unavailable.

If there isn’t enough inventory to keep all shelves fully stocked or completely fulfill all orders, strategically managing distribution allocation on local levels can at least ensure the best sales opportunities are fully stocked. An assessment of sales performance and velocity can assist in enterprise decisions around order fulfillment. Overlaying retailer distribution warehouses or integrating internal shipment data can assist with tough decisions on inventory allocation and even shine light on opportunities to tailor distribution models in local areas.
Small changes can compound to big outcomes
Optimizing local execution at scale is the most recent tool manufacturers are investing in to find pockets of high value growth opportunities. As inflation continues to challenge brands’ pricing sensitivities and supply disruptions continue to complicate distribution, Precision Areas are helping manufacturers optimize resources, prioritize opportunities and scale local market share gains.


