The story of Health and Beauty manufacturer
Manufacturer H is a dominant player in a highly competitive Health and Beauty (H&B) category, holding a significant 60% market share. However, despite its market dominance, the manufacturer is grappling with several challenges.
This ever-dynamic category has too many items spread across different segments: around 150 selling items and only 85 of them make it into the store. The development of new shopping habits among consumers has further complicated the category leading to the creation of new segments. However, the category performance still depends on its biggest segment. And, since the category has a large concentration of sales in a few products, only 20% of the portfolio generated more than 60% of the sales.
How a Manufacturer-Retailer strategy can work
The manufacturer recognized there was a need to better understand items’ performance: not only looking at sales, but also analyzing the incrementality and cannibalization that each item generates to identify which items were “must-haves” and which to consider delisting.
In addition, Manufacturer H was also looking to provide insights to Retailer B to find the best assortment strategy to achieve category growth and drive sales for both entities. With this in mind, NIQ conducted a study for Manufacturer H to fulfill these ultimate goals:
- Gain a better understanding of segments’ performance and interaction between them.
- Identify the ideal number of items to have by segment, size, and brand.
- By doing so, optimize Manufacturer H’s category offering and improve its position as a strategic advisor for Retailer B.
The stages of an NIQ Assortment study
NIQ assortment consultants developed an analysis to have a better understanding of how the category was performing, where the opportunities were, and recommendations for the best assortment to obtain sales growth.
Then the consultants worked closely with the manufacturer, as the category expert, to review the results and make adjustments needed based on the category strategy and implementation limitations.
And lastly, both NIQ and the manufacturer presented the results to the retailer to keep all parties aligned with the recommendations. They also agreed on pilot stores, so the manufacturer began working on the planograms and started the implementation.
Category growth? Check — and aiming for more
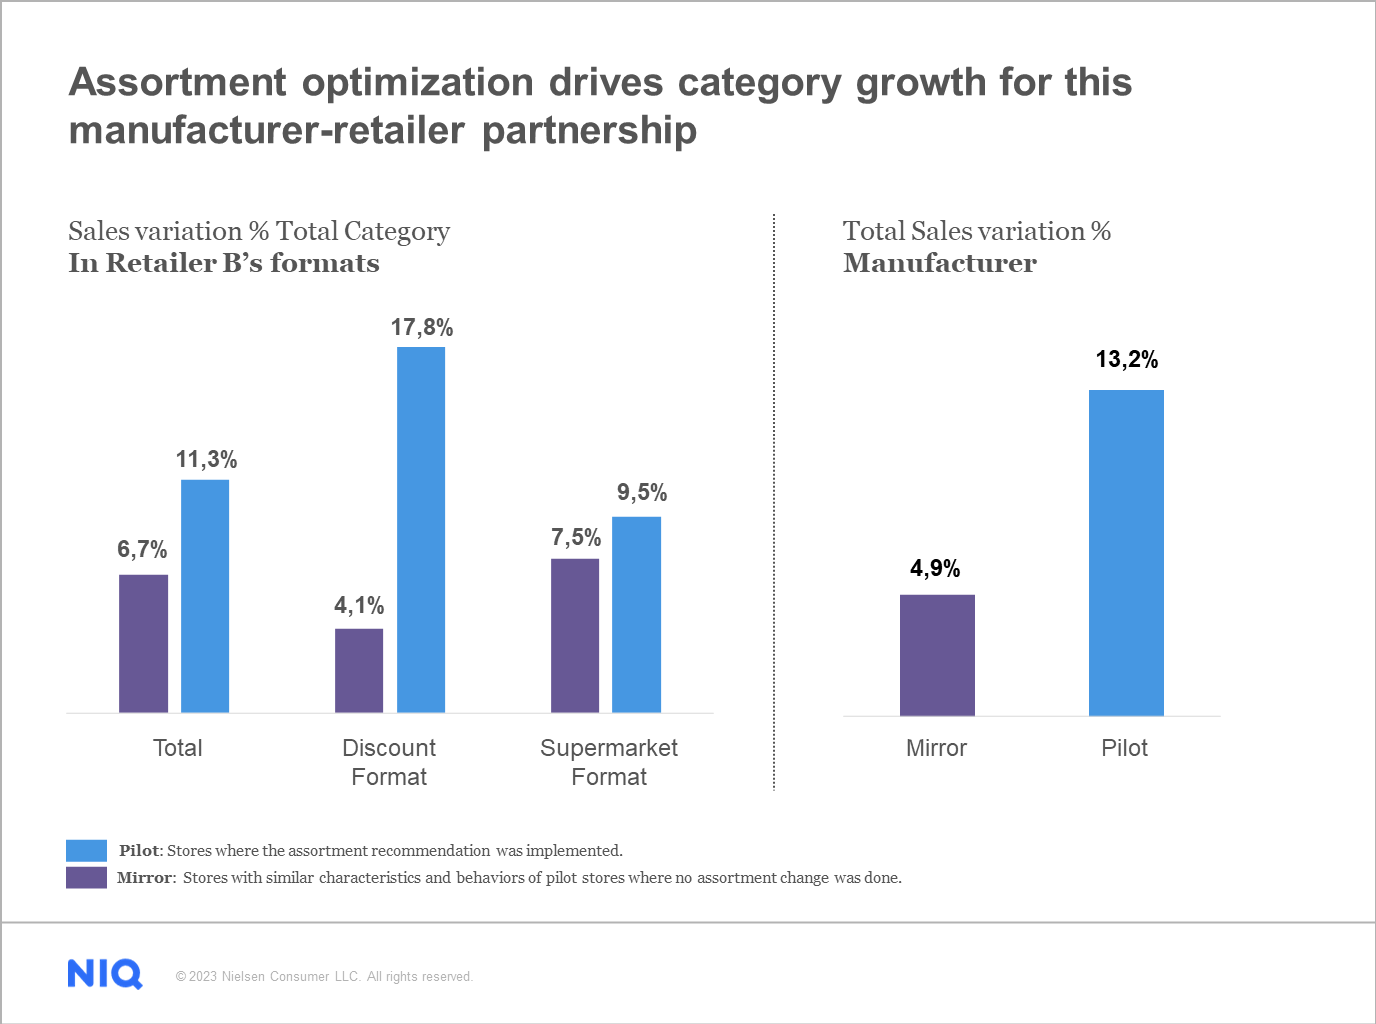
Based on the final planograms, the 3-month implementation began in the pilot stores defined by the retailer. During this period the category grew 4.6pp (percentual points) more, representing a sales increase of 11.3% in pilot stores vs.+6.7% in mirror stores.
On the other hand, the manufacturer’s sales growth was 13.2% in pilot stores, while in the mirror ones, it was 4.9%. These increases came from the opportunity to reduce the number of active items by around 40% while maintaining the same average number of items per store.

In the case of the Supermarket format, the larger segments were rationalized giving space to smaller segments that were incremental to the category but choosing the best items in incrementality. While in the Discount format, it was the other way around, maintaining the possibility of increasing the number of items in the larger segment while reducing the smaller segments.

Your portfolio is too important to depend on fragmented data
If your category is facing similar challenges, or if you would like to achieve similar results, we can help. NIQ experts improve the way you characterize, organize, and visualize your shelf; and — most importantly — the way you leverage NIQ’s unique incrementality data to drive revenue.
When integrating data and models into one end-to-end solution, you can simplify planning, drive better performance, and create sustainable growth. Contact our team to learn how you can access a holistic and easy-to-use approach for your assortment and space strategy.


