
RegioGraph 2026
35 years of RegioGraph: The software that has grown with your requirements!
RegioGraph 2026:
Complex analyses at the touch of a button
Since 1991, RegioGraph has been helping companies make markets, potential, and structures visible and easy to understand. Today – after 35 years of continuous development – RegioGraph stands for one thing above all: greater efficiency in everyday work.
More clarity. Less complexity. Faster results. Every release focuses on what users really need: simplified workflows and seamless usability. Create insightful map-based analyses, professional territory planning, and well-founded location evaluations.
Discover the wide range of applications of RegioGraph:
For 35 years, RegioGraph has been convincing customers with sophisticated tools for spatial analysis, providing a solid foundation for well-informed business decisions in sales, marketing, expansion, and controlling. With the help of powerful analysis routines, visualizations, and intelligent filters, you can see at a glance where your key markets are located, how customers and revenues are distributed regionally, and where untapped potential lies.
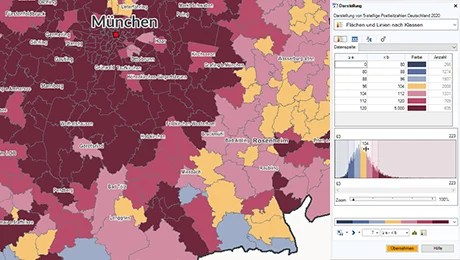
With our geomarketing software, you can clearly visualize your data on maps. Simply import information on customers, revenues, locations, or your territory structure using addresses or postal codes. Combined with integrated population, household, and NIQ purchasing power data, you can immediately identify regions where investments are particularly worthwhile. Sales territories can be compared transparently – for example by workload, revenue, and potential – providing the perfect basis for fair and efficient territory structures.
In addition, you can precisely evaluate locations by calculating catchment areas based on travel times, distances, or competitive situations. Street-level NIQ potential data shows you exactly where your target groups live or work. For the professional presentation of your results, multi-page PDF reports are available for management, sales, and marketing – clearly structured, insightful, and relevant for decision-making.
Get to know the highlights of RegioGraph 2026:
Simplified user interface
The new interface combines maximum functionality with a clear structure. Larger, logically arranged controls enable faster, more intuitive, and error-free work – without losing familiar features. In addition, workflows have been optimized, including a new location tab and shorter navigation paths.
Analysis series feature
Users now simply select the desired columns, and RegioGraph automatically performs the analysis – eliminating manual intermediate steps entirely. This results in faster, more consistent analyses that are also optimized for RegioGraph TeamConnect.
Export of territory maps for CRM and BI systems
Territory maps created in RegioGraph can be exported and integrated into in-house CRM or BI systems. This allows spatial analysis results to be directly linked with other corporate data, further processed, and used for in-depth evaluations.
New manual
The revised manual has been completely redesigned. A compact structure, clear examples, and reduced text provide better orientation, greater confidence in use, and shorter onboarding times for new team members.
More information:
To learn more, check out our guided tour, comparison of versions and list of new additions.
RegioGraph offers you:

Professional analysis tools
… support you in spatial market analyses, sales territory planning and location evaluations and provide insights for daily business operations.
Up-to-date integrated maps and data
RegioGraph contains the latest maps & NIQ Purchasing Power for a European country of your choice. So you get valid and precise results.

Add-on for online communication
Share results online as an interactive map to facilitate corporate communication via the online platform.

Software training and free support
We offer training to get you started or to expand your knowledge as well as a free customer support hotline and video tutorials.