Empty shelves in America: U.S. retailers lost over $82 billion in 2021
On-shelf availability: Tough times in Texas; minimal impact in Maine
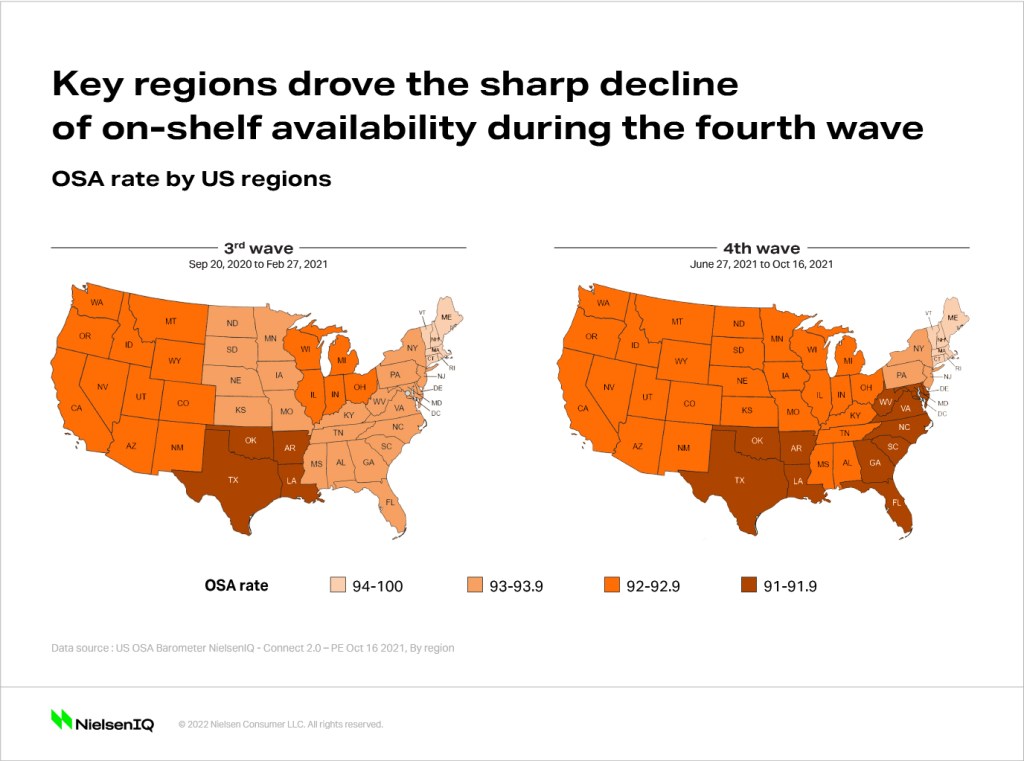
While stores across the country struggled with varying levels of on-shelf-availability, NielsenIQ data shows that there were regional hot spots where empty shelves became a common, inconvenient occurrence in 2021. Within NielsenIQ-tracked retail channels, grocery retail outlets in states such as Texas, Oklahoma, Louisiana, and Arkansas consistently saw on-shelf-availability rates decline in 2021.
Specifically looking at on-shelf-availability rates during Covid-19 wave spikes, during both the third and fourth waves, these aforementioned states saw on-shelf-availability rates drop to 91%. This means that for grocery retailers in these states, close to 10% of sales were not realized because of out-of-stock items.
NielsenIQ data also shows that by June 2021 through October 2021, most of the United States was experiencing sharply declining on-shelf-availability rates. It’s interesting to note that New England states saw fewer empty shelves last year. In comparison to any other states in the country, Maine, New Hampshire, Vermont, Massachusetts, Connecticut, and Rhode Island all saw the highest rates of available products on shelves.
Missed sales across categories
A holistic look at on-shelf availability at the category level outlines a challenging year across every aisle of the store. During the last 13 weeks of 2021, NIQ On-Shelf Availability data shows that the top 5 super-categories most severely impacted by low on-shelf availability in terms of missed sales include paper and plastic, pet foods, and salty snack items.
While individual category dynamics impact sales performance, every category on this list experienced some combination of supply shortages and demand surges during this period.
Beverage aisles remain bare in the U.S.
Focusing in on the beverage category, NielsenIQ data shows that on-shelf availability rates for the beverage category experienced a sharp decline in May 2021, and at the time of this analysis, had yet to recover from the average rate of 94.5%.
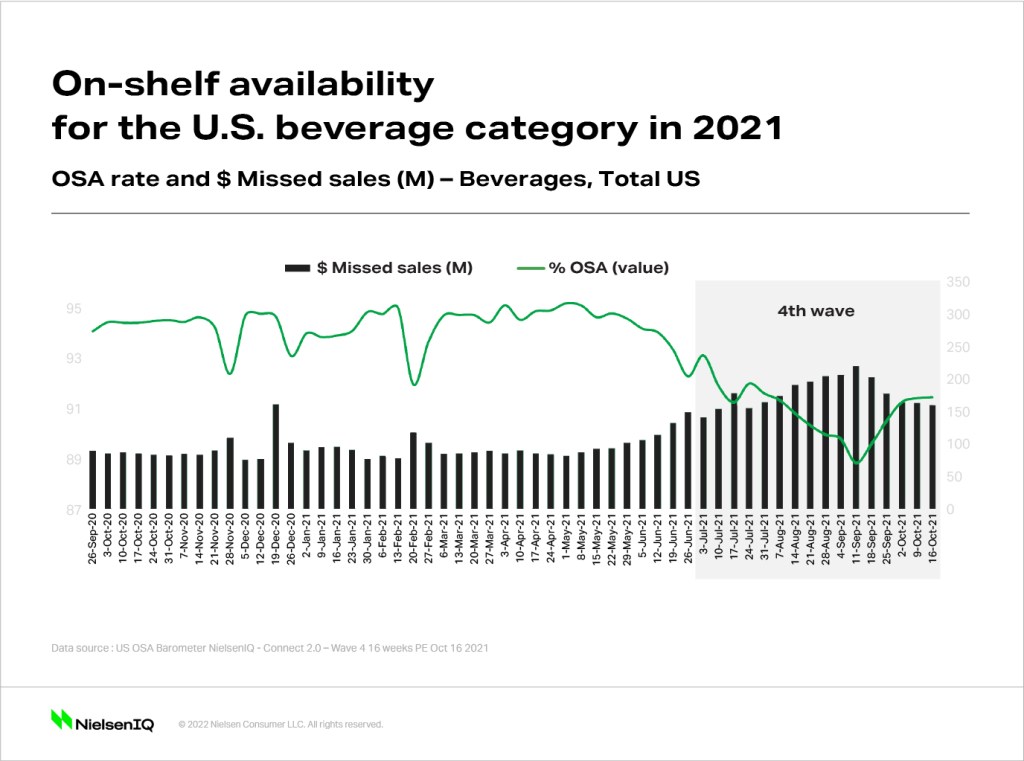
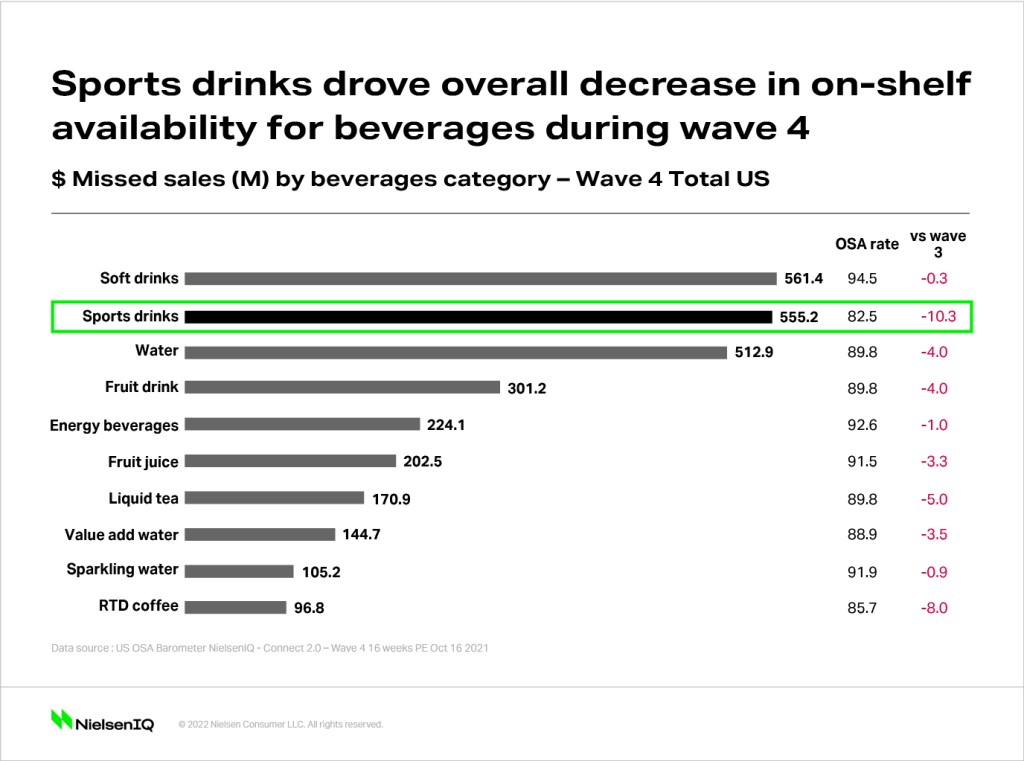
During the fourth wave of the Covid-19 virus, beginning in June 2021 through October 2021, the beverage category on-shelf availability rate stood at 91%, resulting in lost sales of $2.8 million. It is interesting to note that sports drinks drove the overall decrease in on-shelf-availability for beverages during this time period.
There are several core actions companies can take to streamline their on-shelf availability performance.
- Get the right offering and streamline your assortment to stay relevant. Identify and focus on key value items while making room for new products, new trends, and the latest innovations—don’t become so focused on current top sellers that you miss out on growth opportunities.
- Speak and share one data analytics truth for enhanced collaboration and greater ROI. Measure and benchmark what is on the shelf. Service level and in-stock rates don’t tell the whole story; leaving blind spots that cause barren shelves.
- Boost on-shelf availability off- and online and make your supply chain and operations more agile. Optimize inventory levels from warehouses to stores to react rapidly—or better, proactively— to changing consumer behaviors.
For U.S. retailers, out-of-shelf items means lost investment, lost sales opportunities at the shelf, and a potential loss in consumer faith and loyalty erosion. Keeping a close measure on-shelf availability will continue to be critically important in 2022.