1. SMB’s contribution to FMCG growth
For small and medium-sized businesses (SMBs), pace has not been the swiftest compared to larger companies, but growth driving influence, or contributions to regional sales growth, have been significant.
In fact, manufacturers outside of the top 100 have contributed 31% of their region’s annual FMCG growth in Asia Pacific , 20% in Europe region , 18% in Africa & Middle East region , and 16% in Latin America.
Small brands are making a significant impact on the larger FMCG picture; keeping track of developments on both country and a regional scale is how you can keep tabs on how the industry is performing and if there are any downward trends to watch out for.
2. The consumer’s perspective of your category
Knowing the four types of consumers as they relate to SMBs is essential. However, to measure success, gaining an understanding of where consumers seek smaller brands is just as important.
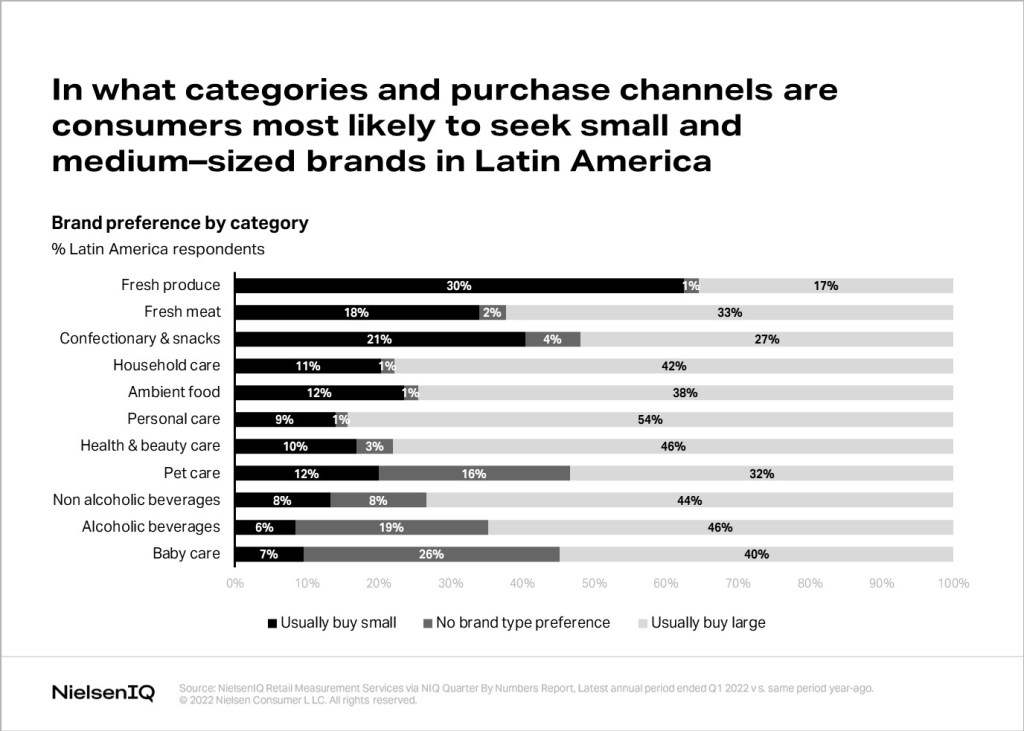
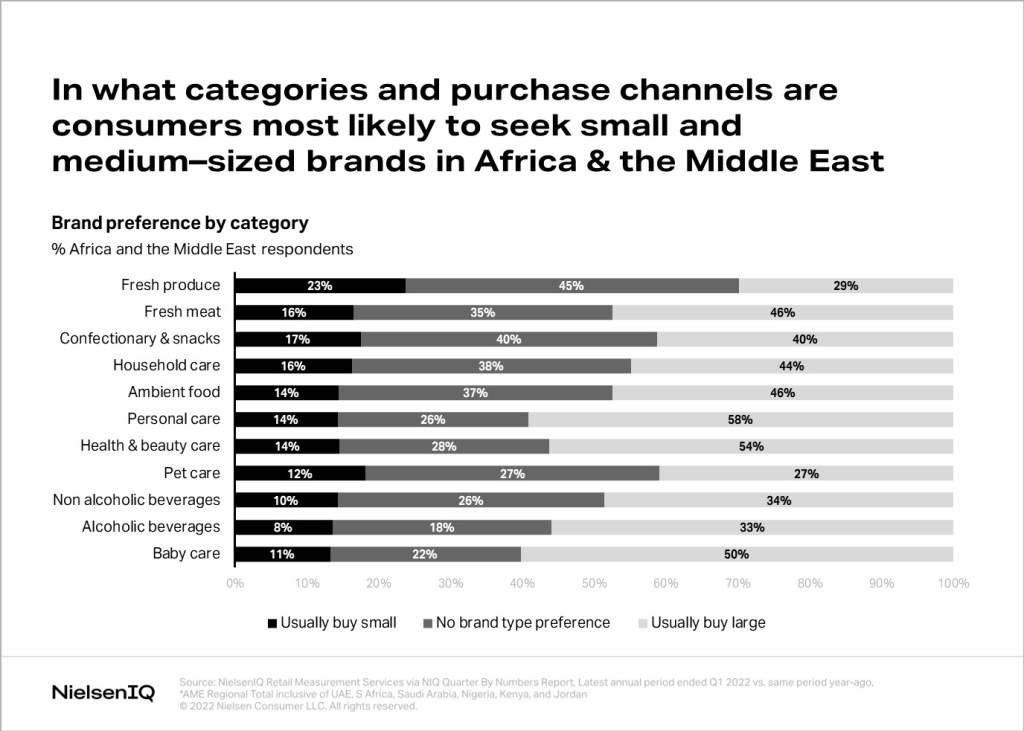
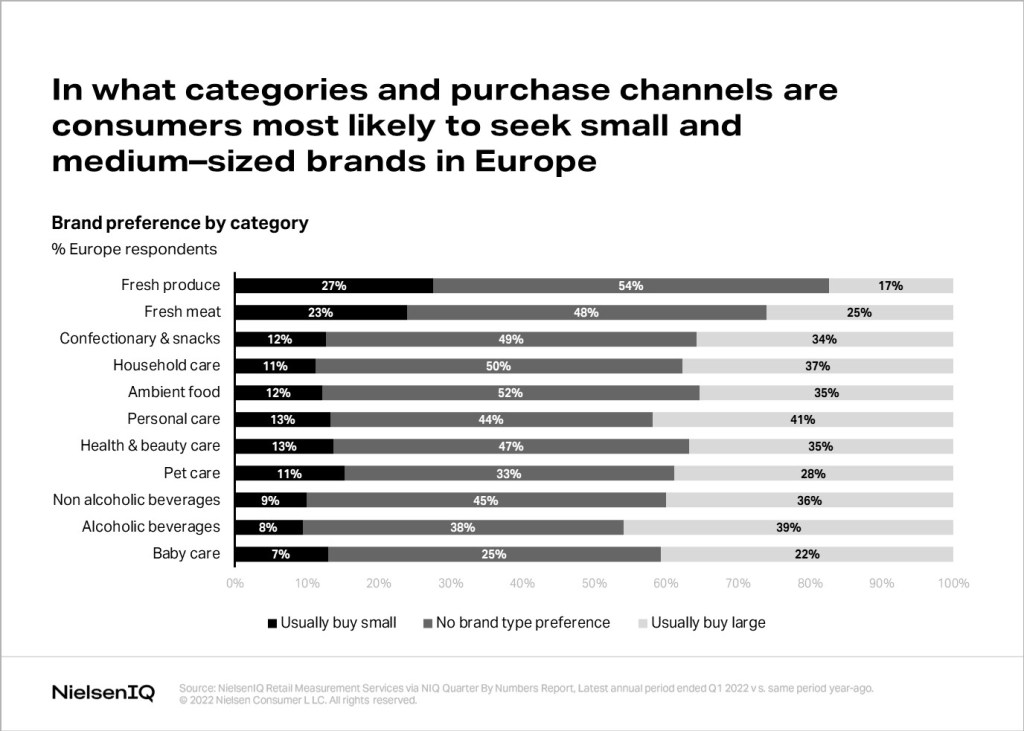
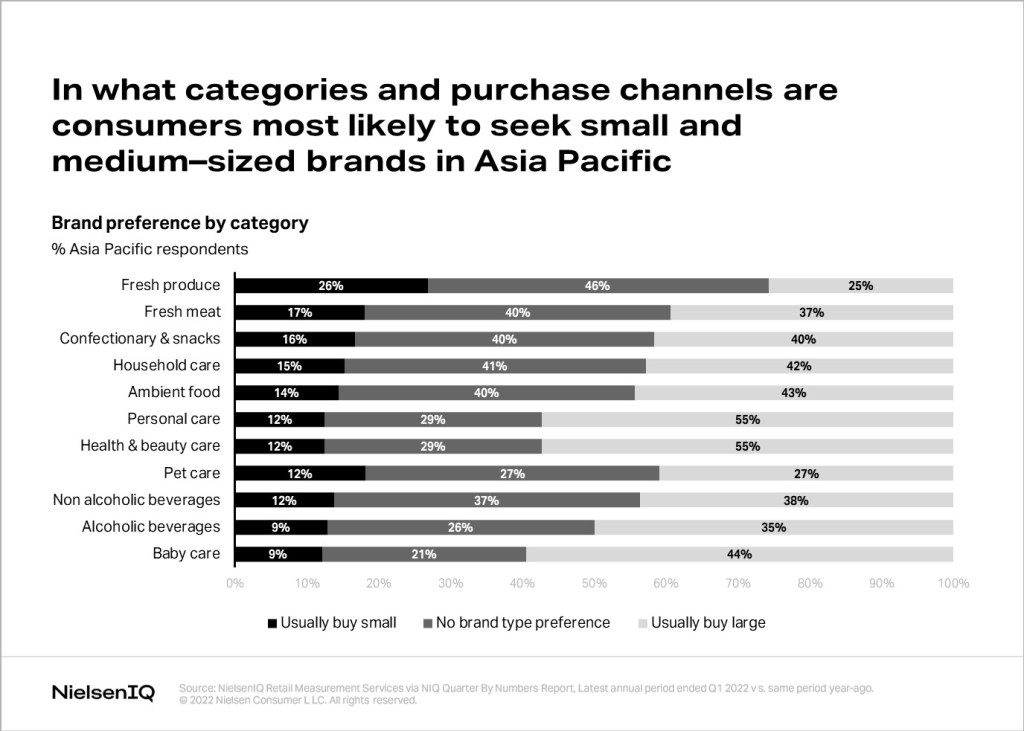
According to our global survey* the top three categories where consumers seek out SMBs were Fresh Produce, Confectionary and Snacks, Fresh Meat, and Dairy.
Notably, 44% of consumers globally indicated they have no brand preference when shopping for these types of products. This further adds to the open opportunity for smaller brands to convert and build loyalty among category buyers.
You can learn more about the consumer trends in each region by accessing the graphs below.
3. Assessing channel choice
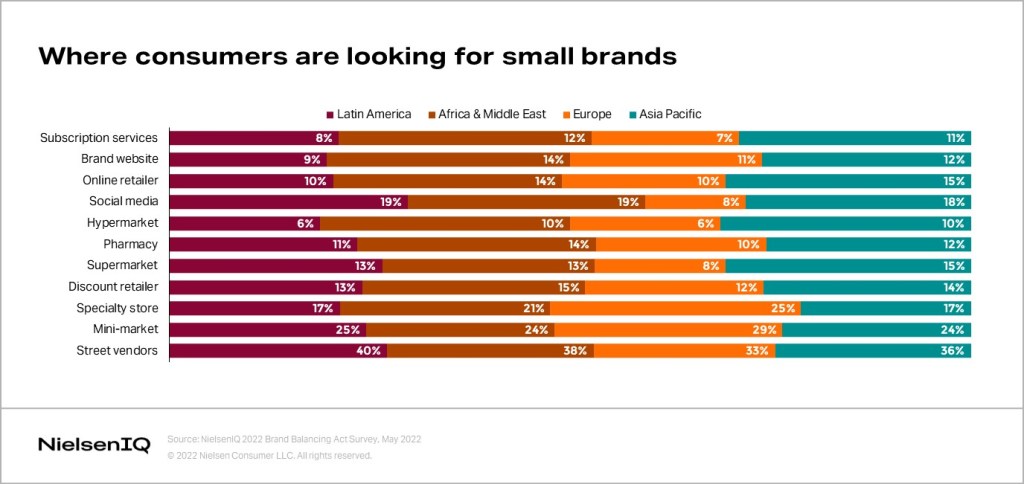
Shoppers in search of SMBs tend to lean on smaller outlets like street vendors/farmers markets (37%) and minimarkets/bodegas/independent grocery stores (25%).
Large brands have a distinct advantage online, but the playing field is nearly even among consumers buying direct from social media or community buying. In this case, 15% say they usually shop for SMBs through the social media and community buying channel, compared to 16% who usually seek the channel for large brands.
A regional breakdown of channel preference when it comes to the search for small and medium brands in the chart below.
For more on finding the right channel for your small brand, check out this article.
Putting it all together
Measuring success requires SMBs to use regional benchmarks to assess their brand performance, prove their worth to retail/brand partners, and set their achievable growth targets accordingly.
These metrics demonstrate that in the current climate, SMBs are often leading as sales growth contributors, but are not the pace leaders.
Consumers, on the other hand, have distinct categories and channels to which they’re more likely to seek smaller brands for purchase.
To thrive, SMB’s must lean into their brand advantages to extend their share of sales and increase their pace of performance in the long term.
* The NielsenIQ global study, the 2022 Brand Balancing Act, shines a light on core facets of brand choice with a particular focus on how consumers perceive and prioritize smaller brands. The results of this global data investigation have formed the backbone of a simple and essential framework to guide the strategy of small and medium-sized businesses in 2022 and beyond.


