FMCG distribution strategy: Unlocking 10% incremental market share opportunity through efficient distribution growth
Unlocking distribution growth: The clear opportunity for FMCG Manufacturer
With numerous players in the market, the Biscuits and Cakes industry is fiercely competitive. Multiple companies are vying for a larger market share and reaching as many customers as possible by expanding distribution coverage. This competition is particularly intense in Vietnam, where the population is dispersed across the country, making FMCG distribution strategy a critical aspect of success.
Manufacturer C, a major player in the Biscuits and Cakes category, has over 85% distribution across the country. However, their distribution reaches 33% in Mekong Delta, less than half of the total category presence in the market.
The opportunity for distribution growth clearly exists, but the challenge lies in unlocking it efficiently: How can they expand their distribution in Mekong Delta to cover the most important stores of the category? How can they effectively locate and target these stores on the ground?
Optimizing distribution strategy with 57% gain and 10% market share opportunity
After partnering with NIQ, the team analyzed Manufacturer C’s distribution status and potential in the region by identifying the category concentration, prioritized markets with the largest gaps, and targeted key stores. The examination uncovered a significant finding: the client was absent in 44,000 ‘Gold’ and ‘Silver’ stores, which accounted for 57% of category sales in the region. By leveraging this opportunity, the client could achieve a 10% incremental market share gain — significant growth potential. The approach used NIQ’s Advanced Analytics trusted data to inform business decisions, highlighting the efficacy of a three-step strategy for optimizing distribution expansion.
Step 1: Identifying the category concentration and efficiency gap
The first step in developing a distribution expansion strategy is to gain an understanding of the current state of the brand’s distribution effectiveness. This can be achieved through a concentration curve analysis, which provides valuable insight into the optimal way to approach distribution growth, taking into account the concentration of the category and the diminishing sales returns in the market. By plotting client performance against the concentration curve, it reveals the current gap in the quality of distribution versus the category and competition. This information can be used to pinpoint areas for improvement and guide distribution strategies.
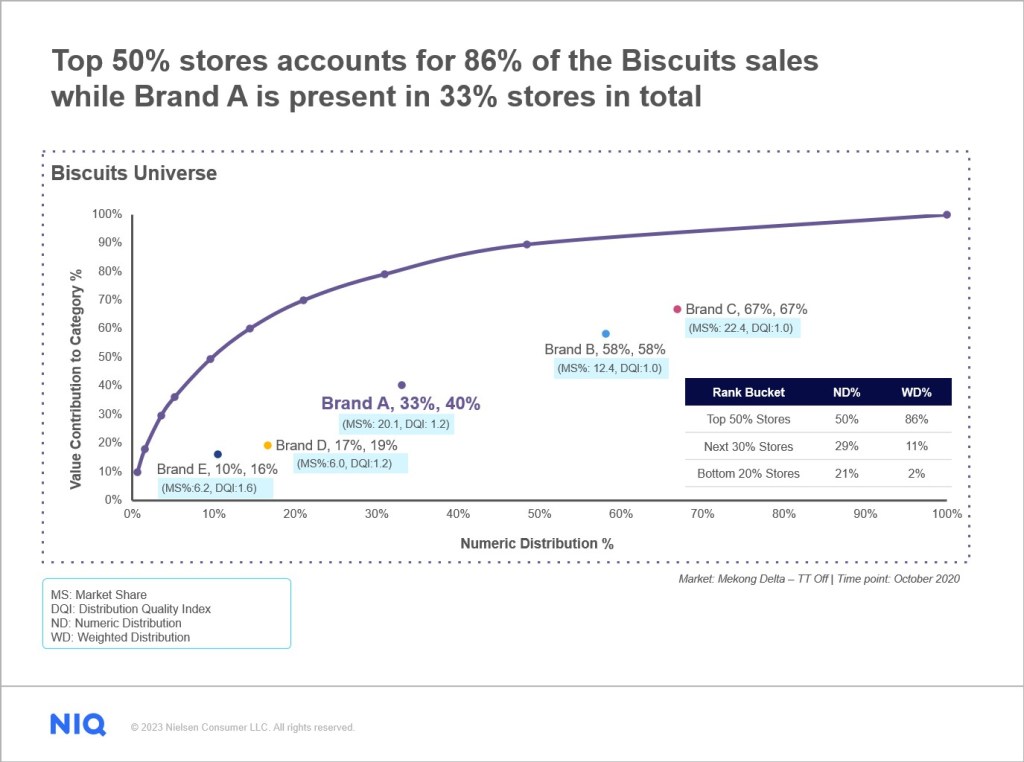
Currently, Manufacturer C’s distribution coverage accounts for 40% of category sales, yet only reaches 33% of the total market, so there is a gap between their current distribution level and the optimal level in the market. In the Mekong region alone, there are 92,000 biscuits stores — with the top 50% of stores (46,000 outlets) accounting for 86% of category sales — highlighting a high concentration within the category.
However, the manufacturer’s brand is currently only present in 20,000 of these top 46,000 outlets, representing a significant opportunity for growth. The next 30% of outlets (27,000) contribute 11% of category sales, with the client’s brand present in 10,000 of these stores. Given the mammoth task of covering these stores, this was further prioritized into Priority 1 and Priority 2 set of outlets:
- Priority 1: By entering the 27,000 outlets in the top stores, the brand can tap into stores responsible for 48% of category sales.
- Priority 2: By entering the 17,000 outlets in the next level, brand can tap into stores responsible for 9% of category sales.
")
What is Concentration Curve analysis in distribution strategy?
A concentration curve analysis is a tool used in FMCG distribution strategy to identify the gap between a client’s distribution coverage and the category’s top-performing stores. The curve plots the cumulative percentage of stores on the x-axis and the cumulative percentage of category sales that these stores cover on the y-axis. The curve represents the ideal growth path of distribution coverage from the most important stores to the least. Benchmarking the client’s and competition distribution against this ‘ideal’ state highlights the efficiency gaps in distribution and which markets and brands in the portfolio are driving this.
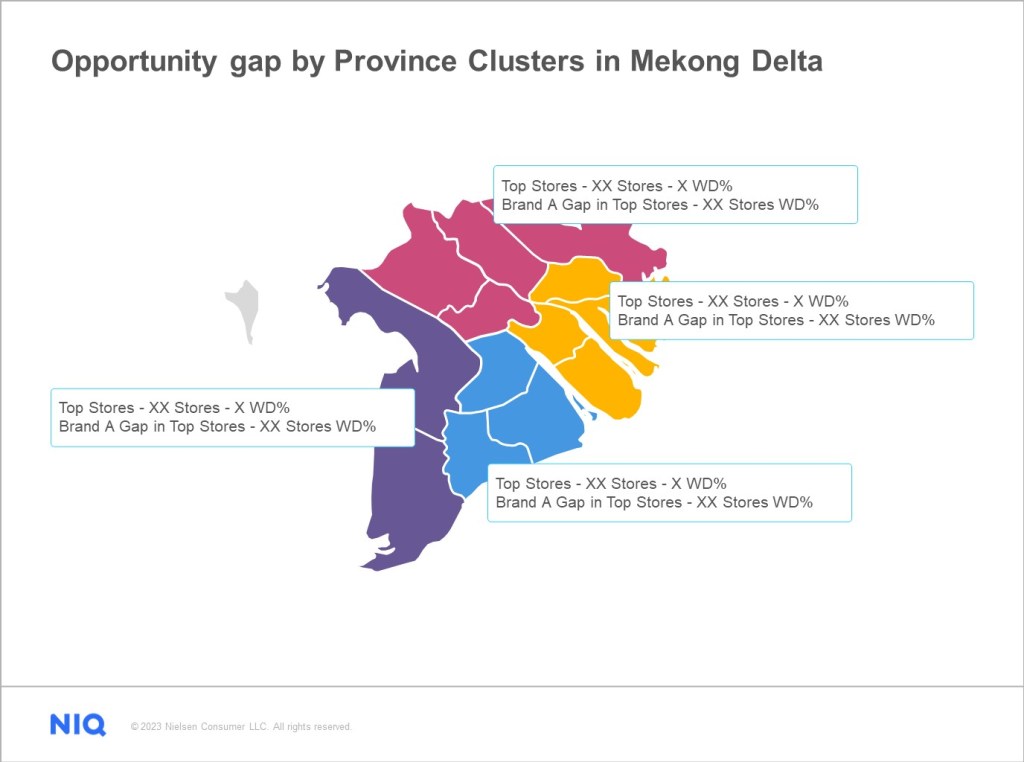
Step 2: Prioritizing markets with the highest gaps
After analyzing the concentration curve, it became clear that Manufacturer C had a significant distribution gap and needed to reach 44,000 stores. However, the Mekong Delta region (where the growth opportunity lies) is vast and encompasses 12 provinces-12 markets — presenting a challenge.
NIQ utilized store-level data to segment the Mekong region into three distinct province clusters with the greatest opportunity gap. Through this method, it was discovered that the most promising stores were heavily concentrated in a few key provinces, with several of these lucrative locations situated in urban centers like Can Tho city while the remainder were dispersed throughout rural areas. Additionally, this analysis provided sales teams with valuable insights into the top five provinces containing the most profitable opportunity stores that should be prioritized.
Adopting this approach enables FMCG brands to allocate their resources more efficiently to ensure their products are available in the right stores at the right time, leading to increased sales and market share while minimizing costs. This strategy can also help to establish stronger relationships with retailers, distributors, and consumers, resulting in long-term growth and success.
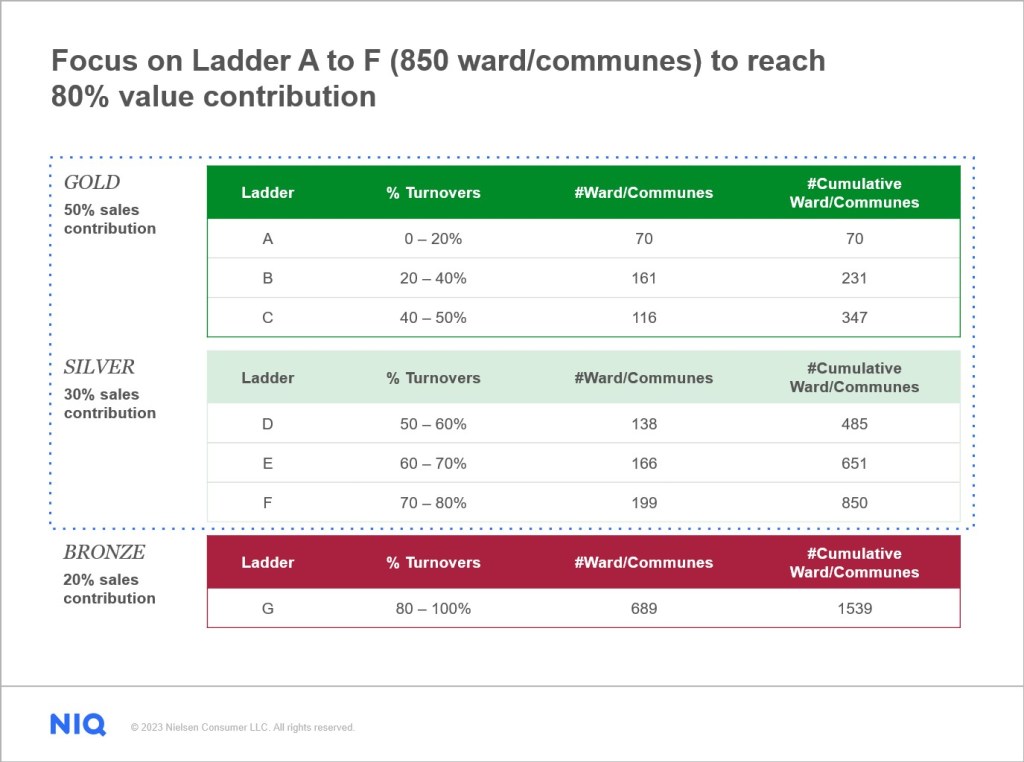
Step 3: Targeting key wards and communes with store profile parameters
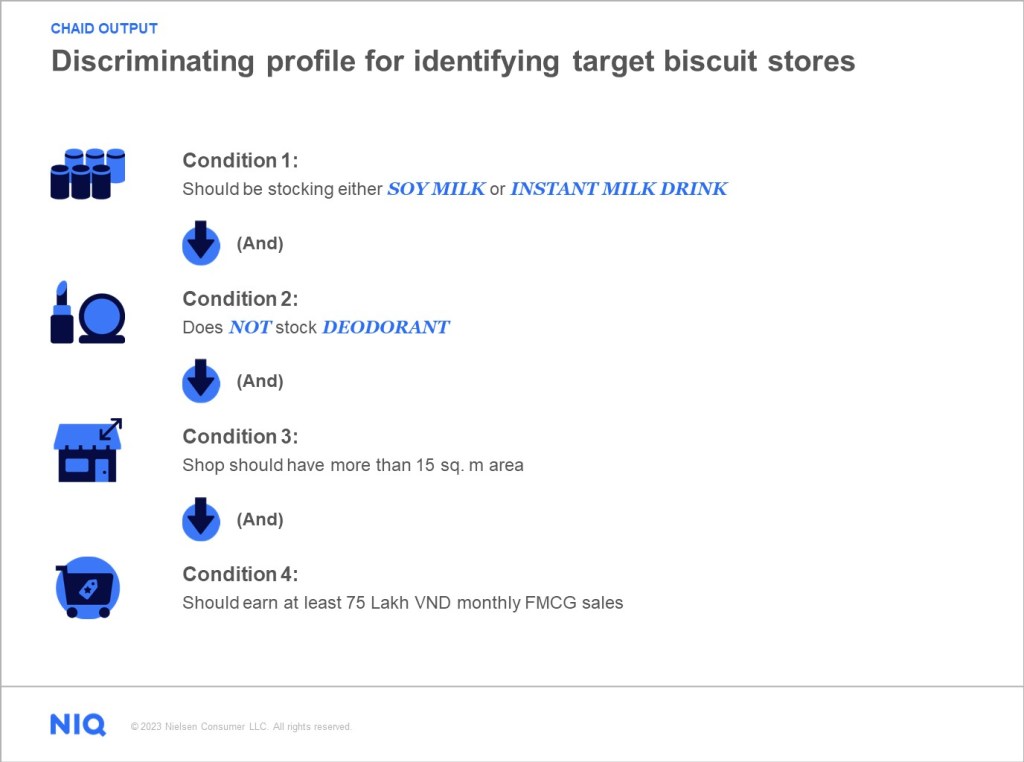
To better target the right pockets of consumers, the top 5 highest potential provinces were analyzed comprehensively to reveal important wards and communes for the category. By using demographic and geospatial data, we conducted a store profiling analysis to identify distinctive traits of top-performing stores. Based on this analysis, we discovered that the top-performing stores possess unique traits such as store size, amenities, and a specific combination of categories and brands stocked. These traits helped to identify the top outlets in the category— outlets that are typically located in high-density wards and communes, have high sales potential, turnover rates, and frequent orders.
Consequently, the sales teams can now locate and scout for these stores within the identified wards and communes to boost sales. In this case, the client can prioritize their distribution efforts with 850 wards and communes belonging to “Gold” and “Silver” rank, which contribute up to 80% of sales. Through this approach, the client was able to perfect their distribution routes, reduce wastage, and increase their market share.
What is Store Profile Analysis in FMCG distribution strategy?
NIQ through its retail audit captures a complete profile of the stores in terms of size, amenities, category stocking, range of brands and SKU stocked etc,. A store profiling analysis uses a decision tree technique called CHAID to identify discriminating profile parameters of category top stores vs the rest. This analysis helps sales team identify important stores for their categories based on just the visual cues when visit the stores as category sales information can be difficult to assess.
Best practices for identifying growth opportunities in distribution
Finding growth opportunities can be a challenging task, but using data and analytics can make it easier. Here are some best practices for identifying growth opportunities:
- Analyze the category concentration and efficiency gap to identify the gap between a company’s distribution coverage and the category’s top-performing stores.
- Prioritize markets with the highest gaps. Segmenting regions based on opportunity gaps can reveal where the most promising stores are and help guide efficient resource allocation. This can lead to increased sales and market share while minimizing costs.
- Target key micro-markets like districts, wards, and communes with store profile parameters. It is important to identify micro-markets with store profile parameters to effectively locate and target important stores on the ground. This will enable better and more direct control over the distribution coverage, resulting in long-term growth and success.

Analytics for confident decision making
Discover new growth pathways through the best-in-class solutions that deliver timely, accurate, and high-quality recommendations to your business questions.