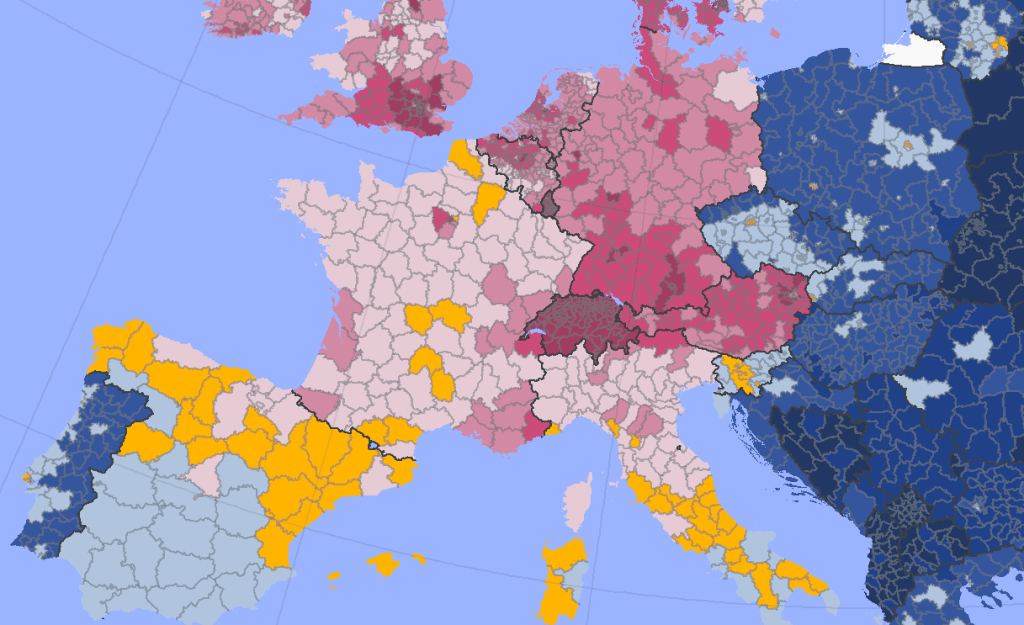
Find out how purchasing power is distributed regionally in Europe!
The average per capita purchasing power in Europe increases to 20,291 in 2025. However, the differences between the 42 countries analyzed remain significant: people in Liechtenstein, Switzerland, and Luxembourg have a much higher net income than the rest of Europe, while purchasing power is lowest in Kosovo, Belarus, and Ukraine. Ireland is among the big winners this year, climbing five places in the overall European comparison. These findings are part of the new study “NIQ Purchasing Power Europe 2025,” which is now available.
In 2025, Europeans will have a total purchasing power of approximately 13.9 trillion euros. This budget is available for food, housing, services, energy costs, private pensions, insurance, vacations, mobility, and consumer purchases. On a per capita basis, this results in an average purchasing power of 20,291 euros, representing a nominal increase of 4.0 percent compared to the revised figure from the previous year. However, the actual amount consumers have available for spending and saving varies greatly from country to country and also depends on how consumer prices develop in 2025.
Take a look at our purchasing power compendium to explore the regional distribution of purchasing power across Europe — both between individual countries and among different regions within a country.
Contact me if you have any questions:

Carsten Buchart
P +49 911 395 2625
carsten.buchart@nielseniq.com