Why many consumers are trading 3 square meals for snacks
Eating patterns have changed
Here is some of the data that we collected on people’s eating patterns:
- Over 50% of consumers have changed their eating habits in the past two years.
- Over 40% claim that they want to be healthier, and many are looking for a balance between health and indulgence.
- Over 80% say that they’re still eating at home more than outside of the house in the past six months. This is driven by a desire for convenience and flexibility, mainly due to working from home.
- Over 66% of people say that they’re doing other activities while eating and snacking, including watching TV, listening to podcasts, or working.
The study shows 4 clear trends in people’s eating patterns:
- People associate having smaller portions with healthy habits. Thirty-nine percent of consumers say that the small meals they’re eating are healthy for them.
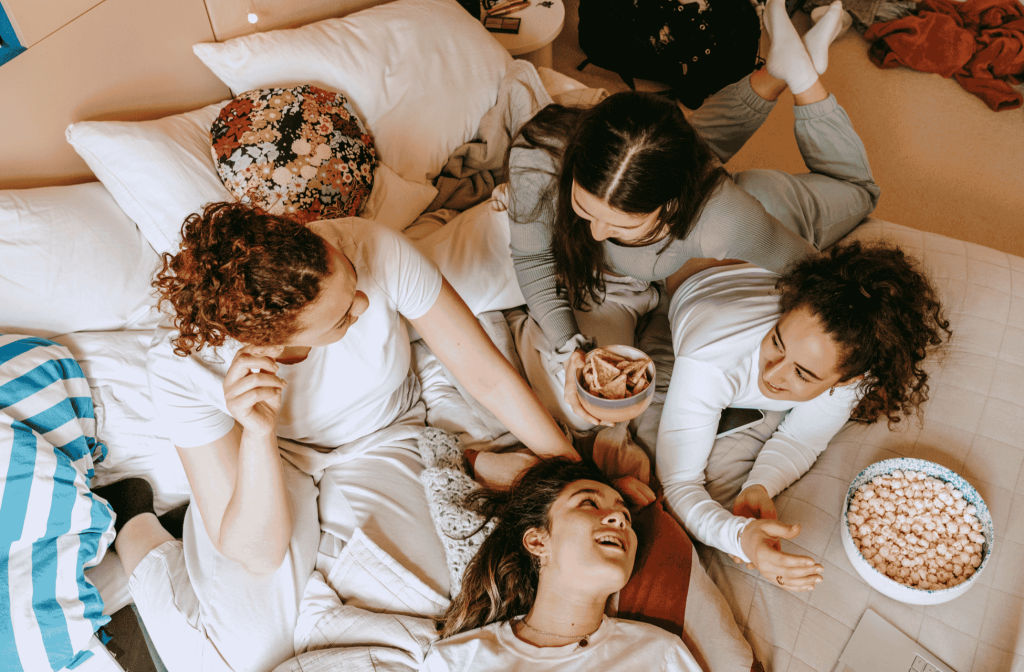
- Full meals are mostly shared and seen as excellent times for bonding with friends or family.
- Thirty percent of shared occasions were really for snacking. This included food such as chips, pretzels and popcorn that comes in big bags and is easy to share.
- While consumers say they want to be healthy, they still indulge in sweets. Twenty-four percent say they eat sweets to satisfy their cravings.
How Consumption Moments gathers data
Let’s take a step back and see how data for specific consumer consumption moments is collected.
Consumers use NielsenIQ’s mobile app to track their eating habits throughout the day. They scan a product’s barcode and answer a few simple questions. With this approach, NielsenIQ captures the six “Ws” of consumption: who, what, when, whom, where, and why.
Who: The app collects quantitative product data through bar code scanning and survey questions and qualitative data through consumers’ diary entries. For example, a customer might make a video diary entry saying they packed and ate pretzels to eat during their son’s baseball game.
The app also captures consumer demographics and background. NielsenIQ conducted a study with 300 consumers who logged in 3,400 consumption moments, consuming 4,200 different products.
What: The “what” includes what products are being consumed. Customers use their phones and scan a barcode when they log in and add the exact product they are consuming. So we can see that smaller meals and snacks are on-trend, accounting for almost three-quarters of all eating occasions.
When: This is the time of consumption and includes the time of the day, day in the week, etc. The data is collected at the time of consumption, so we can see that people are snacking between late morning to about late afternoon.
The majority of snacking occasions are serving as midday pick-me-ups—midnight snacks are less common. The data shows that people are generally at home and eating alone during the week.
Whom: This data point shows us who consumers are sharing their meals with. As we’d expect, full meals are eaten more often with others, and smaller meals are more often consumed when someone is alone.
Customers felt better while consuming with others, and experience higher moods and better energy levels. For the sweets, we saw that a lot of the consumption is done alone except for ice cream and popsicles. Further, many healthy snacks such as fruits and vegetables are consumed alone.
Where: This measure shows the geographical location of the consumer when they eat meal and is collected through geo-location stamps. Eighty-two percent of snacking occasions are consumed in the home, with consumers’ offices being the second most popular place.
Why: This data point tracks the motivations behind consumption, including consumers’ moods and energy levels while consuming meals.
Consumers believe that smaller meals and snacks are healthier for them. These meals are being consumed to get energy throughout the day. Sweets are usually eaten when people are in a low mood and have low energy.
Consumption Moments in action
However, we saw that ice cream and popsicles were consumed with smiles. Consumers had high energy and high moods when they eating products from this category. Here’s an example of the six Ws collected via Consumption Moments and how they can inform a marketing strategy for popular frozen snacks:
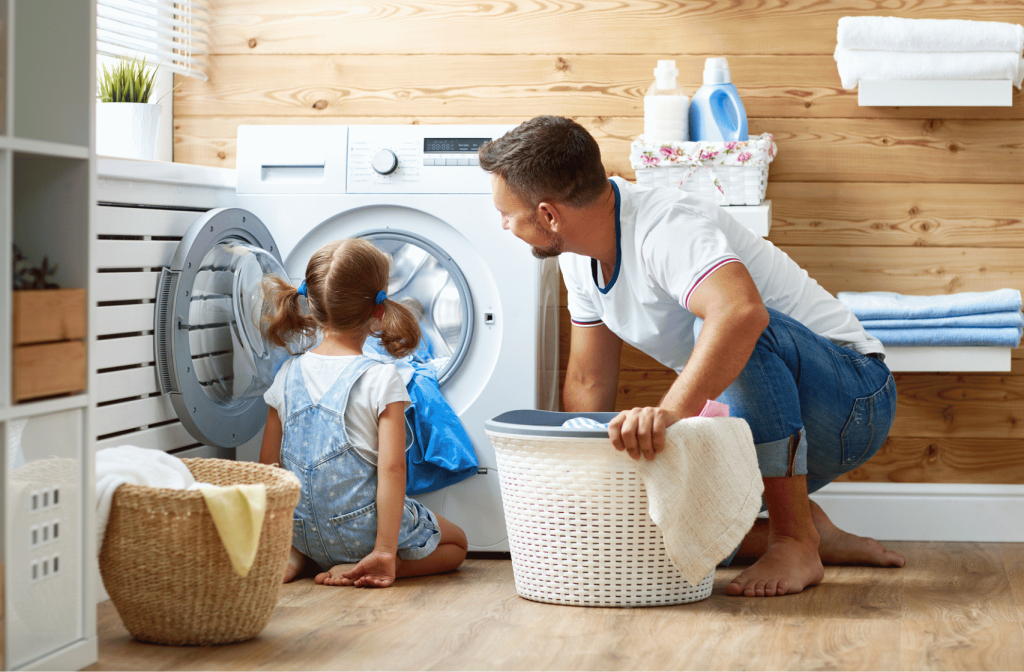
- Who: Busy families with kids.
- What: Frozen sweets such as ice-creams and popsicles.
- When: Over 80% of people consume these products on the weekends, primarily on Sunday. This means that you can target busy families with young children on the weekends.
- Whom: Consumed with others, such as partners and family, more often than any other snacking category.
- Where: People are mostly eating these food items at home. However, they like to pick up the items themselves at grocery stores.
- Why: Twenty-one percent of people said they picked these products because they wanted to have a rewarding moment. You can use motivation to drive social media campaigns where snacks’ social and rewarding moments are visualized.
With the insights revealed by the six Ws and Consumption Moments, CPG brands and retailers can see the true motivations behind customer consumption behavior and usage to guide product innovations and marketing strategies.
Getting started with Consumption Moments
Ready to learn more about how this actionable data can help guide your marketing efforts?