
Map of the Month: NIQ Purchasing Power, Germany, Austria, Switzerland 2026
Our Geomarketing Map of the Month for April shows the regional distribution of purchasing power in Germany, Austria, and Switzerland in 2026.
With an average per capita purchasing power of 54,730 euros, Swiss once again have significantly more financial resources available for consumption and savings in 2026 than the population in the neighboring German-speaking countries. In Austria, per capita purchasing power amounts to 31,454 euros, while Germans have an average of 31,193 euros at their disposal. However, pronounced differences are evident not only between countries but also within each nation, where spending potential in some cases varies considerably from region to region.
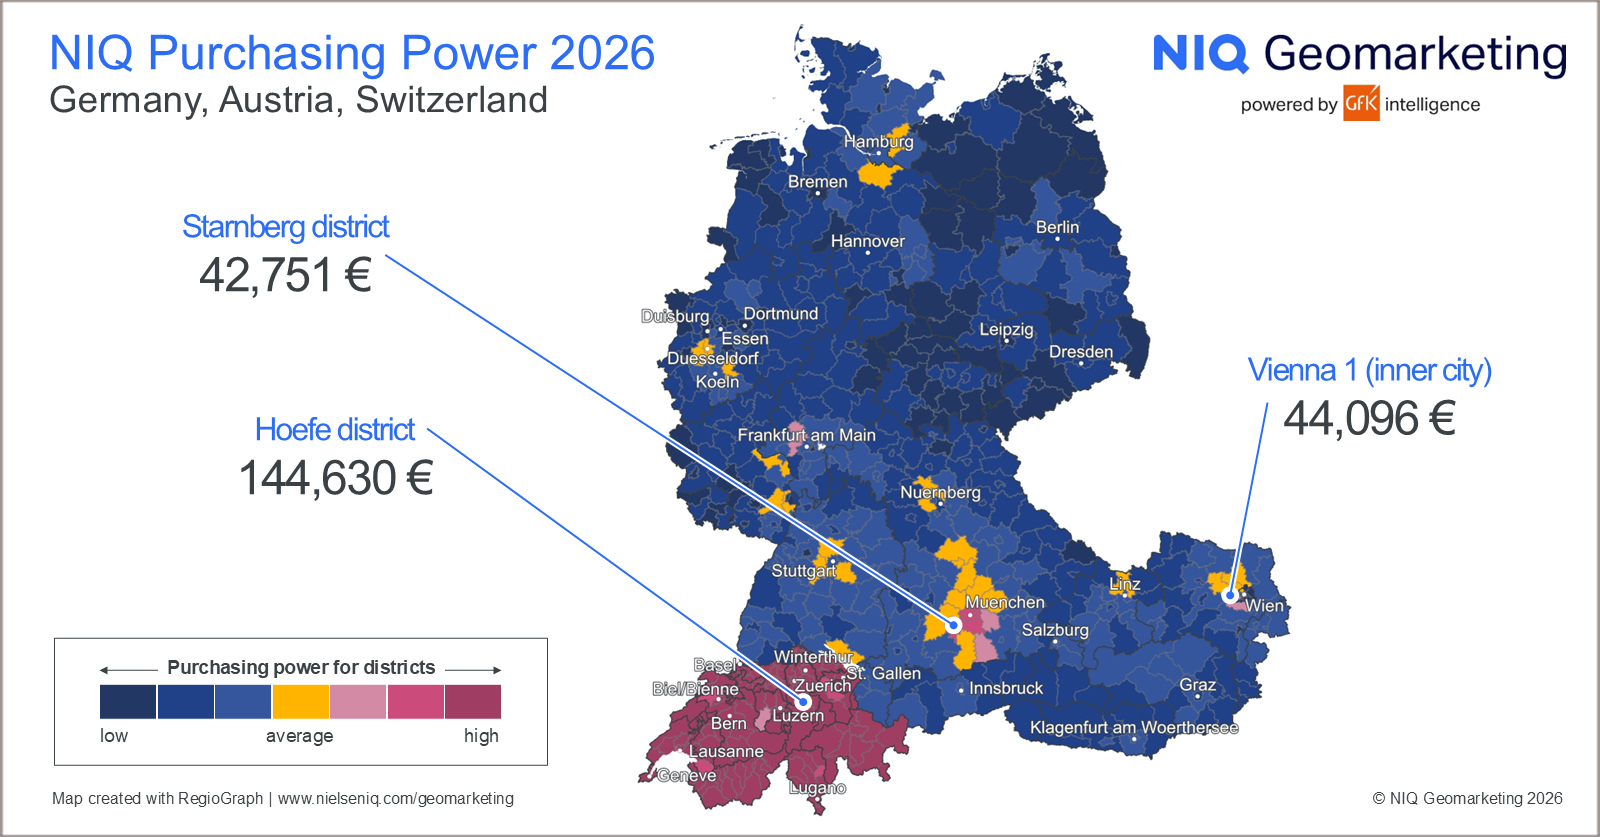
In Switzerland, the district of Hoefe leads the ranking by a wide margin, with residents having an average of 144,630 euros per capita at their disposal. This is nearly 3.6 times the purchasing power of the weakest district, Entlebuch, where the figure stands at 39,980 euros. In Austria, Vienna’s 1st district (inner city) tops the ranking with a per capita purchasing power of 44,096 euros, while Vienna’s 20th district (Brigittenau) occupies the bottom position with 24,720 euros. In Germany, the district of Starnberg ranks first with a spending potential of 42,751 euros, while Gelsenkirchen comes in last with 24,538 euros per capita.
Download the map in high-resolution JPG format…
The map may be freely distributed and reproduced if the following attribution is included: “Illustration: NIQ Geomarketing”.
Further insights into NIQ Geomarketing’s market data offering can be found here.