
Data integration + data enrichment = faster insights
In this overly data-rich world, there’s always going to be a need for you to combine different data sets to get a more holistic picture, expand your view via multiple data sources, and identify hidden trends.
Perhaps you want to look at a particular product categorized by this latest week’s promotional price tier, or you’d like to analyze the correlation of buying trends with economic forecasts. Whatever the case may be, data integration and enrichment are critical to create actionable insights from less valuable, siloed, raw data.
Simply put, data integration is the process of combining data from different sources into a single, unified view. For example, customer data integration involves the extraction of information about individual customers from disparate business systems (e.g., sales, accounts, and marketing), and combining it into a single view of the customer to be used for customer service, reporting, and analysis.
Data enrichment refers to enhancing, refining, or improving raw data to add value and augment the quality of your organization’s data. The combination of data integration and data enrichment enables sophisticated analytics to produce effective, actionable, business intelligence—intelligence that was previously locked away in different systems.
This is how data typically flows through a system:
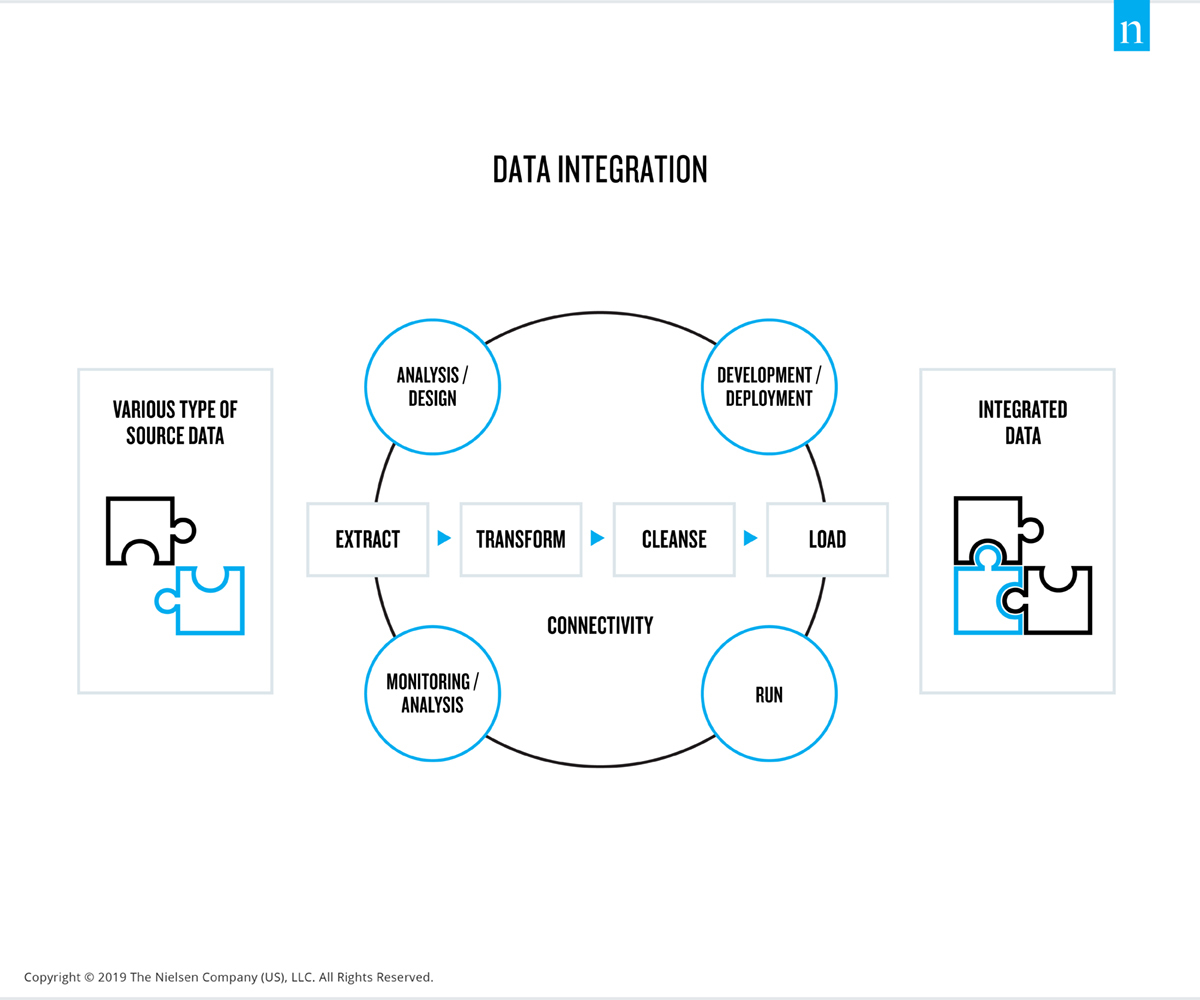
Traditional approach to integration and enrichment
Let’s look at how integration and enrichment typically happens. To start, you’re trying to process hundreds of data sets—your data, our data, data from third parties, just to name a few. All of these sources of data are imperative because they’re part of the same analysis or are complementary to an analysis you need in order to make decisions for your business.
The problem is, this process is daunting and time-consuming. To do this, you have to log into a tool like NielsenIQ’s, export the data, move through other tools and export data, and are ultimately left with a ton of single files. Now comes the challenge: finding a way to link them—all of them. Traditionally, that means a lot of manual copying and pasting. Once you’ve done that, you end up with a massive spreadsheet that you have to wade through, perhaps with a Microsoft Excel chart or pivot table. But the job isn’t done! That’s because in a week, the data will refresh and you will need to repeat this mundane process all over again, wasting precious hours of your team’s time.
There are several problems with this process. First, it costs you and your team a tremendous amount of time. Secondly, the process is extremely error-prone, introducing significant risk of error to any output. Finally, the great analysis that you may produce is locked up in an Excel file, stored on someone’s desktop, or shared via email. As a result, the analysis may not even get done. So what eventually happens? You end up collecting and storing unmanaged data that goes unused—the pitfall of not tackling data integration. Ultimately, this puts your business at a disadvantage to the competitors that are deriving insights from richer, connected data sets.
The advantages of an automated integration and enrichment solution
Now let’s look at how using an automated integration and enrichment solution in the same scenario will flip this daunting process on its head. First, you can start with NielsenIQ’s leading Retail Measurement Services (RMS) or Consumer Panel data that has already been cleansed and harmonized through our cloud-based Connect Platform.
Need to add more data? Not a problem. We provide automated tools so you can seamlessly upload and join your own data with ours. Once the additional data is integrated, it is available in our full suite of visualization and analytics tools via the Connect Platform. It’s effortlessly a part of the system. So instead of wasting your time in spreadsheets, you can slice, dice, and drill into the data and answer questions right in our tool, spending most of your time on analysis. The best part? Once you go through the initial setup, the process will be automatically refreshed for you each period as new data arrives! Can you imagine?
At NielsenIQ, we’re passionate about seamless data integration and enrichment because of the value it brings our customers (and the countless hours it saves them). Our SaaS-based application allows analysts to modify or integrate NielsenIQ data with their own attributes and metrics. For example, a business unit that wants to create an attribute categorizing every UPC by the current week’s price, making that new attribute available to all users within the business. Or, a team that wants to integrate shipment data with consumption data, leveraging machine learning to automatically match similar, but not exact product descriptions. A team that wants to not only track against last year’s performance but versus forecast, can build a unique metric that shows if they are on track or off. All of these use cases and more are enabled via our application. Any data source will be enriched by reference data enabling disparate data sources to be aligned (i.e., RMS, CPS, loyalty, etc.).
To see the impact on time and resource savings, our team at NielsenIQ recently measured the number of handoffs, processing time, and the overall elapsed time from the manual way and then compared the measurements with the process using NielsenIQ Connect. From there, we calculated the savings. Through our app, we saw improved delivery of custom attributes by over 60%. Priceless.
What truly makes our view on data integration and enrichment different is:
- Our robust reference data (i.e., all characteristics we code from products, stores, etc.). This is the “glue” that enables disparate data sources to be integrated by finding commonalities based on thousands of characteristics coded in our data.
- Our machine learning capabilities. It works for you, delivering automation to the end user, taking the manual labor from yesterday’s processing out of the question.
- Once the data is published, the new content is available immediately. Yes, immediately.
Ultimately, data integration and enrichment pave the way to better, faster insights. They improve collaboration and unification of systems, save time and enhance efficiency, reduce errors and rework, and deliver more valuable insights that can be used to help drive meaningful decisions.
It is your data, but smarter!