March. The start of spring. And the annual NCAA men’s college basketball tournament—March Madness™. While many teams suffer the agony of defeat, others rejoice gleefully as their alma maters or home-town favorites advance throughout the tourney in hopes of cutting down those nets.
But college basketball teams aren’t the only ones to experience joy or sorrow. In-store purchasing patterns have shifted significantly over the past five years with consumers growing more mindful about health and wellness, in search of convenience, and aware of online shopping options. These shifts have resulted in some areas of the store facing sales challenges, while others have put forth winning formulas.
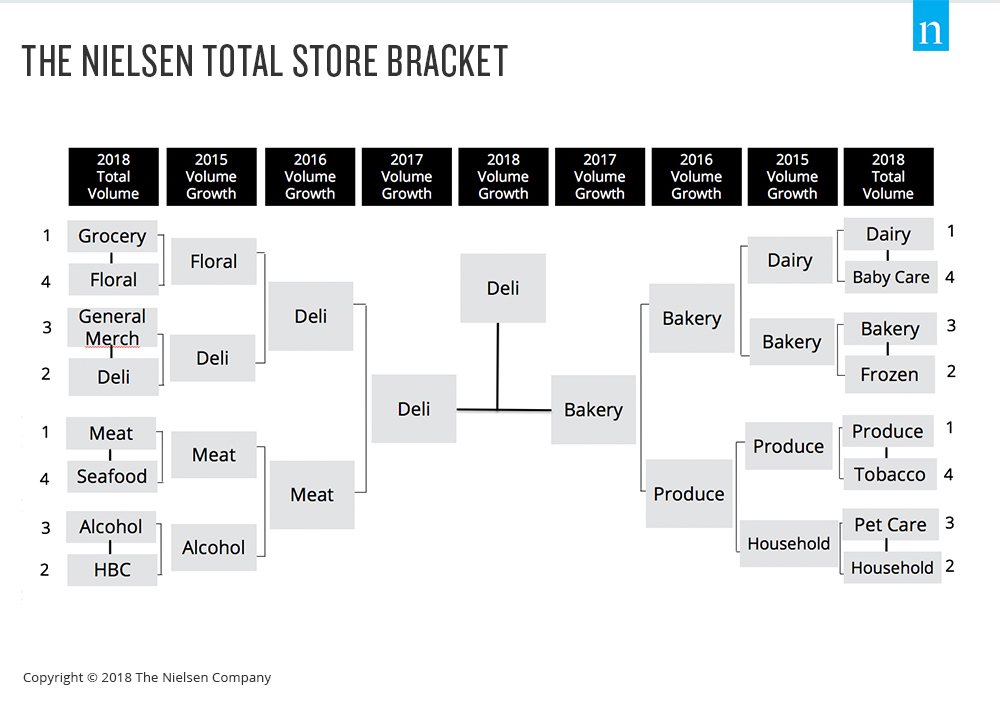
Using our uniquely integrated sales universe, we created our annual bracket that pits different areas of the store against one another to understand what area of the store is winning. This year, we ranked each of our 16 standard departments based on their 2018 volume sales. Departments advanced based on year-over-year volume growth.
So how does NielsenIQ’s Total Store Final Four look? It’s a clean sweep for the fresh departments, with fresh deli, fresh meat, fresh bakery, and fresh produce cutting down the figurative nets.

Let’s dissect the results a bit further, starting with our champion.
With $36.6 billion in sales, the deli department has been a consistent source of store growth for years. Through its prepared foods section, deli has managed to satisfy the increased demand for convenient meal options. Once heralded as a go-to for fried chicken or pizza, this department has avoided stagnancy with substantial growth in recent years from product groups that hit on our continually changing needs.
Healthier options like sushi and innovative salads, as well as products that make snacking or entertaining easier, such as freshly made dips, continue to drive sales. Meal kits have also played a role in the department’s evolution, competing with subscription services. The investment has paid off, as in-store meal kit buyers accounted for 60% of meal kit growth in 2018.
Meanwhile, the in-store bakery department gave a valiant effort, finishing a somewhat surprising runner-up. Despite the growing demand for health and wellness offerings, people still like to indulge. This $13.2 billion department has capitalized on the continued demand for smaller products that meet the needs of today’s smaller households. Mini pies in particular have been the catalyst for surging sales within this department.
What about some of the departments that failed to progress past the initial round, such as pet care and health and beauty? Are people suddenly spending less on their pets or shunning their beauty routine? Quite the contrary; instead, they’ve switched where they’re buying these products. In the past two years, overall share of sales of pet care and health and beauty products has shifted five and ten points, respectively, from brick-and-mortar stores to online.
So what can we learn from the Total Store Final Four bracket? While e-commerce growth and consumer aversions to ingredient-laden products have greatly affected certain areas of the store, perimeter departments continue to attract shoppers into the store and drive purchase growth. Laggards, beware: if you’re not monitoring the integrated sales of these departments to understand competitive threats or partnership opportunities, then somebody else may be cutting down your nets next year.


