Fresh Insights About Grocery On-Shelf Availability in the Post-COVID Era
North American grocery shoppers are still confronting frustrating out-of-shelf situations in high-profile product categories 22 months after the onset of the COVID-19 pandemic.
While the initial severe challenges with paper goods and disinfecting products have eased substantially, there are still some inconsistencies and shelf voids are visible in categories such as dried pasta, canned beans, and other pantry staples. A shortage of cream cheese late last year was widely covered in the media, with consumer experts advising shoppers to consider alternatives to homemade holiday cheesecakes.
Lost volume, lost baskets, and lost faith have resulted. The enduring nature of these challenges are an indication that food retailers and suppliers need to work together more effectively to keep shelves properly stocked – in stores and on-line.
Losses due to out-of-shelf are three-layered:
- Lost sales opportunity at the shelf
- Lost baskets with associated customer frustration and loyalty erosion
- Lost investment from business planning to supply chain execution
Even where upstream supply shortages and/or panic shopping are root causes, there are steps that can be taken to ensure better on-shelf availability (OSA). It begins with a true read of trending demand – not just in your own stores, but also at the market level. Service levels can be strengthened by taking accurate OSA measurements and using the data to inform the upstream supply chain. By sharing this data, retailers and suppliers can collaborate to anticipate and respond effectively to shopper needs.
What’s happening now
A recent survey of 1,000 grocery shoppers cited in Winsight Grocery Business found that 65% believed that grocery inventory availability is worse than it was before the pandemic. In addition, almost half of respondents in households with children said their primary grocery store is out of one or more items on their list at least half of the time.i
Out-of-stocks are made even worse by poor item substitutions in digital shopping, respondents said. As many as 1 in 5 households with children have changed their primary grocery store out of frustration.ii
Brand marketers and retailers have taken steps to streamline assortments in some categories as a tactical response to supply challenges. In some categories, manufacturers stepped up production of core SKUs in an effort to keep up with surges in pantry-loading while suspending production of alternative flavors or package forms. While these responses may have ensured basic availability in those categories, it left voids in many store planograms.
Seasonal impact
Retailers and manufacturers have long known that when it comes to being able to find items on shelf, the Thanksgiving period is traditionally the most challenging time of the year across the entire store.
In the weeks leading up to Thanksgiving 2021 in the U.S., lost sales attributable to out-of-shelf issues (sometimes loosely-named “stockouts”) were 1.3 times higher than on an average week.
This was not only due to the typical Thanksgiving food items that ran short at the stores: NielsenIQ for example measured that in November 2021 the On-Shelf Availability rates for toilet paper dropped by 1.84% – more than some food categories that typically run short during the Thanksgiving holiday week.
Out-of-shelf instances remained a major cause of lost sales as we entered the past holiday season. The total OSA rate for the month of November 2021 (93.2%) was lower than the full year 2021 rate (94.3%).iii That’s the equivalent of one item in fifteen unavailable for purchase – to the detriment of virtually every shopping basket.
Hard-hit categories
Across the U.S. grocery industry, a diverse range of products recorded missed sales opportunities in the final 13 weeks of 2021, according to NielsenIQ On-Shelf Availability data. The 10 super-categories most severely impacted by low OSA in terms of missed sales during that period were:
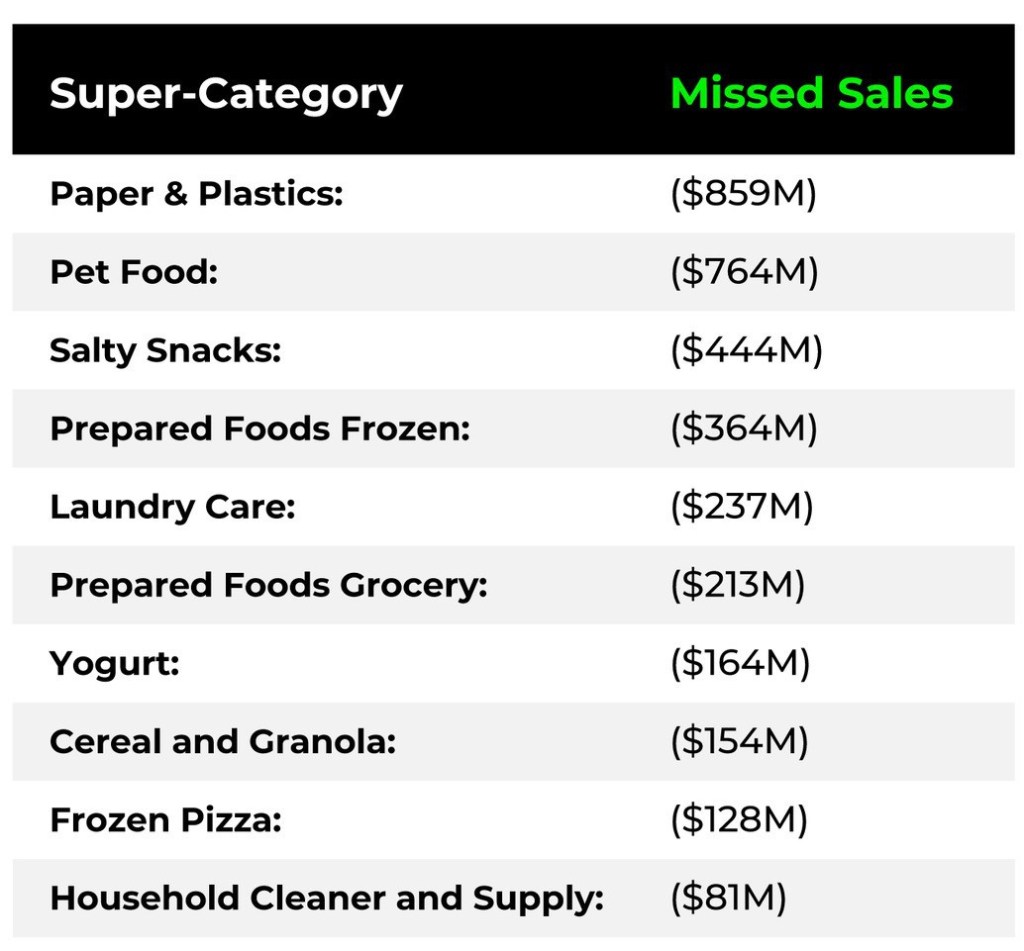
While the root causes are specific to each category, most experienced some combination of supply shortages and demand surges during this period.
Focus on OSA in RTE cereals
Drilling into another notable example, low OSA has had a profound impact in the ready-to-eat cereals and granola category across the U.S., with severe out-of-stocks of some items. NielsenIQ measured a decline in OSA in 2021 – from a 97.4% OSA rate in April down to 93.8% in July. Those out-of-shelf situations amounted to $60M lost in July 2021 alone, almost double the dollar sales lost in an average month of $37M.
Over the four months from June to September 2021, the data reveals that U.S. retailers and RTE cereals manufacturers missed a total of $201M in cereal sales because customers could not find their preferred varieties in stores.
OSA rates in RTE cereals started to improve again in September 2021, but many SKUs were still lagging behind their 2020 and early 2021 levels of availability as the year drew to a close.

Are you taking steps to ensure better On-Shelf Availability (OSA)?
NielsenIQ OSA brings added value to existing in-stock rate measurements by going beyond standard out-of-stocks identification and by measuring the market and delivering benchmarks.
About NielsenIQ OSA
OSA is a measure of item availability on the shelf. Derived from proprietary models that run on daily POS data, the NielsenIQ OSA solution determines if any given item is “out-of-shelf” in a given store during a given day. It further quantifies the amount of missed sales and identifies root causes so merchants can take appropriate corrective actions.
NielsenIQ OSA brings added value to existing in-stock rate measurements in two important ways: By going beyond standard out-of-stocks identification (what’s actually on the shelf – not only in the store inventory), and by measuring the market and delivering benchmarks.
OSA is useful as a positive metric of shoppers’ ability to actually purchase an item or category. That is, a 95.8% OSA rate for RTE cereals means that, on average, shoppers find the items in this category in stores (at the shelf) 95.8% of the time. Conversely, the category was “out-of-shelf” (or not available for purchase) 4.2% of the time.
Achieve OSA mastery
Retailers and brands have strong shared incentives to gain greater control over OSA and formulate more effective responses to changes in supply and demand. With the benefit of an OSA solution, companies can pursue several actions and capabilities to gain mastery of this area of performance:
- Measure: Acquire an ability to measure item availability at the shelf on a daily basis
- Model: Apply highly accurate modelling on daily POS data to understand and maintain a current accurate picture and benchmark your performance against the market/competition
- Reaggregate: Organize captured insights at various levels to support category decision making and supply chain strategy
- Predict: Forecast sales and predict out-of-shelf and identify root causes all along the supply chain, every day, at store level
- Assert: Present hard facts to ensure fair share of replenishment from suppliers
- Collaborate: Speak and share one data analytics truth for enhanced collaboration and greater ROI
NielsenIQ’s OSA solution provides a mechanism to identify and respond to fast-changing shopper demand and supply fluctuations. The scope of underlying available data is unmatched in our industry. Retailers can apply OSA insights to maintain the right streamlined assortments to stay relevant.
The OSA tools sharpen focus on your Key Value Items (KVIs) to ensure both consistent availability and everyday price competitiveness. The solution supports decisions about when to create shelf space for new products, new trends, and latest innovations.
On the supply side of the equation, OSA data and modelling contributes to improved supply chain efficiency and greater agility of distribution and operations, including the optimization of inventory levels from warehouses to stores to react rapidly to changing consumer behaviors.
Sources
i) What can grocers learn about keeping relevant amid supply chain uncertainty?
ii) Who’s Ditching Their Grocer Over Out-of-Stocks?
iii) NielsenIQ OSA Barometer, Latest 52 weeks, proprietary models based on daily point-of-sales data