Native American Beauty consumer spotlight
The population and purchasing power of Native Americans is growing
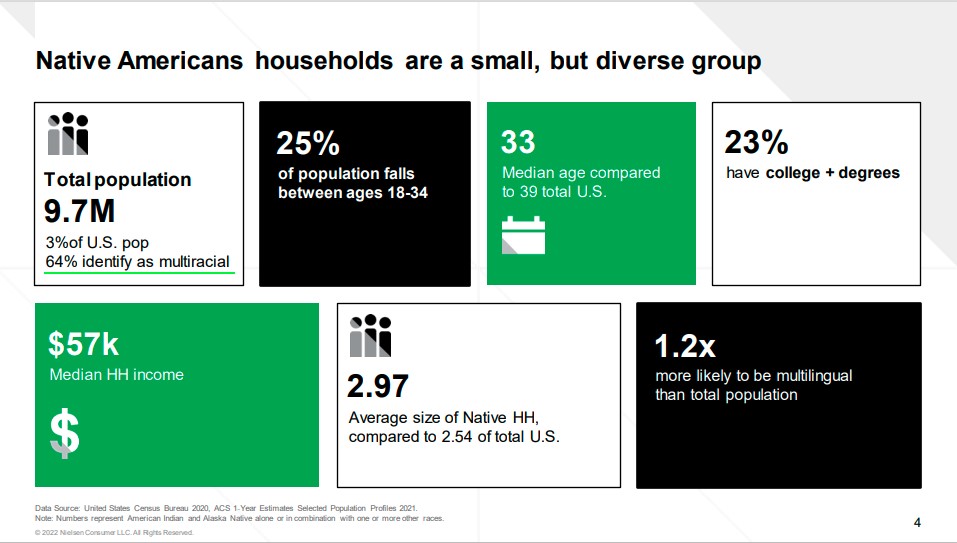
There are currently 9.7 million1 Native American people living in the U.S. and they make up 3% of the total population. A huge 25% of Native Americans are between 18 and34 years old, and 64% of them identify as being “multiracial.” This population is exponentially increasing and is set to grow 38% by 2060.2
Native American beauty consumers in the U.S. collectively spend over $2.2 billion annually, with a higher spend per buyer each year than the average buyer. As a result, the overall purchasing power of Native American consumers reached $115 billion in 20183 – an increase of 185% since 2000.
This is due to the growth of the Native American population and those who identify as multiracial indigenous people, as well as a rise in native-owned businesses. Between 2007 to 2012, the number of Native American-owned businesses increased 15%, 5 times the national average.
Last year, Native American beauty dollar sales increased 7.2%4, which underpaced total U.S. beauty growth of 8.6%. Overall, Native Americans make up 2.8% of beauty buyers, and account for2.9% of beauty dollar sales.
Where they shop and what they buy
Native Americans are more likely to be found shopping in-store than online and they tend to overindex on spend at the following types of stores:
- Mass
- Beauty Specialty
- Department Store
- Dollar
In the mainstream beauty and personal care industry, there’s no noteble preference for either budget or luxury goods. Native American consumers shop a wide range of brands at various price points. Some favorite brands include:
Hair care:
- Cantu Shea Butter
- Goody
- Shea Moisturizer
- Wella
- OGX
- Head & Shoulders
- Schwarzkopf
- Revlon
Cosmetics:
- Benefit
- Elf
- Milani
- Kiss
- MAC
- NYX
- Maybelline
According to NielsenIQ’s Omnishopper Panel, for the past 52 weeks ending in mid October, Native American beauty consumers spent the most money on:
- Fragrances
- Hair styling products, namely hair straighteners, curling irons, curl/wave enhancing products, straightening smoothing products
- Colour cosmetics, namely eye liner, face powder, setting spray, false lashes, lip gloss, contour/highlight products
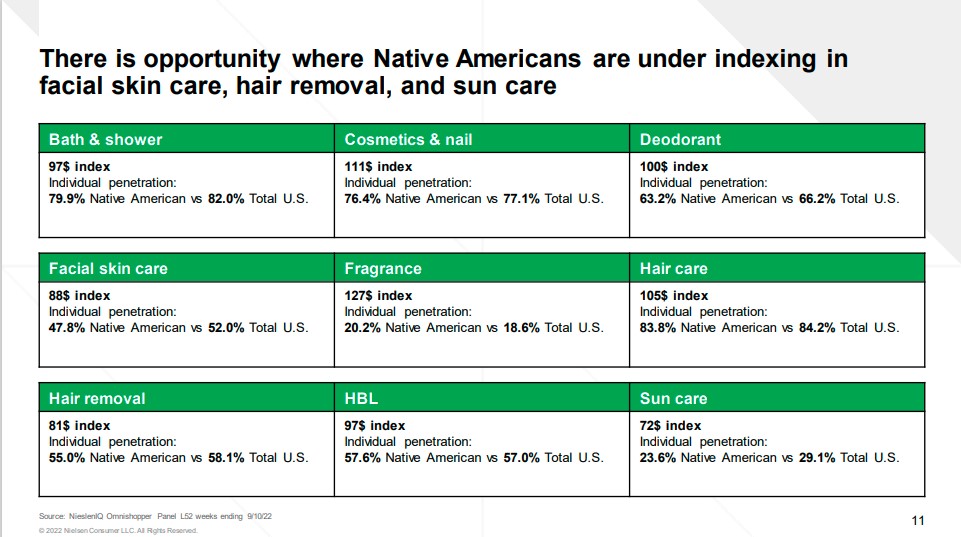
Here’s how this consumer group compares to the average beauty consumer. This consumer group noteabley under-indexes on spend in facial skin care, hair removal, and sun care5
Native American-owned brands reflect cultural values
Many of the top Native American-owned brands are created using sustainable and ethical methods, which mirrors broader trends in the beauty category right. These Native American-owned brands reflect the traditional values of their indigenous founders by using sustainable packaging and clean ingredients. Many support philanthropic initiatives that give back to their communities.
Examples of brands owned by Native Americans include:
- Cheekbone beauty
- Prados Beauty
- Blended Girl Cosmetics
- Sḵwálwen
- Sister Sky
For more details on Native American beauty consumers, from how they shop and influencers to watch, download our eBook.
SOURCES
1 Data Source: United States Census Bureau 2020, ACS 1-Year Estimates Selected Population Profiles 2021. Note: Numbers represent American Indian and Alaska Native alone or in combination with one or more other races.
2 Source: https://www.census.gov/content/dam/Census/library/publications/2020/demo/p25-1144.pdf*Data does not include projection of Native Americans that identify as more than one race
3 Source: https://news.uga.edu/multicultural-economy/
4 Source: NieslenIQ Omnishopper Panel L52 weeks ending 9/10/22 vs YA
5 Source: NieslenIQ Omnishopper Panel L52 weeks ending 9/10/22