Prime Day Cornerstones
Prime Day generated $2.98 billion in sales for the week ending July 20th, representing a 7% growth compared to the previous year. While these numbers are good, they fell short of the anticipated 20% growth based on historical trends and current sales.
So, why the shortfall?
To understand the results, it’s important to look at them in context.
Above all else, consumers are more cost-conscious than ever as they contend with the impact of high inflation and a reduction in savings. Though inflation is slowing, it’s still having a compounding effect on consumers. In fact, consumers are spending 33% more than in the past 4+ years.
1P Sales stumble while 3P Sales surge
Unlike Prime Day 2023, where both 1P and 3P saw double-digit growth, more growth in July 2024 was driven by Amazon 3P sellers (13% CPG unit growth).4 For 1P sales, Amazon saw very mixed results. Health & Beauty and Grocery departments were the bright spots for Amazon 1P unit growth (16% and 11.7% respectively).5 Looking at subcategories, some standouts include Bath & Shower (+49%), Deodorant (+57%), and Baking Mixes (+73.8%).5 Meanwhile, Baby Care, Pet Care, and Household Care all saw a decline.
3P sales saw similar bright spots, but growth and declines were better across the board. Health & Beauty was up an impressive 23.4%.5 Within the category, 3P sales for Facial Skin Care and Feminine Care were particularly notable (67.% and 50.8% respectively).5 Meanwhile, 3P Grocery grew 10.2%, nearly reaching the same growth as 1P.5
As you can see, 2024 was a year with deep discounts aimed at capturing the attention of financially strapped consumers. But, deeper discounts don’t always lead to greater sales. Finding that sweet spot is key and these trends highlight some major opportunities for 3P sellers who know how to take advantage of these promotional days. By factoring trends into your strategies and focusing on creating a robust omnichannel portfolio, you are more likely to get the biggest return from these annual promotions.

The power of the buy box
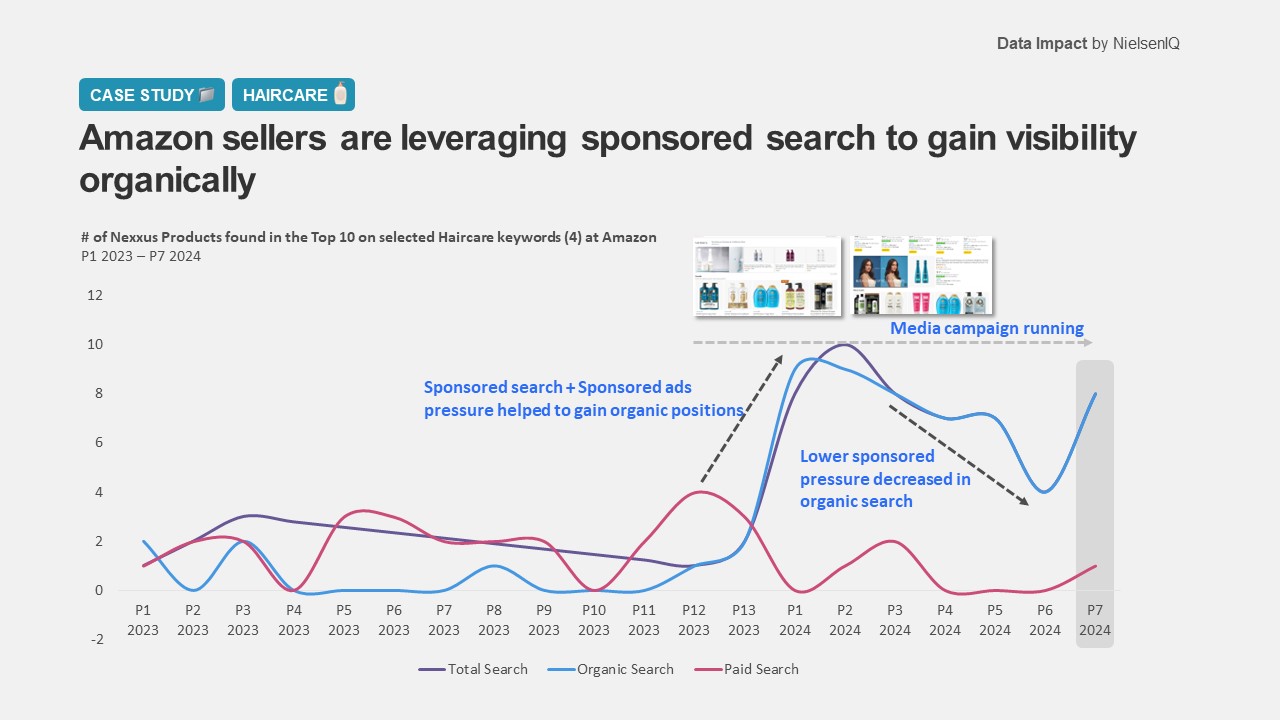
The Buy Box is the coveted, rectangular section on the product page where customers can click the product and go to the seller’s shop page versus Amazon shop and directly add an item to their cart. It’s the prime real estate on the page, and securing it can significantly boost sales. The platform’s algorithm determines which seller’s product appears in the Buy Box based on a number of factors such as rating, reviews, price, inventory, and seller performance. This feature may play an integral part in helping 3P sellers outpace their competition.
In 2024, Amazon sellers significantly increased their investment in sponsored search media—particularly in the lead-up to Prime Day—with the ultimate goal of securing the coveted Buy Box. By driving product purchases through sponsored ads, sellers aim to boost best seller rankings and accumulate essential ratings and reviews. This strategic approach not only enhances visibility through sponsored search but also organically improves search rankings over time. Pre-Prime Day promotions have become a common tactic to generate sales and customer feedback, which can significantly influence a product’s visibility during the highly competitive Prime Day event.
The Role of sustainability and wellness
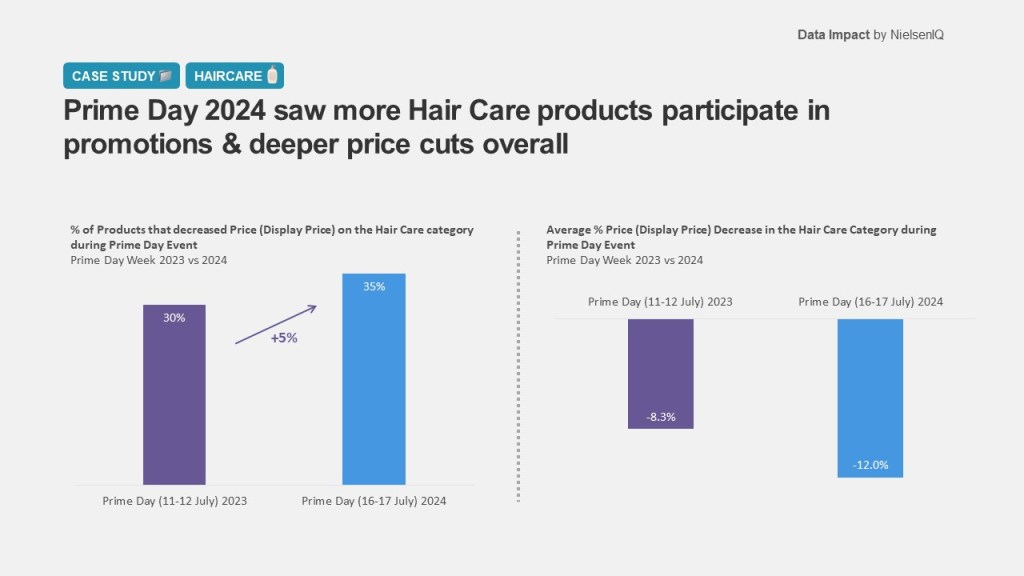
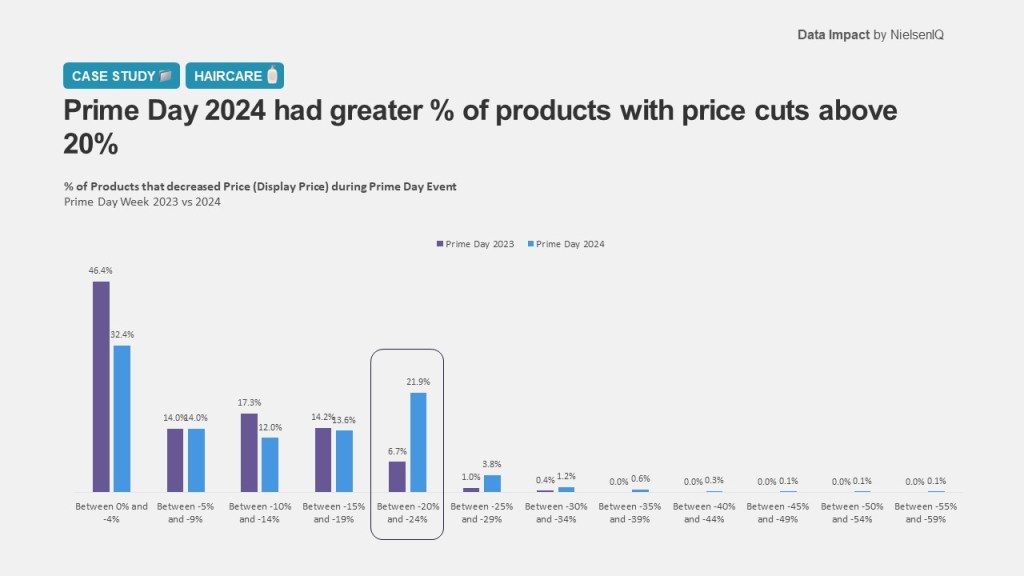
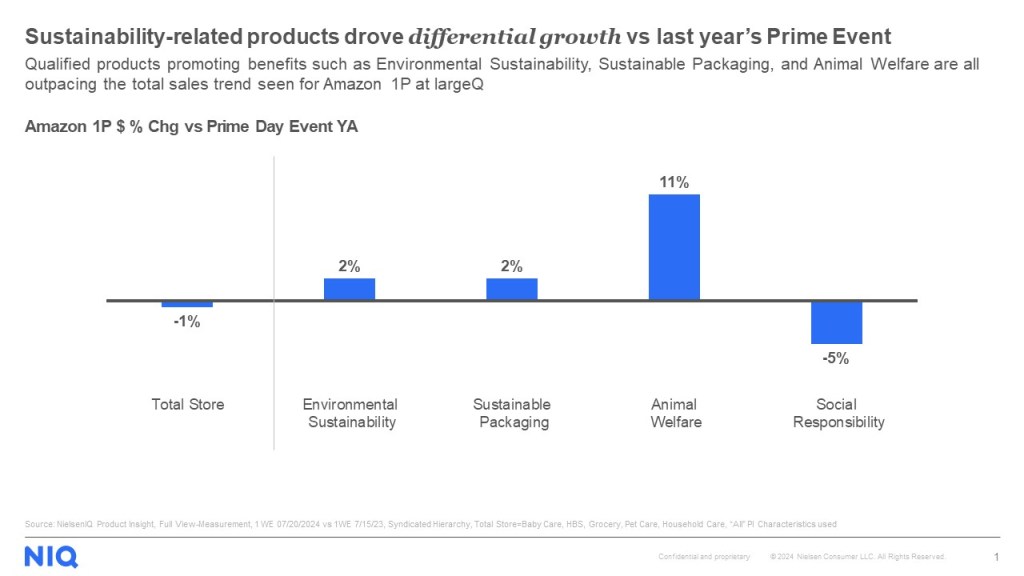
During this year’s Amazon Prime Day Event, sustainability took center stage, significantly influencing consumer purchasing decisions. Products that emphasized environmental sustainability, sustainable packaging, and animal welfare outperformed their competitors, revealing a clear shift towards more conscious consumption choices. This trend was particularly evident in categories such as hair care, pet food, and vitamins & supplements, which saw impressive sales, totaling $123 million, $103 million, and $91 million, respectively.7 These figures underscore the growing demand for products that align with consumers’ values and the increasing importance of sustainability in driving growth during major shopping events.
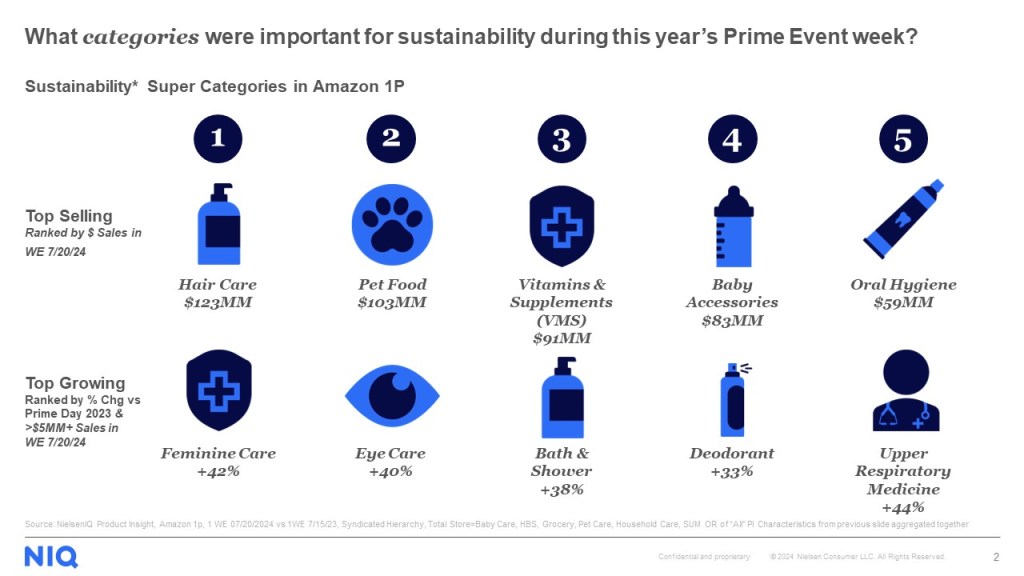
In addition to top-selling categories, several product segments experienced remarkable year-over-year growth, highlighting the expanding influence of sustainability across various consumer goods. Feminine care, eye care, and bath & shower products saw sales surge by 42%, 40%, and 38%, respectively, compared to Prime Day 2023.7 Deodorant and upper respiratory medicine also experienced significant growth, with increases of 33% and 44%.7 These trends reflect a broader consumer shift towards wellness and eco-friendly products, as shoppers increasingly prioritize health, self-care, and sustainability in their purchasing decisions, particularly during high-visibility events like Amazon Prime Day. That’s why being able to accurately measure your online sustainability footprint is so important. With NIQ’s Sustainability Scorecards, you can benchmark against competitors, track progress, and unlock growth opportunities in the sustainable e-commerce space.
One size does not fit all: growing and
declining categories
The Health & Beauty Care category once again saw the best sales lift during Prime Day. The growing demand for clean and sustainable products tends to favor the category too. This also fits into the greater macro trends which have seen continued growth in the category with Millennials and Gen Z bolstering e-Commerce sales.6 Computers and Electronics also saw strong sales, up 74%, while Home and Kitchen grew 76%.7
On the flip side, NIQ data shows that Baby Care was by far the least helped category during this period with absolutely no growth in category sales over last year.2 In fact, every subcategory experienced a decrease in Unit Sales, with the only caveat being the 3P formula, which saw some growth. This category has also been one of the most impacted by inflation with Unit price changes being 4% higher than the CPG average in June.3
Understanding the impact of promotions on different categories requires understanding what consumers are seeking from each. When inflation is high and consumers are tightening their belts, some categories are more agile than others, so acting dynamically is key.
A key standout: Beauty
In the realm of non-CPG sales, Beauty had an outstanding performance during Prime Day, with the category-leading sales gains across the two-day event. Health & Beauty Care emerged as a key driver, significantly boosting overall sales. Notably, 3P vendors in the beauty segment experienced faster dollar growth compared to 1P sales, showcasing the expanding influence of these vendors on Amazon’s platform.8 A considerable portion of Prime Day shoppers, 24%, were drawn to beauty products, and Millennials represented a significant 26% of this consumer base.8 This heightened engagement translated into increased spending, with beauty buyers spending $8.60 more on average compared to the previous year.8
The success of the Beauty department can also be attributed to the strong performance of specific subcategories. Facial skincare and hair care were standout performers, with these categories contributing the most to Beauty’s overall success. Facial moisturizers and shampoo/conditioner led the charge, reflecting consumer preferences during the sale. Furthermore, luxury brands and innovative K-Beauty products topped the unit and dollar rankings, illustrating the broad appeal of both mass and high-end beauty offerings.8 This pattern highlights the strategic purchasing behavior of beauty consumers, who are increasingly turning to online platforms for their beauty needs during major sales events
24%
of Prime Day shoppers purchased beauty
26%
of Prime Day beauty shoppers were Millennials
$8.60
spent more on Beauty by Prime Day buyers vs. YA
Closing Thoughts
As we approach the next Deal Days in October, it’s important to temper expectations. While a major sales lift is all but guaranteed, it’s highly unlikely to reach previously forecasted heights as economic pressures remain for many consumers. Brands should focus on dynamic pricing efforts and ride the wave of growing 3P sales that Prime Day brings with it.
To stay on top of all key shopping events, follow along on NIQ’s Prime Pulse Hub and get caught up on the latest news.
Sources
1 – Foxintelligence by NielsenIQ & NIQ data
2 – Foxintelligence panel Report – Target Circle Week vs Prime Days
3 – NielsenIQ, Total US xAOC, Annual Unit Price % Change YTD: 26 weeks to June 29, 2024
4 – 1P v. 3P
5 – NielsenIQ, Total US xAOC, 2 All Markets during 1 w/e 07/20/24, 1 w/e 07/15/23
6 – NIQ US Gen Z survey, Aug 2022, Q14
7 – NielsenIQ Product Insight, Amazon 1p, 1 WE 07/20/2024 vs 1WE 7/15/23, Syndicated Hierarchy, Total Store=Baby Care, HBS, Grocery, Pet Care, Household Care, SUM OR of “All” PI Characteristics from previous slide aggregated together
8 – NielsenIQ RMS Amazon week of 7/20/2024 vs week of 7/15/2023