The Innovation Barometer, powered by BASES Innovation Measurement and Consumer Panel Services (CPS), quickly identifies, categorizes, and measures innovations, to bring you a quarterly update on the most active players in CPG innovation, what’s up, what’s down, who’s winning, who’s losing and more. By using NielsenIQ sales data and consumer panel data, we give you an overview of innovation activity and performance across six key super-categories: food, confectionary and snacks, beverages, alcoholic beverages, home care and personal care.
January 2026 Edition
What is the current state of innovation in the CPG industry in Western Europe?
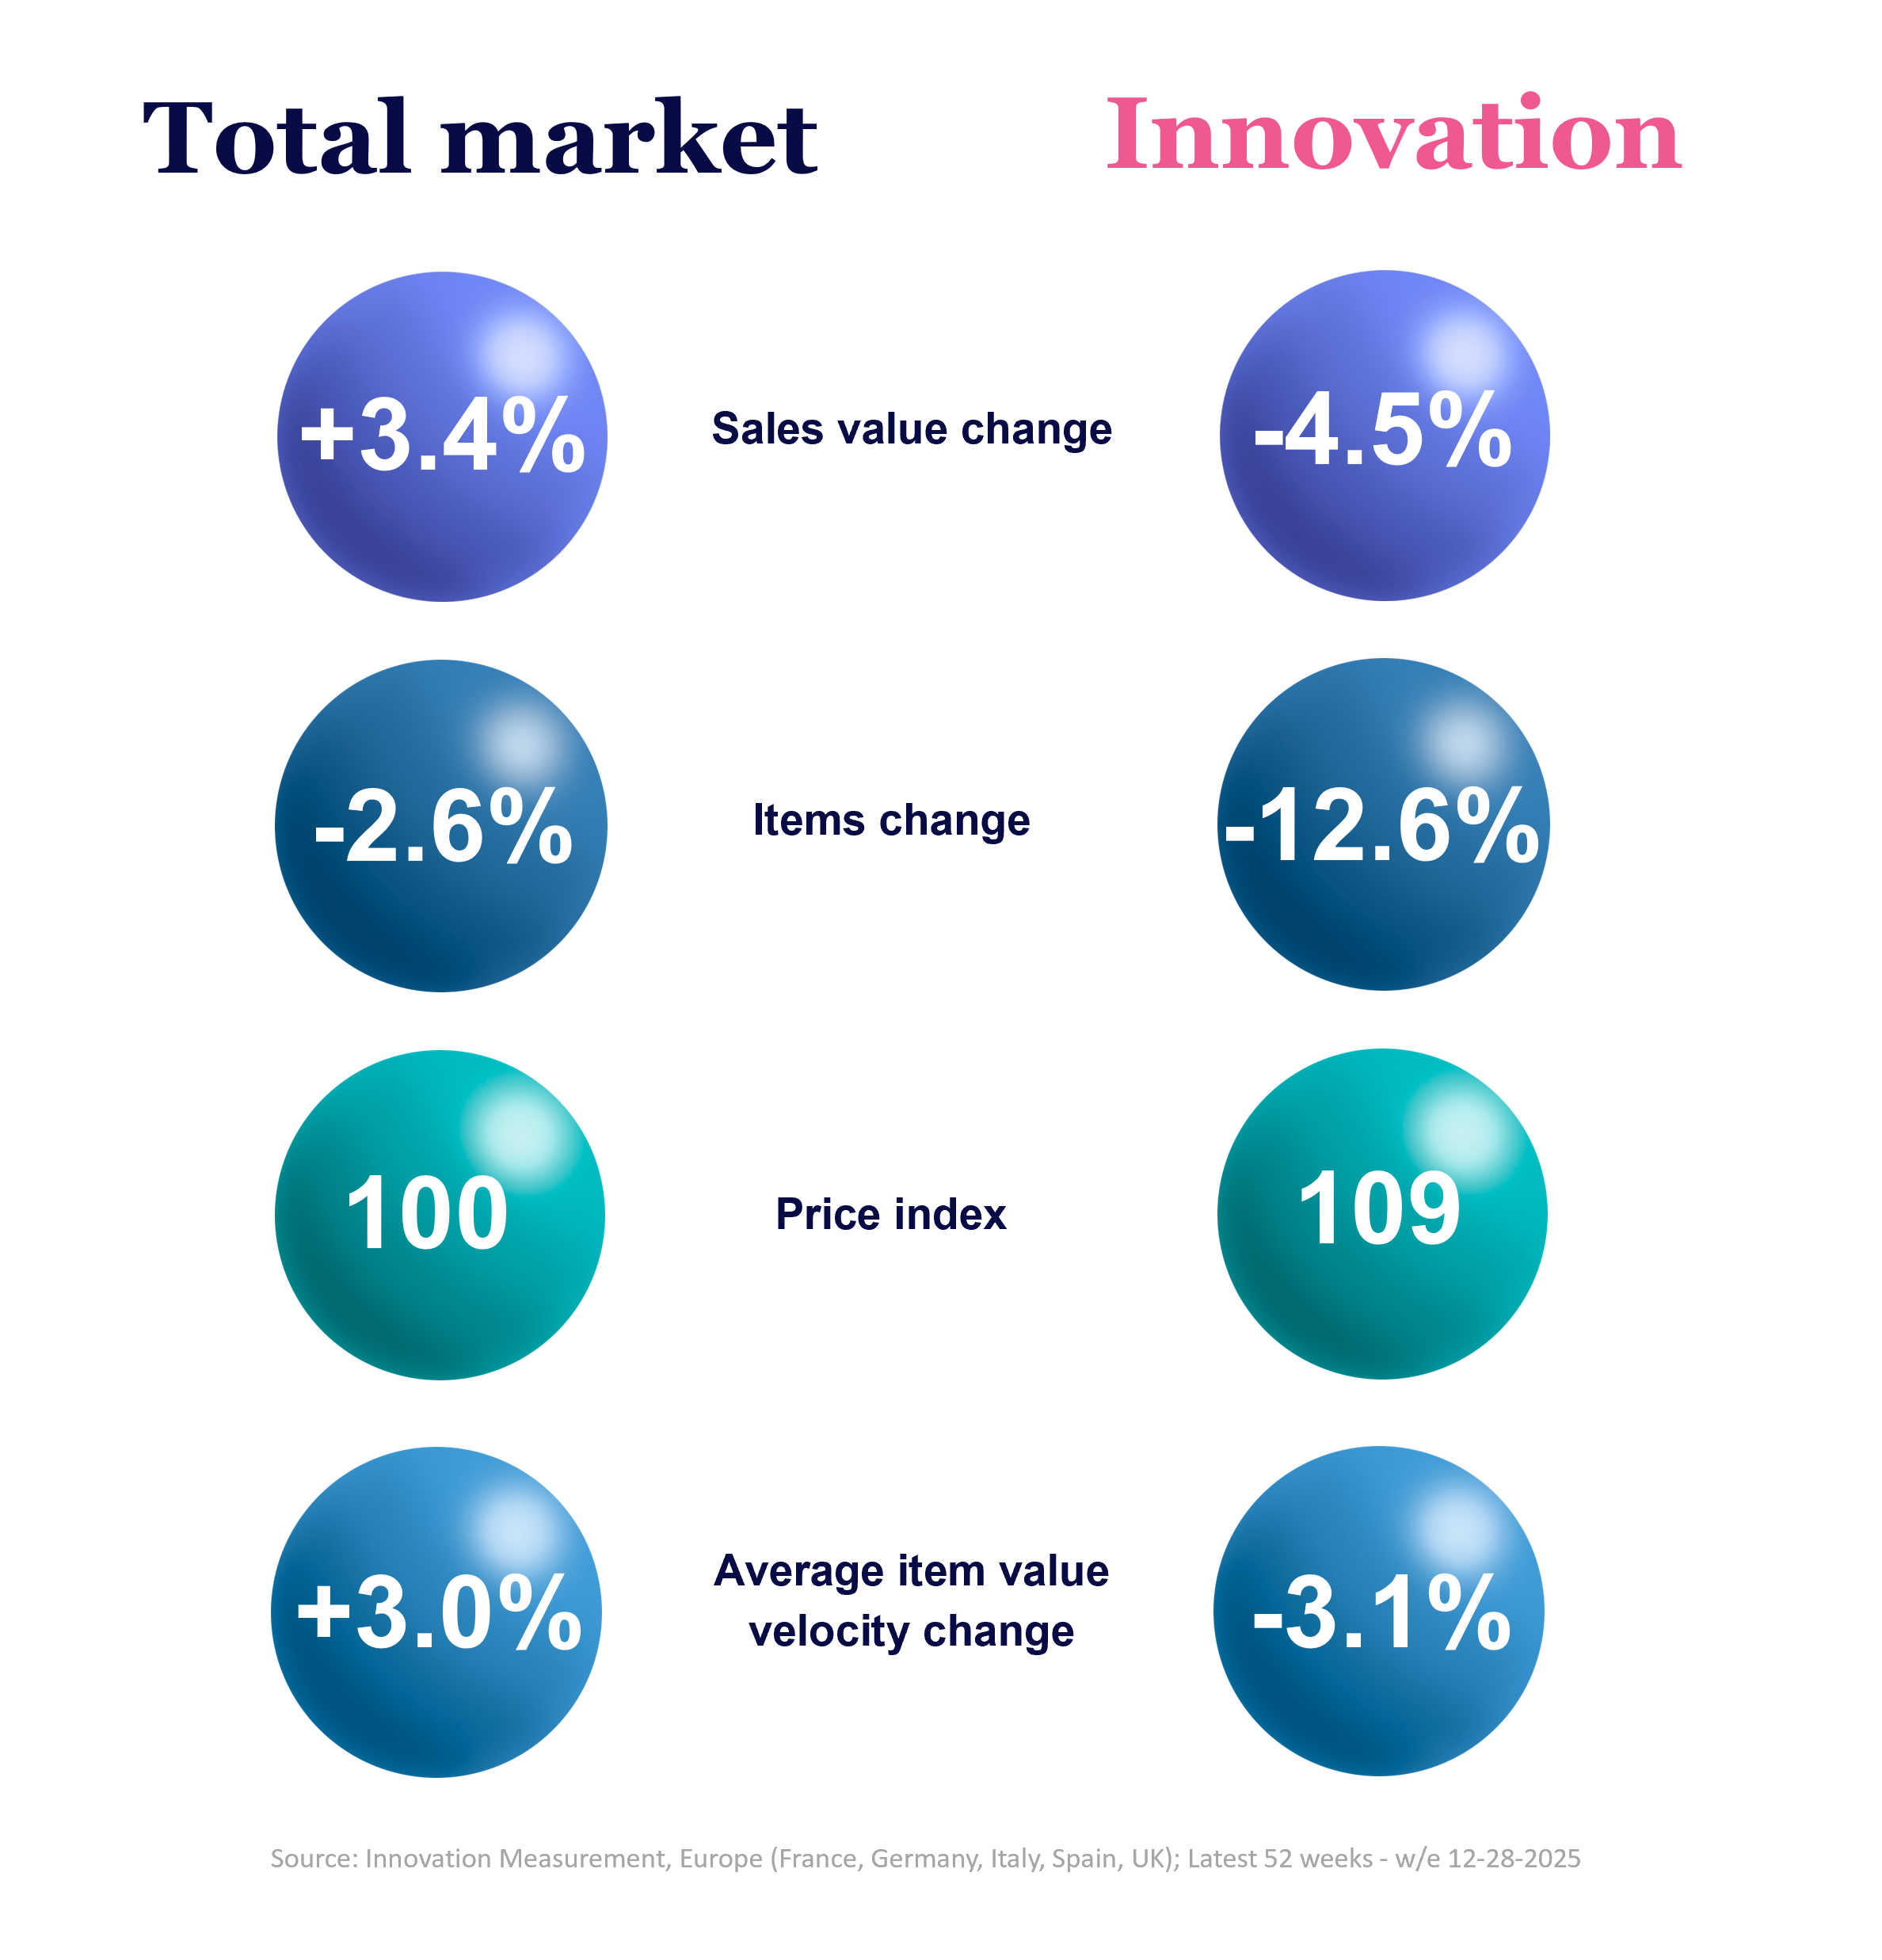
Compared to a year ago, total sales increased by 3.4%, while sales coming from innovations declined by 4.5%.
The overall number of products available in the market across all categories decreased by 2.6%, with new products decline of almost 13%.
In 2025, innovations were on average 9% higher priced compared to the average FMCG product price in Western Europe.
While average item value velocity increased, innovation velocity declined.
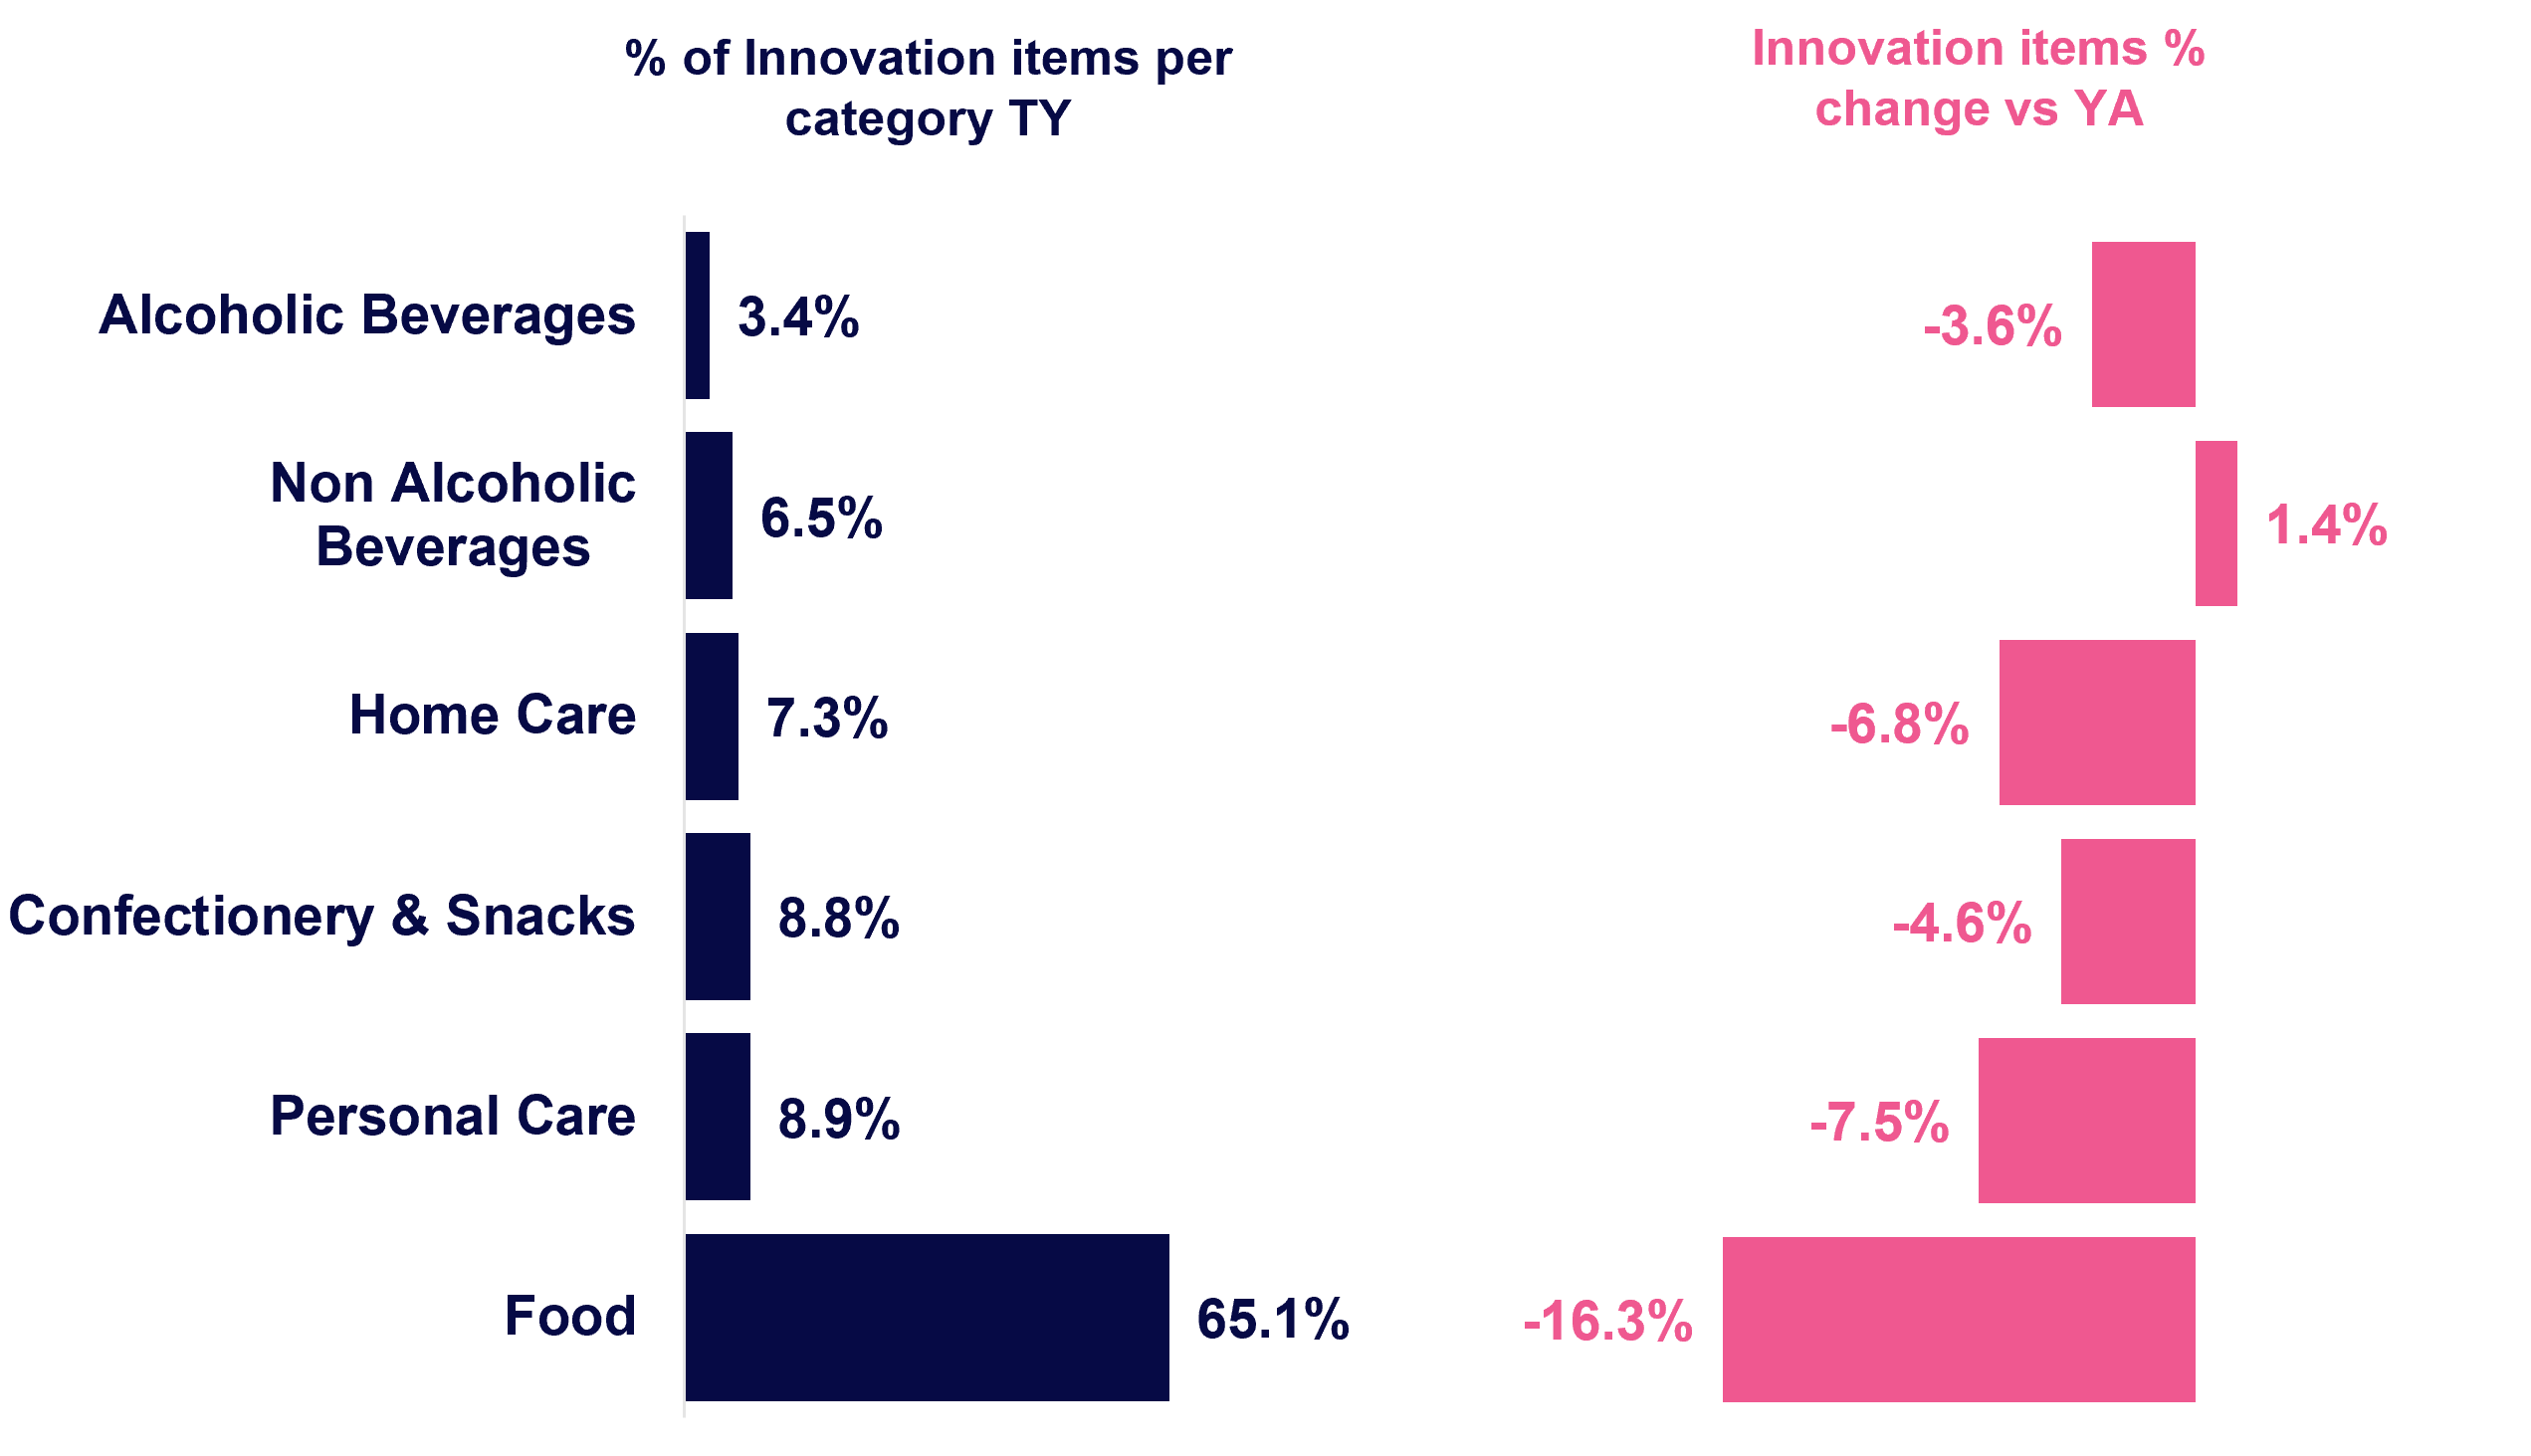
Most of the innovation items in 2025 were within Food categories, but experienced double-digit decline compared to 2024

181k
innovation items were launched in 2025 (-12.6% vs a year ago)
Innovation Contribution
Home Care
24.0%
+0.3 pts vs YA
Total Market
9.1%
–0.6 pts vs YA
Alcoholic beverages
4.6%
-0.8 pts vs YA

Average Item Velocity
Food
11.724
-0.3% vs YA
Total Market
7.235
-3.1% vs YA
Personal Care
3.483
+3.6% vs YA
Category Spotlight
Personal Care

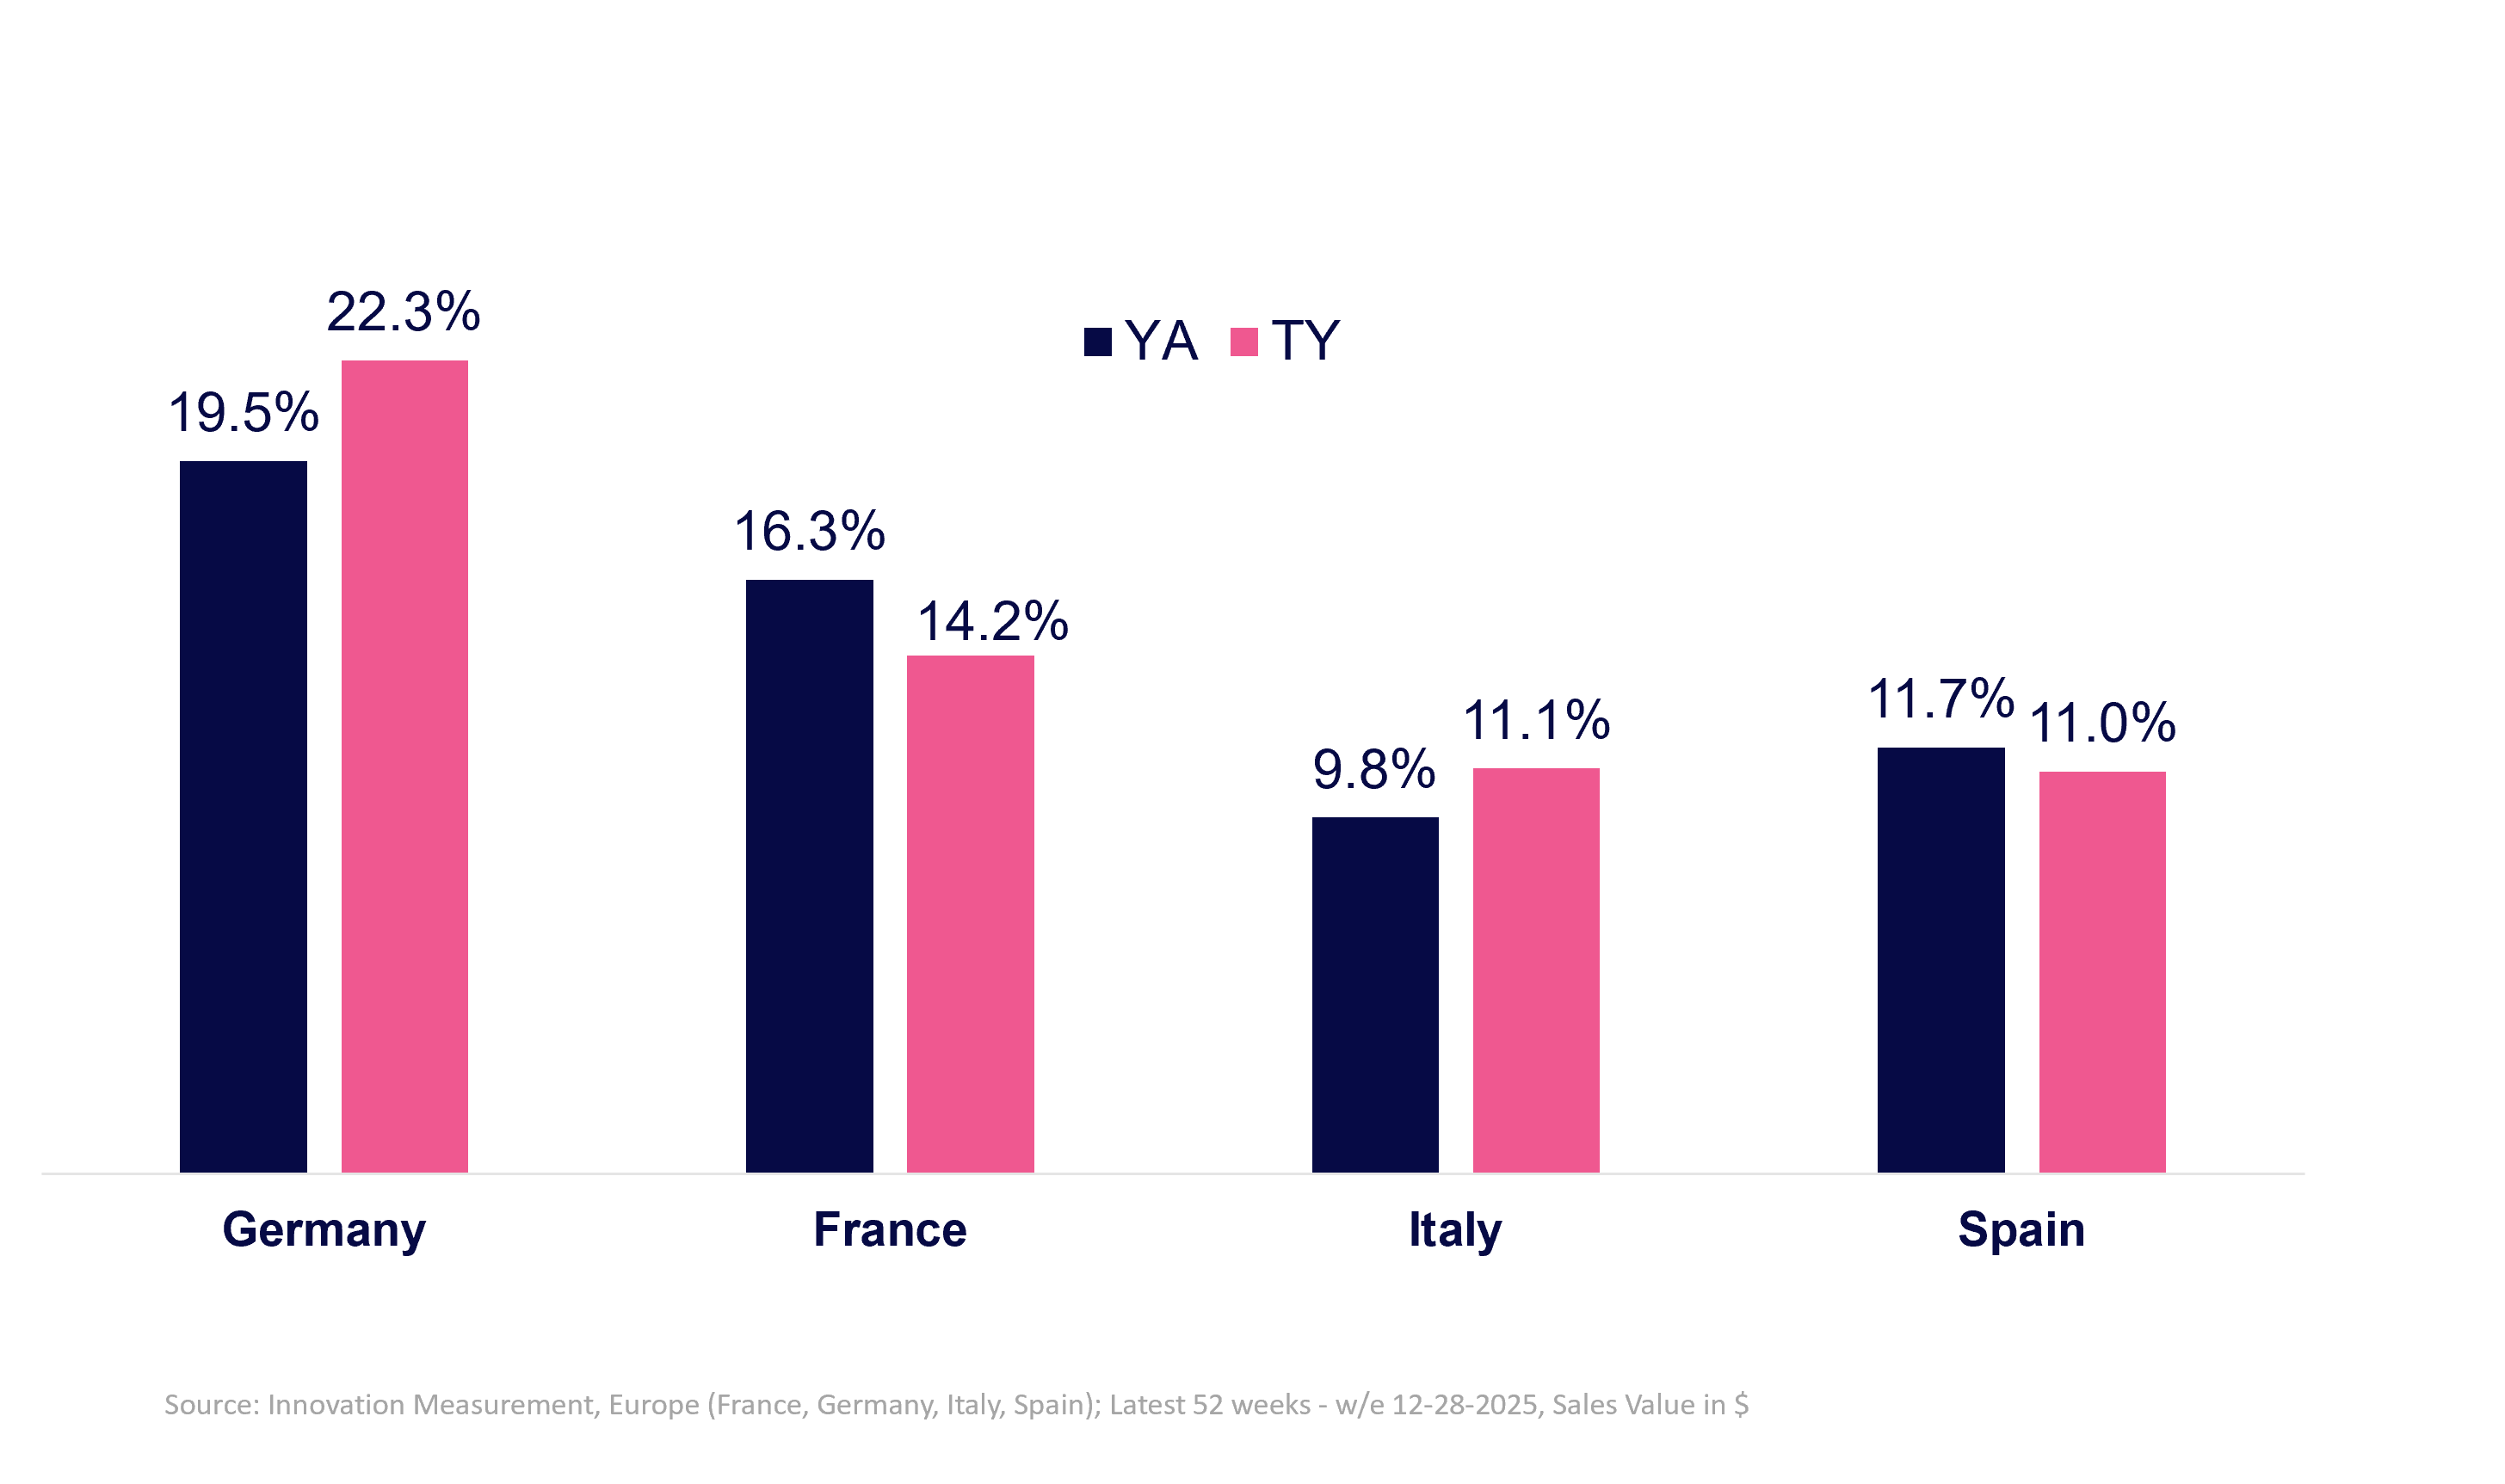
Germany stands out with above-average innovation contribution

Innovation sales holds
16.1%
of total Personal Care value sales in Western Europe
% of Innovation Contribution to Total Sales
5 most innovation active brand owners in Personal Care
1
Procter & Gamble
907
2
L’Oréal
855
3
Henkel
346
4
Beiersdorf
318
5
Unilever
297
Source: BASES Innovation Measurement, Europe (France, Germany, Italy, Spain); Latest 52 weeks until January 22nd 2026; Total number of innovations by brand owner (product x country counts)

Want to know which innovations made the cut?
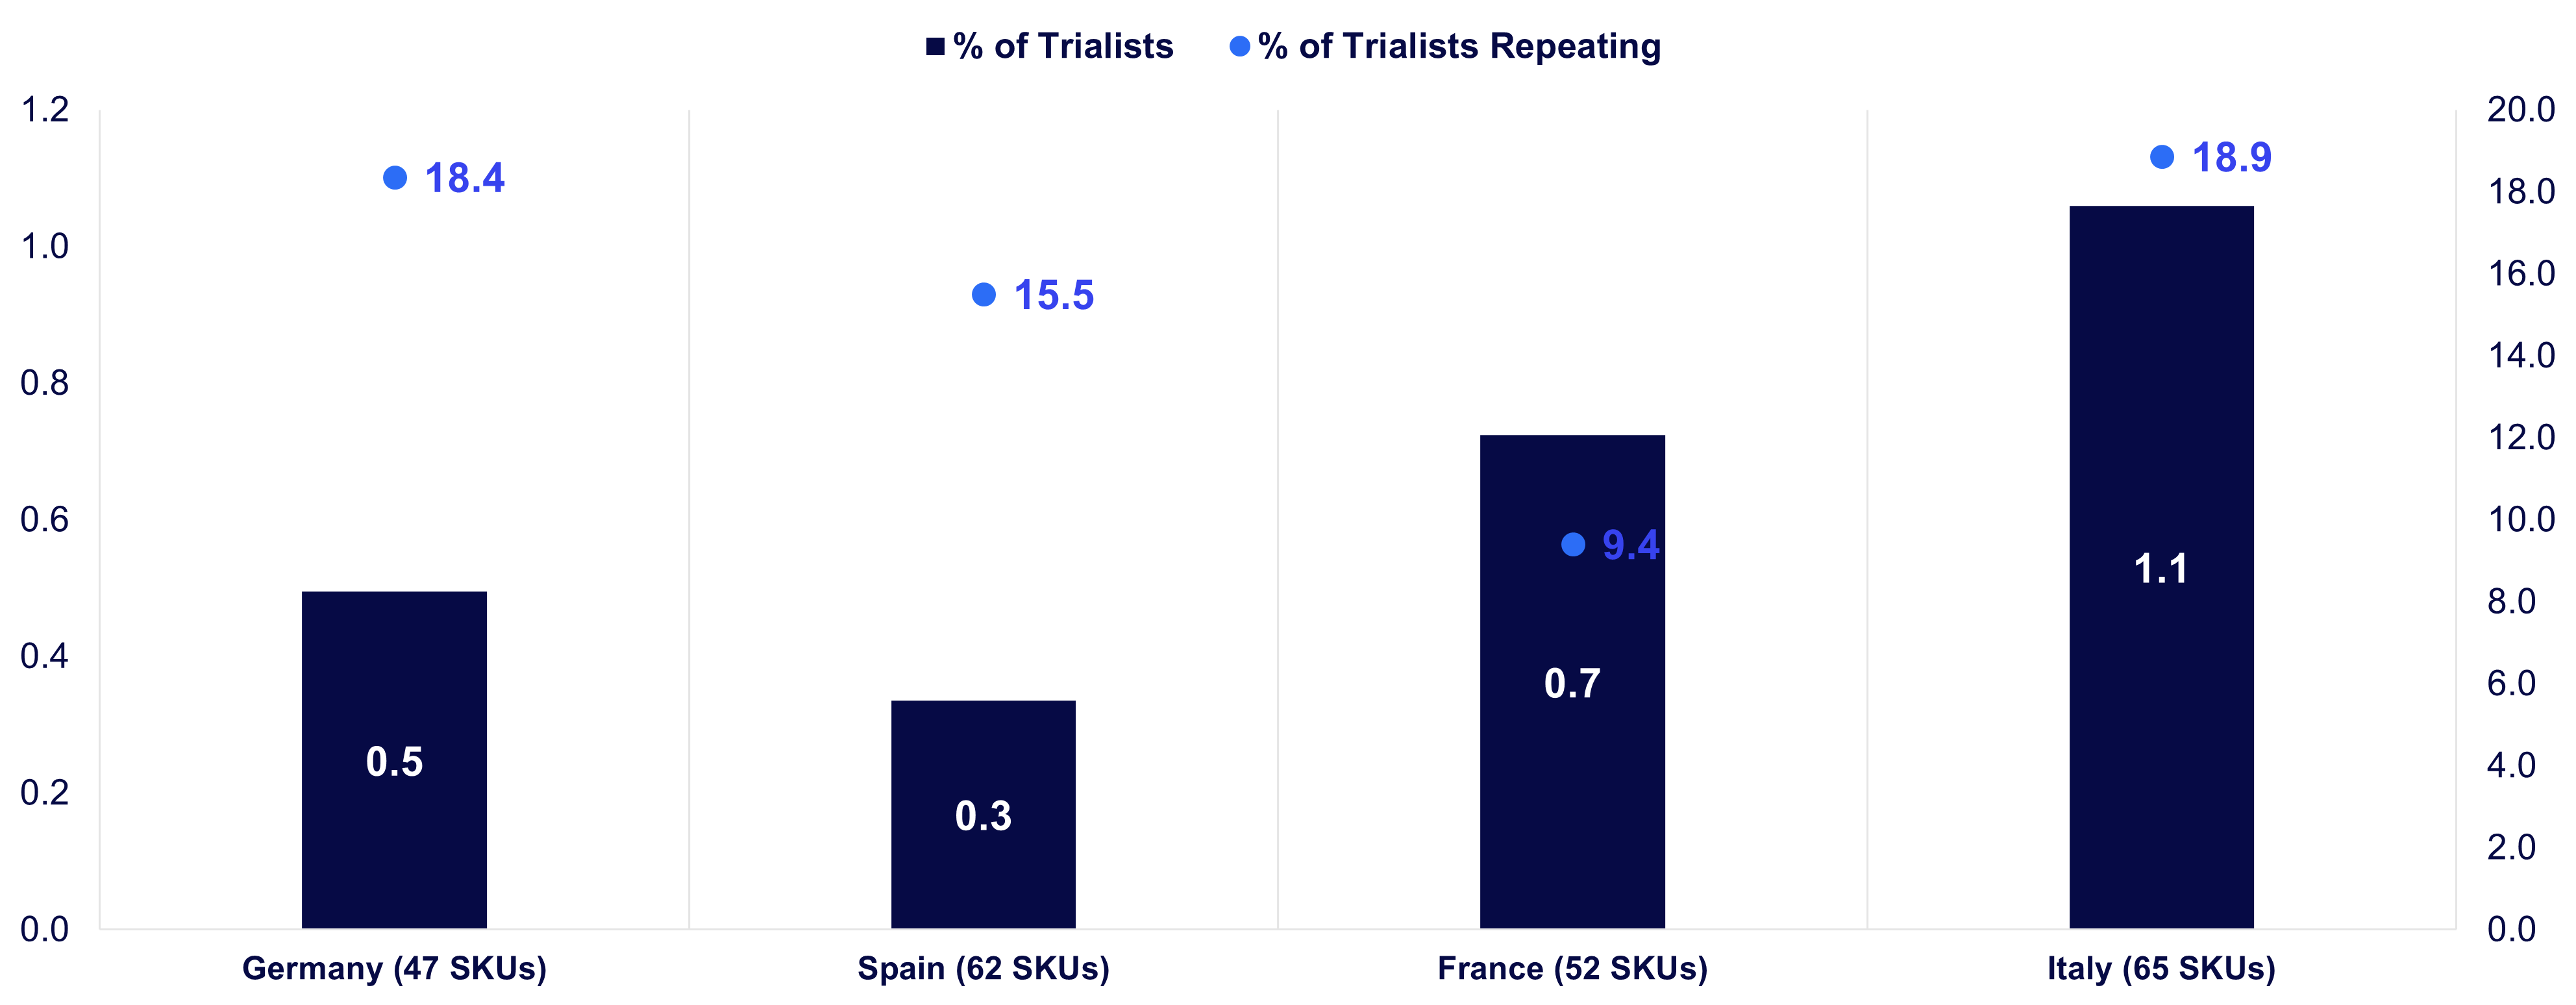
Italy leads the way, with an average of 1.1% of households trying the top recent Personal Care innovation items and about 19% of them repurchasing at least once after 6 months of launch
High repeat rate is also visible in Germany, although trial is the lowest among the four countries
Top 10 launches in past 52 weeks per country based on value sales
Avg. Cumulated % Trial and Repeat after 24 weeks as of launch
Source: : NIQ Homescan data ending 30th November 2025. Top innovations cover New Brands/brand extensions and New Sub-brands, that launched in the past 52 weeks
Re-branding and relaunching is excluded. Ranking is based on past year value sales within each country.
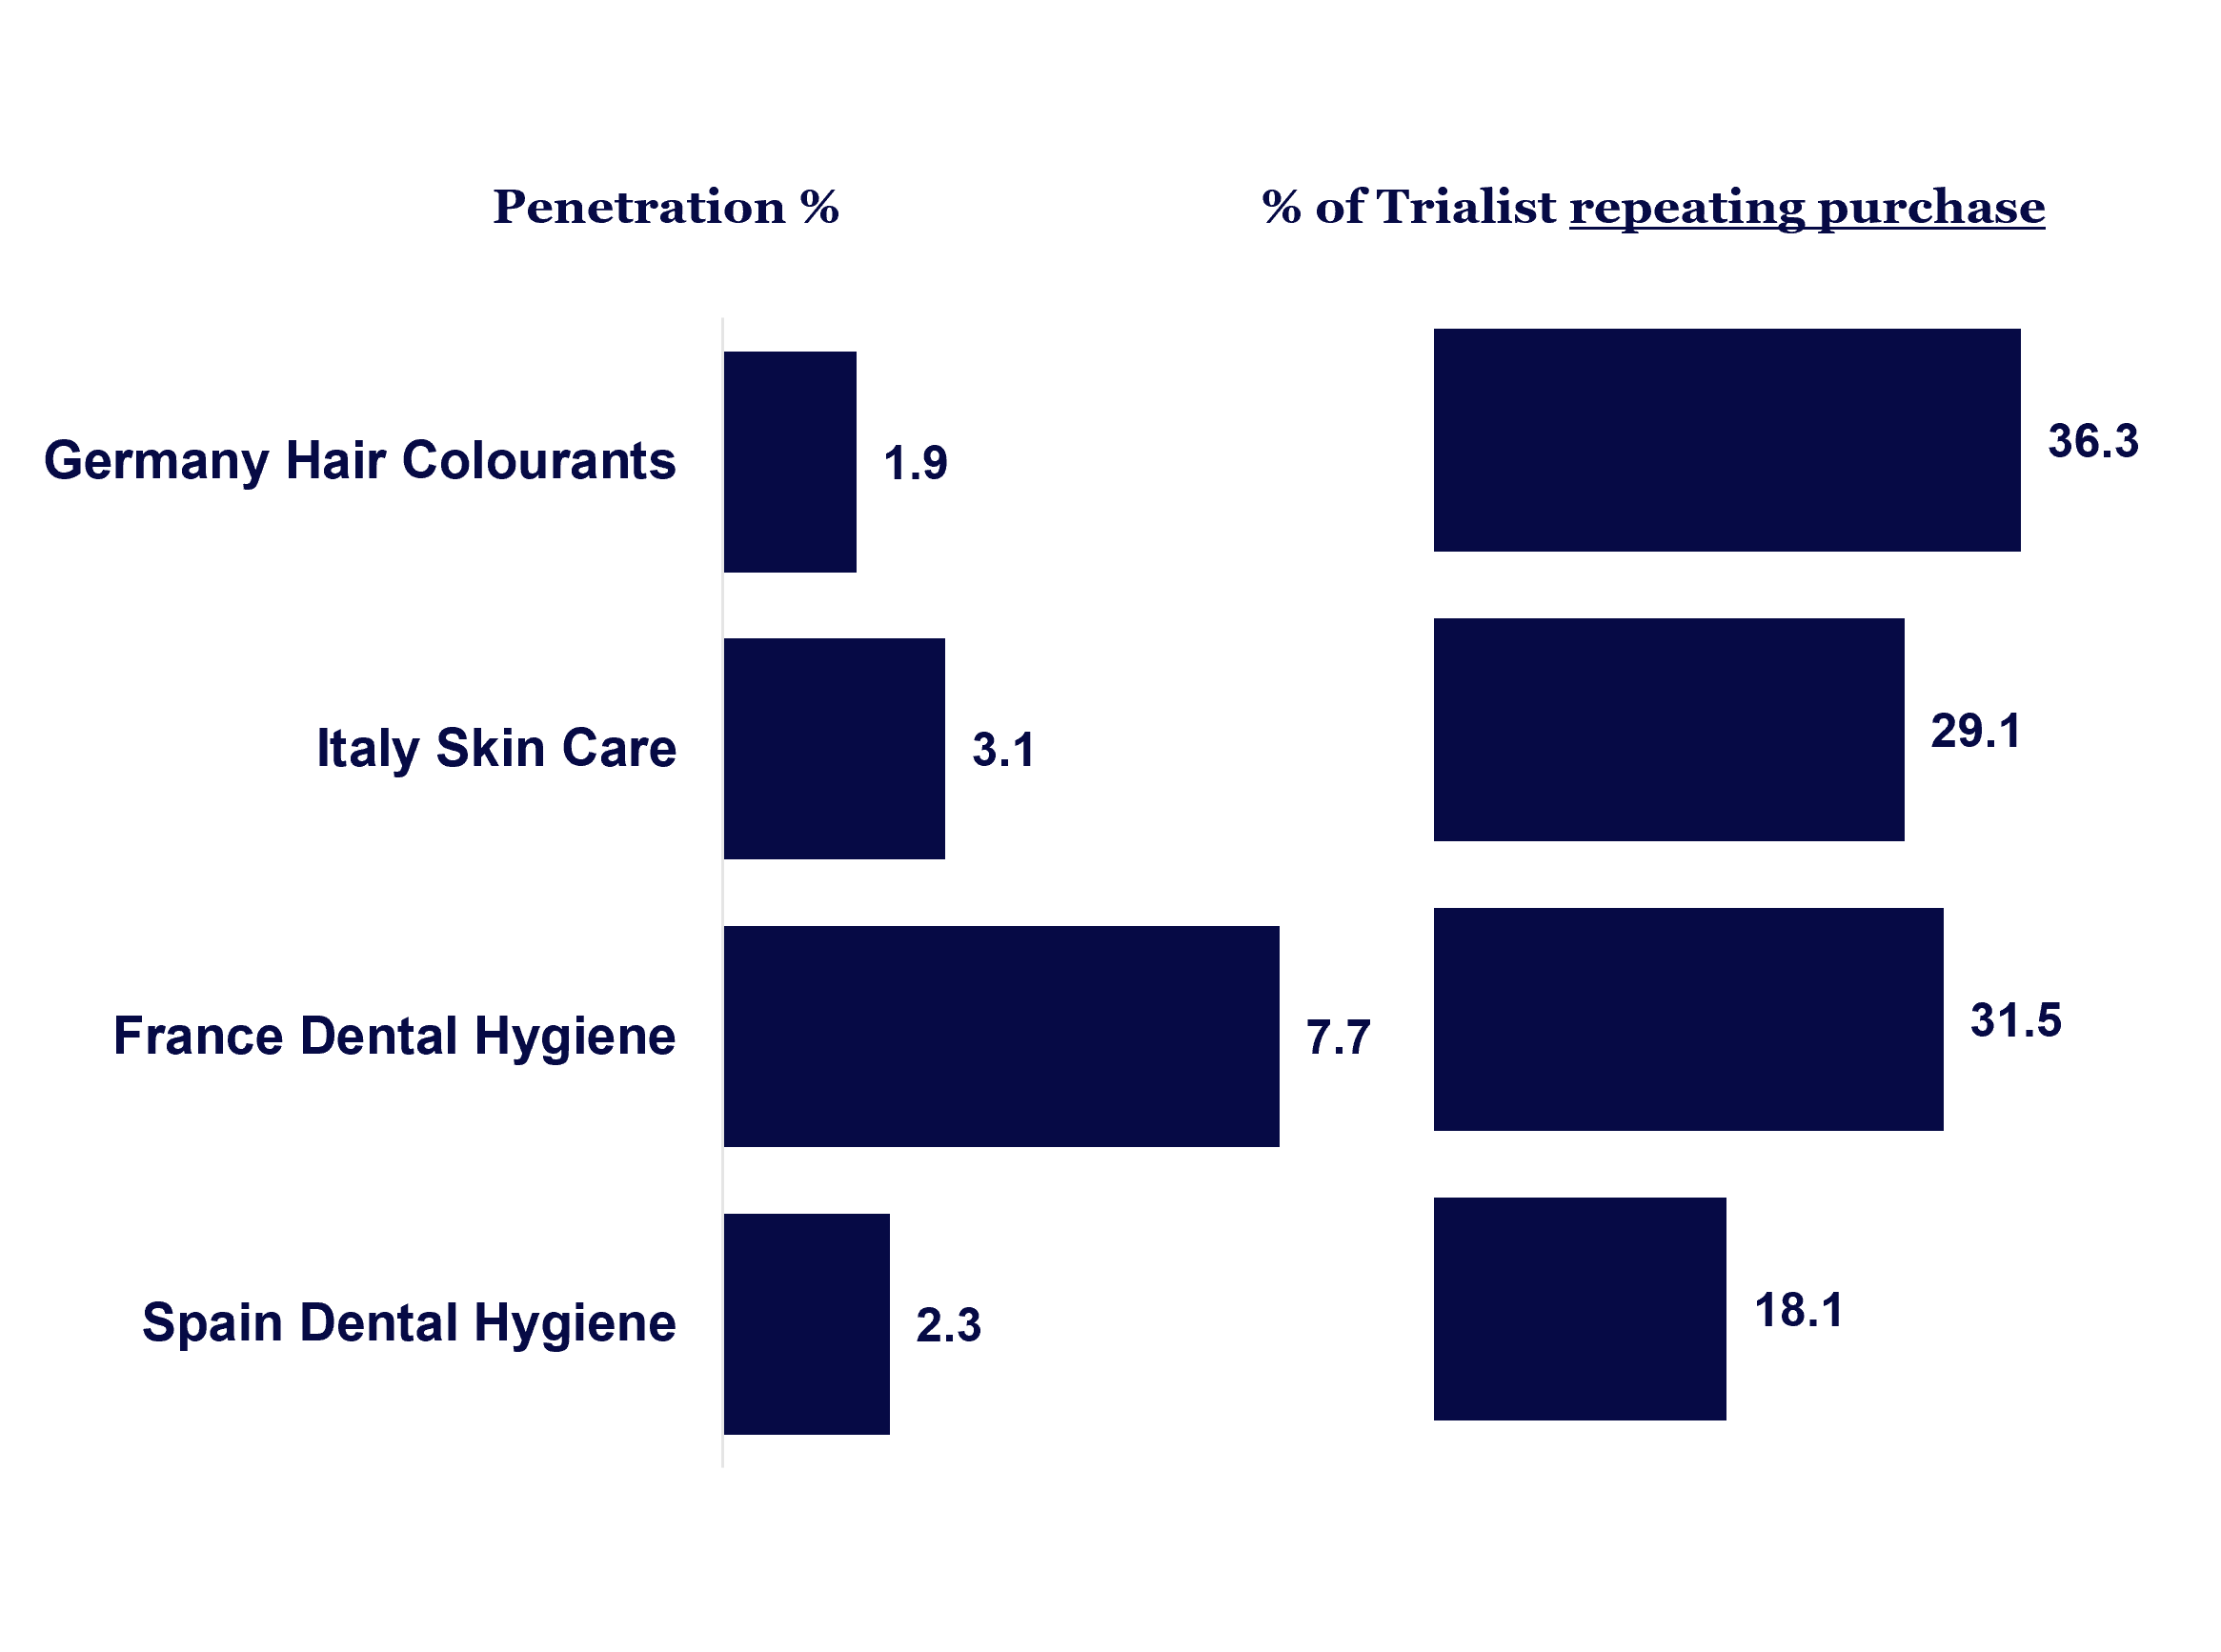
Highest selling innovations are the ones that also excel in building and retaining penetration. Still, in Spain there is an opportunity to evaluate low repeat rates.

A higher proportion of Italian and German trialists are re-purchasing new products after their first trial
5 top Personal Care launches in each WE country
(ranking based on value sales and in descending order)
Source: NIQ Homescan data ending 30th November 2025. Top innovations cover New Brands/brand extensions and New Sub-brands, that launched in the past 52 weeks. Re-branding and relaunching is excluded. Ranking is based on past year value sales within each country
Italy Dental Hygiene
#5 in sales (2.6mil)
#4 in penetration (2.3%)
#2 in repeat rate (26.0%)
Spain Dental Hygiene
#1 in sales (4.0mil)
#1 in penetration (2.3%)
#4 in repeat rate (18.1%)
Want to get a more in-depth view of our Innovation Barometer data?