The Innovation Barometer, powered by BASES Innovation Measurement and Consumer Panel Services (CPS), quickly identifies, categorizes, and measures innovations, to bring you a quarterly update on the most active players in CPG innovation, what’s up, what’s down, who’s winning, who’s losing and more. By using NielsenIQ sales data and consumer panel data, we give you an overview of innovation activity and performance across six key super-categories: food, confectionary and snacks, beverages, alcoholic beverages, home care and personal care.
April 2026 Edition
What is the current state of innovation in the CPG industry in Western Europe?
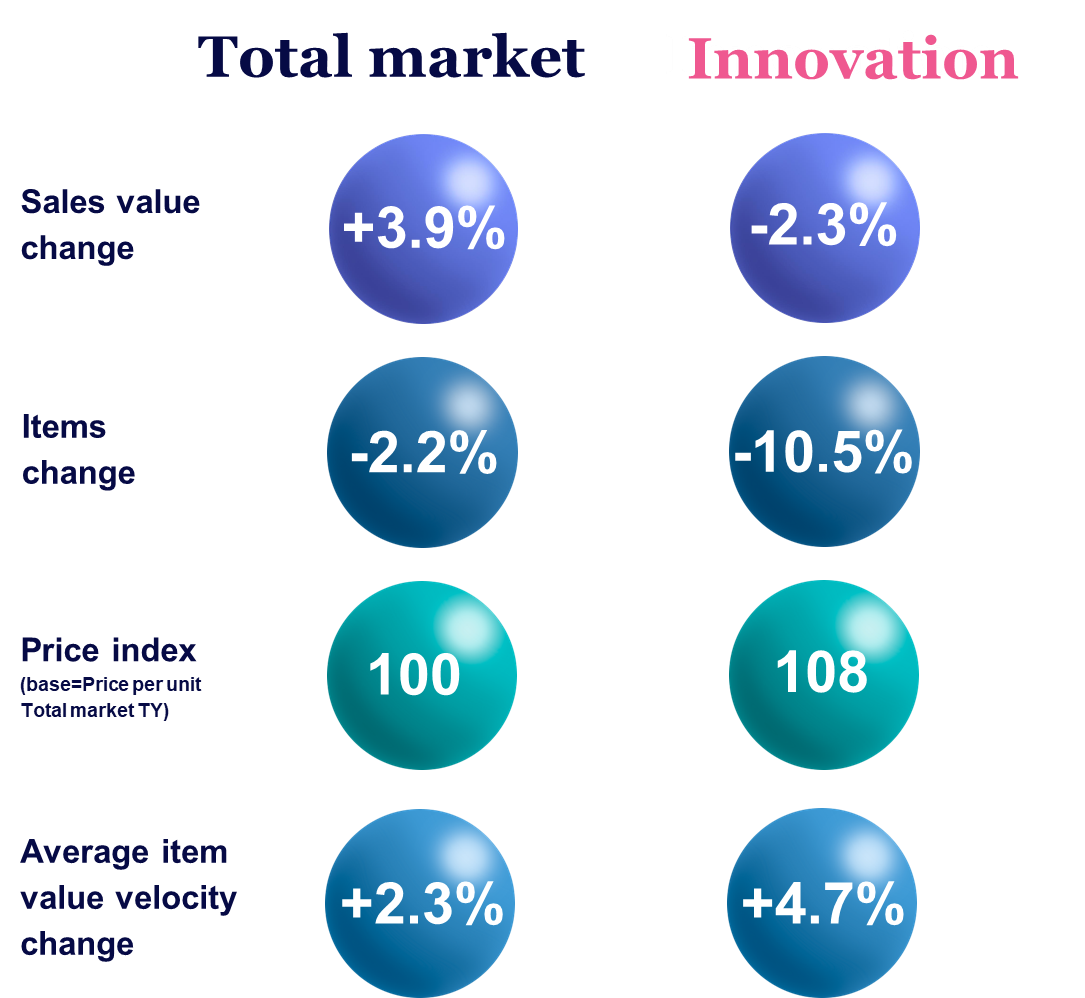
Compared to a year ago, total sales increased by 3.9%, while sales coming from innovations declined by 2.3%.
The overall number of products available in the market across all categories decreased by 2.2%, with new products decline of almost 11%.
This year, innovations were on average 8% higher priced compared to the average FMCG product price.
Both average item value velocity and innovation velocity increased.
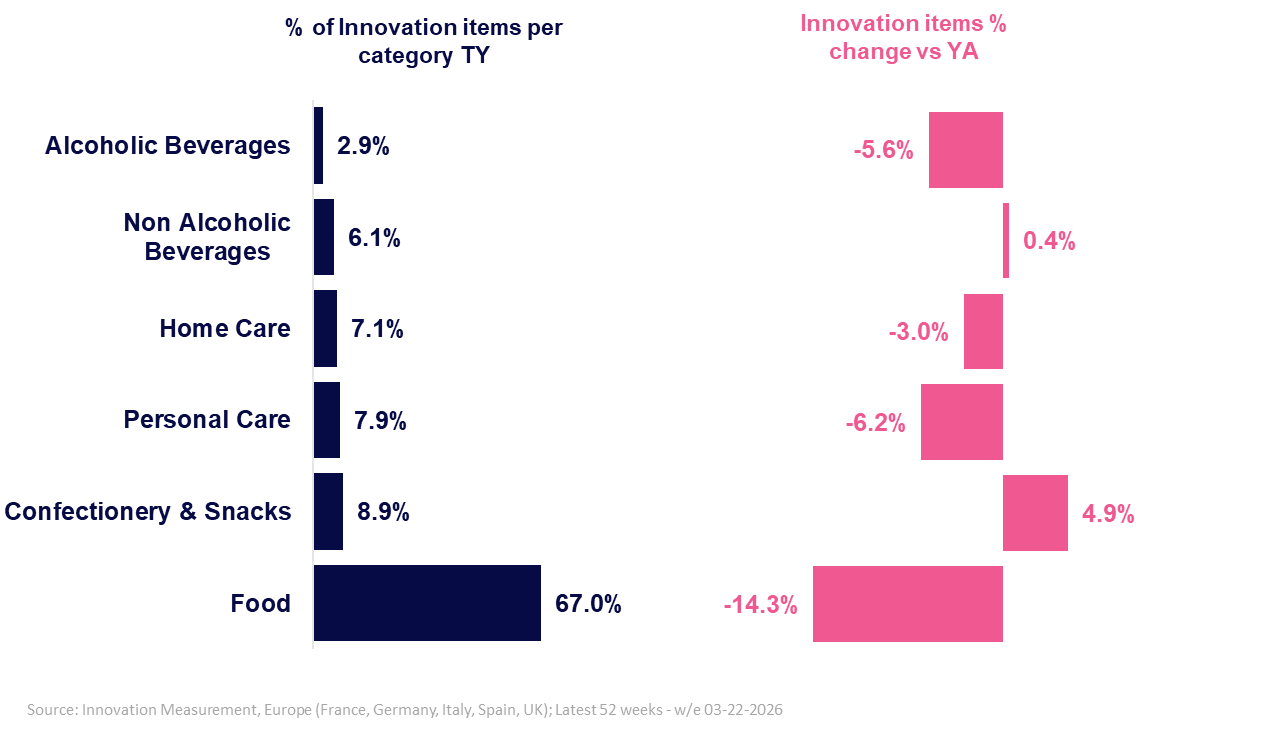
Together with holding the largest share, Food, experienced the steepest decline in the number of innovation items
262k
innovation items were launched in last 52 weeks (-10.5% vs a year ago)
Innovation Contribution
Home Care
23.6%
+2.1 pts vs YA
Total Market
9.8%
–0.6 pts vs YA
Non–Alcoholic beverages
5.0%
-0.6 pts vs YA

Average Item Velocity
Food
13.202
+5.8% vs YA
Total Market
7.703
+4.7% vs YA
Personal Care
3.041
+2.8% vs YA
Category Spotlight
Non-Alcoholic Beverages
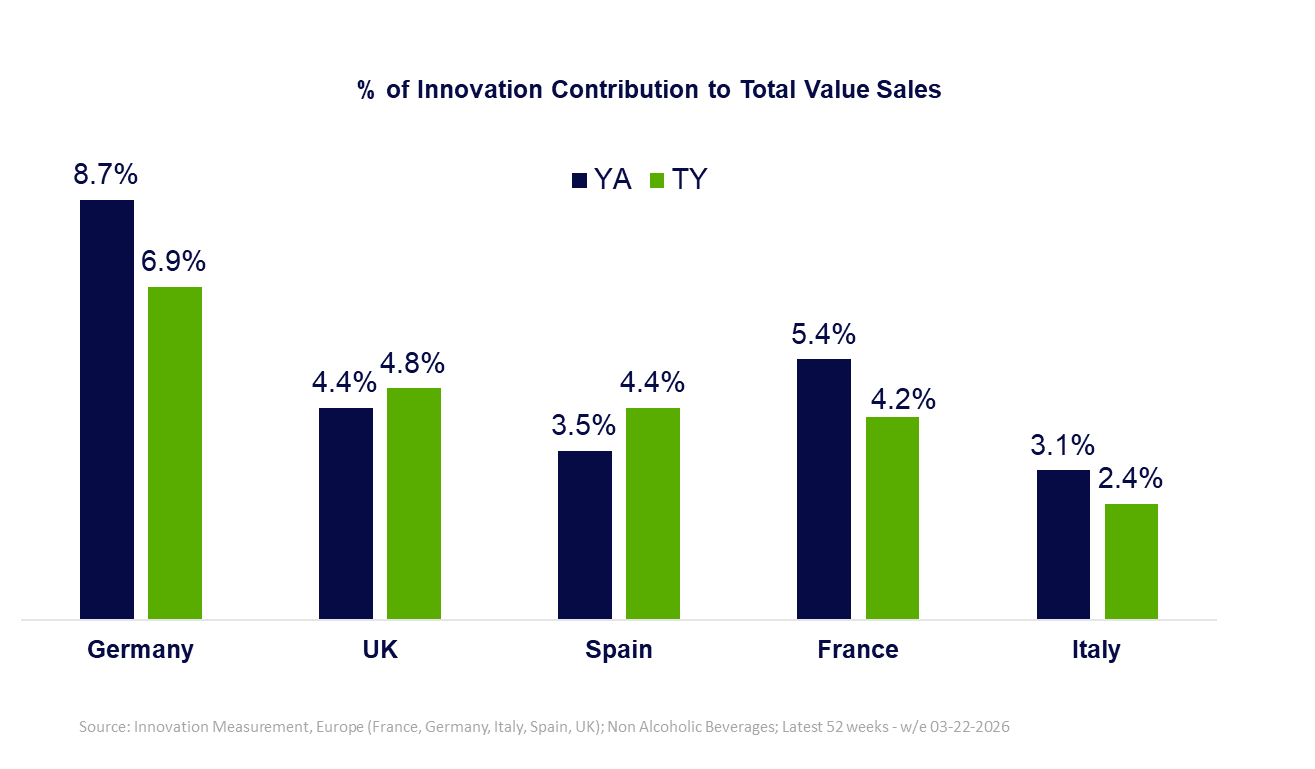
UK and Spain have increased innovation contribution within the Non Alcoholic Beverages category

Innovation sales holds
5%
of total Non-Alcoholic Beverages value sales in Western Europe
5 most innovation active brand owners in Non-Alcoholic Beverages
1
Coca-Cola
292
2
Nestlé
146
3
Klar
125
4
Red Bull
122
5
Carlsberg
111
Source: BASES Innovation Measurement, Europe (France, Germany, Italy, Spain) Non-Alcoholic Beverages; Latest 52 weeks until March 22nd 2026; Total number of innovations by brand owner (product x country counts)
Want to know which innovations made the cut?
Germany leads the way, with an average 1,9% of households trying the top recent Non-Alcoholic Beverage innovation items, and about 37% of them repurchasing at least once after 6 months of launch.
High repeat rate is also visible in the UK, with the highest number of items and only 0,8% trial on average.
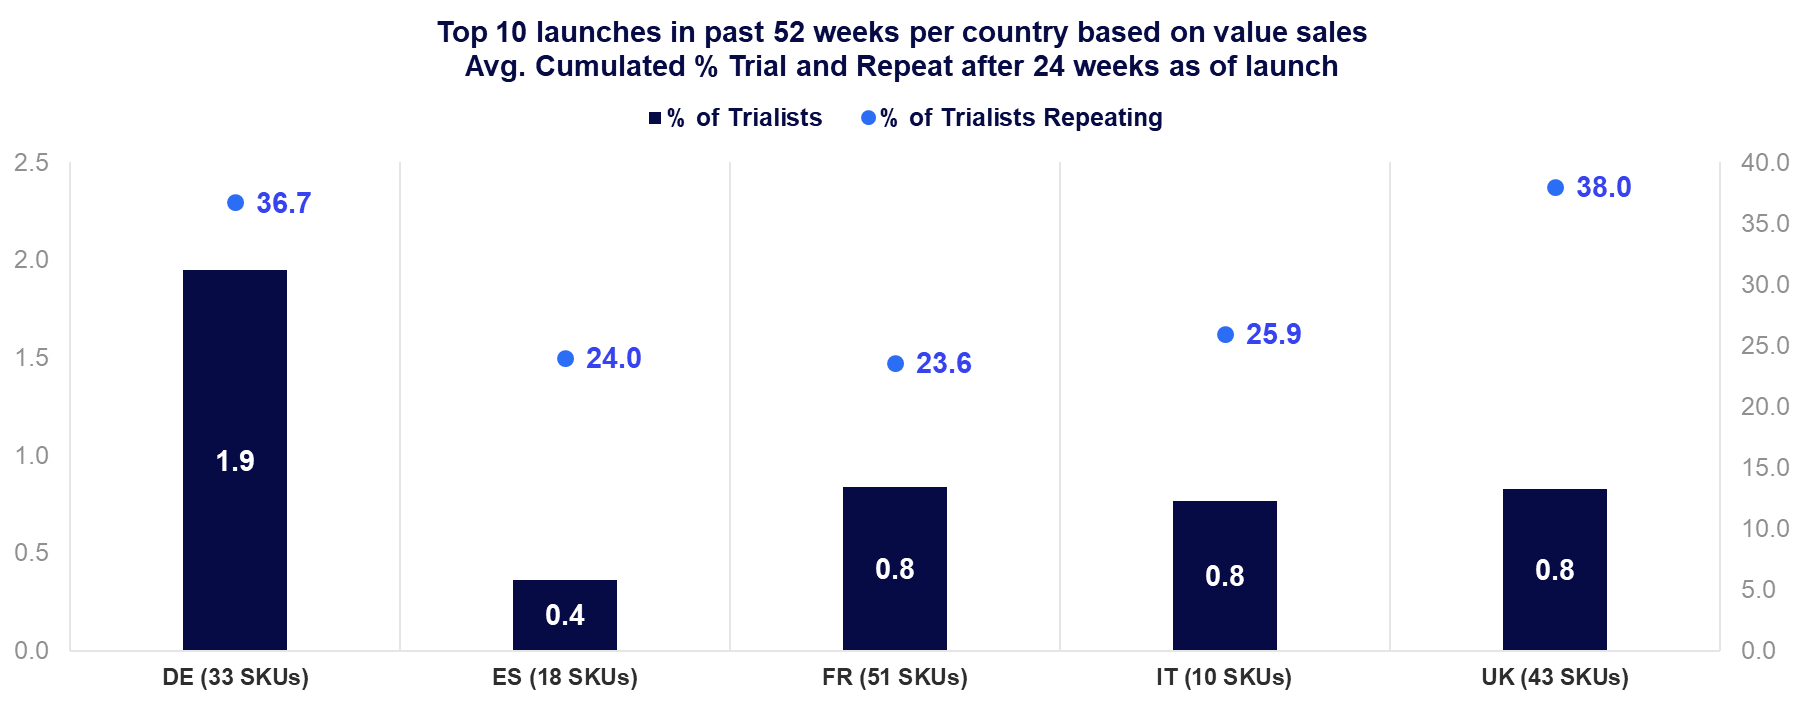
Source: : NIQ Homescan data ending 22nd February 2026. Top innovations cover New Brands/brand extensions and New Sub-brands, that launched in the past 52 weeks
Ranking is based on past year value sales within each country.
5 top Non-Alc. Beverages launches in each WE country
(ranking based on value sales and in descending order)
Source: NIQ Homescan data ending 22nd February 2026. Top innovations cover New Brands/brand extensions and New Sub-brands, that launched in the past 52 weeks. Ranking is based on past year value sales within each country

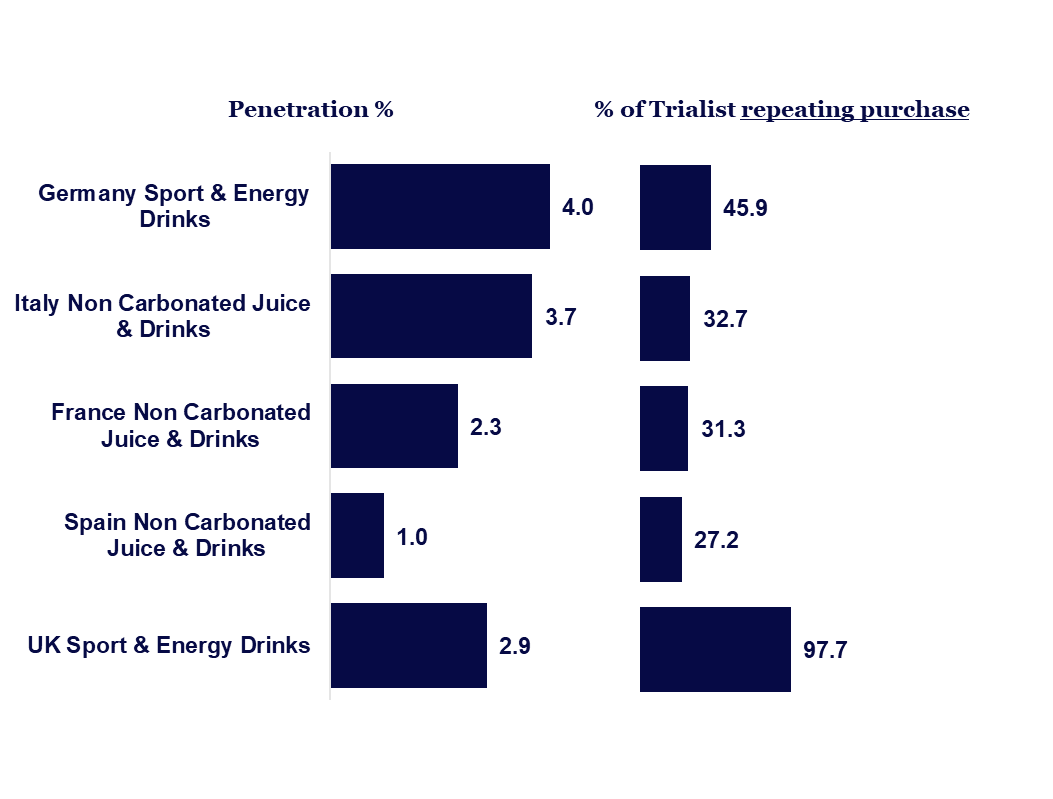
UK top innovation stands out, with almost 100% repeaters
Highest selling innovations are the ones that excel also in building and retaining penetration. Still, in Spain there is an opportunity to evaluate low repeat rates.
While in Italy ¼ of trialists returned to purchase Sport & Energy Drink innovation, in Spain repeaters were less than a fifth of the trialists – for the exact same product.
Italy Sports & Energy Drink
#4 in sales (772k)
#4 in penetration (0.4%)
#3 in repeat rate (26.6%)
Spain Sports & Energy Drink
#2 in sales (862k)
#3 in penetration (0.5%)
#2 in repeat rate (17.8%)
Want to get a more in-depth view of our Innovation Barometer data?