Why do we need to track consumers across all channels and devices? Why can’t we just track their behaviour on one device, for example?
Well, the answer is that we can, but then we’d be getting a false view of their real behaviour. We’d only see one aspect of how, where and why they are interacting with your own, or your competitors’, promotional content, products or services.
A typical customer journey usually involves many stages from discovery to purchase, using many different touchpoints across multiple devices. Unless we analyse all of those data traces, we will not get a truly accurate single consumer view.
The challenge is to think ‘cross-media’ right from the start, and to break up silos by using digital as the connector.
Recent cross-media trends from 8 countries:
We run regular research looking at device use and online behaviour in 15 countries. This is passively collected behavioural data, which creates a valuable and easy-to-use round-up of the cross-media metrics that matter.
In this blog, we’ll share some top trends from eight very different markets: Germany, Mexico, UK, Poland, Russia, Indonesia, Brazil and Netherlands.
4 cross-media trends from our full report
1. Multi device is the norm
What is abundantly clear is that tracking data from single device use cannot provide a full enough picture to be reliable or truly useable. While we track the use of smartphones, tablets and PCs, it is interesting to see how these devices are used in combination. For example, how many smartphone users also use tablet and/or PC?
Singular device usage still exists, but nearly three quarters of the online population in the eight markets we have analysed use at least two or more devices
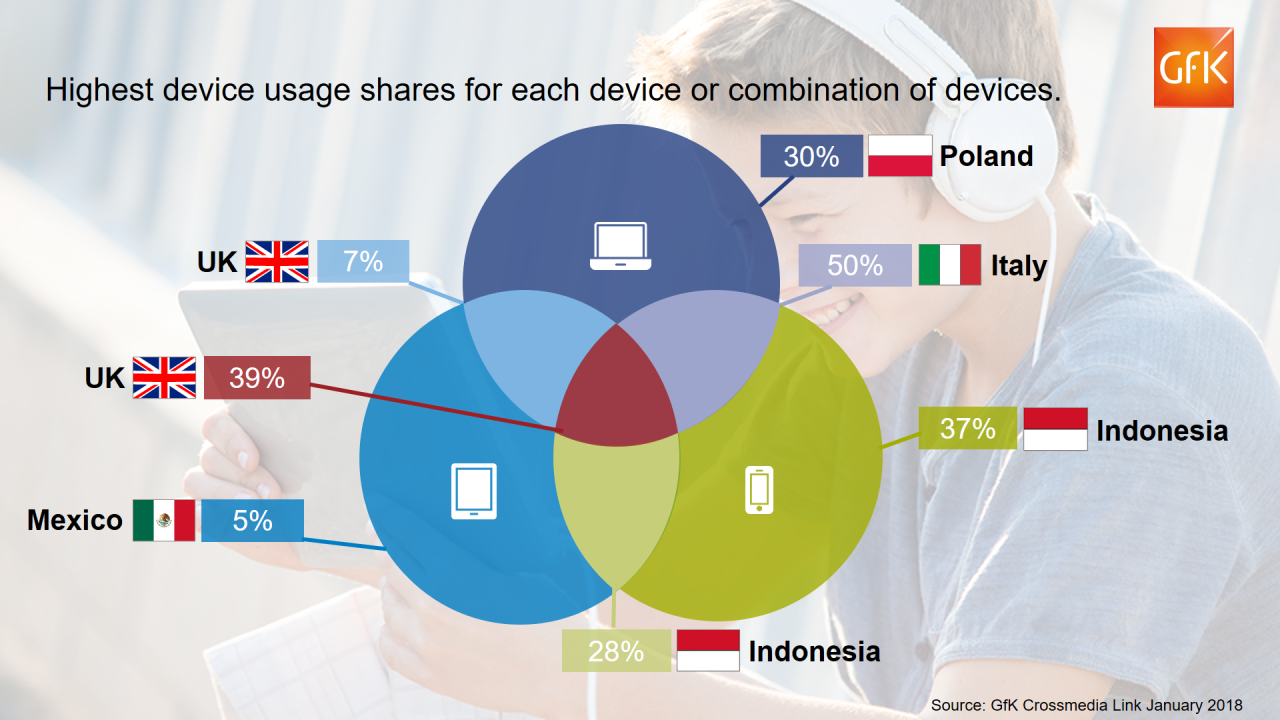
There is a higher percentage of single device use in some emerging markets. For example, in Indonesia, almost 4 in 10 (37%) of the online population use smartphone only. This is largely due to limited availability of fast landline internet, so that desktops and PCs have not penetrated the market in the same way as in Europe. The price decrease for smartphones and cheap data has been much faster than investments in landline infrastructure. Not only is a high share of mobile usage for smartphones, but also smartphones and tablets – 28% of the online population in Indonesia use these two devices combined.
In addition, Poland stands out as having the highest percentage of PC-only users (30%) compared to the on other markets.
However, in a developed market such as the UK, nearly 4 in 10 (39%) of the online population use smartphone, PC and tablet, while only 7% use tablet and PC. In Italy, half the online population use both PCs and smartphones.

2. Most popular online activities – by country, and by device
Based on net reach, the top activity that people perform across all devices (PCs, smartphones and tablets) is reading news or information, or accessing search sites.
The exceptions for this are Indonesia, where shopping is the top activity across all devices, and Brazil, where communication is most popular. In Brazil, communication apps are particularly popular for messaging and emailing.
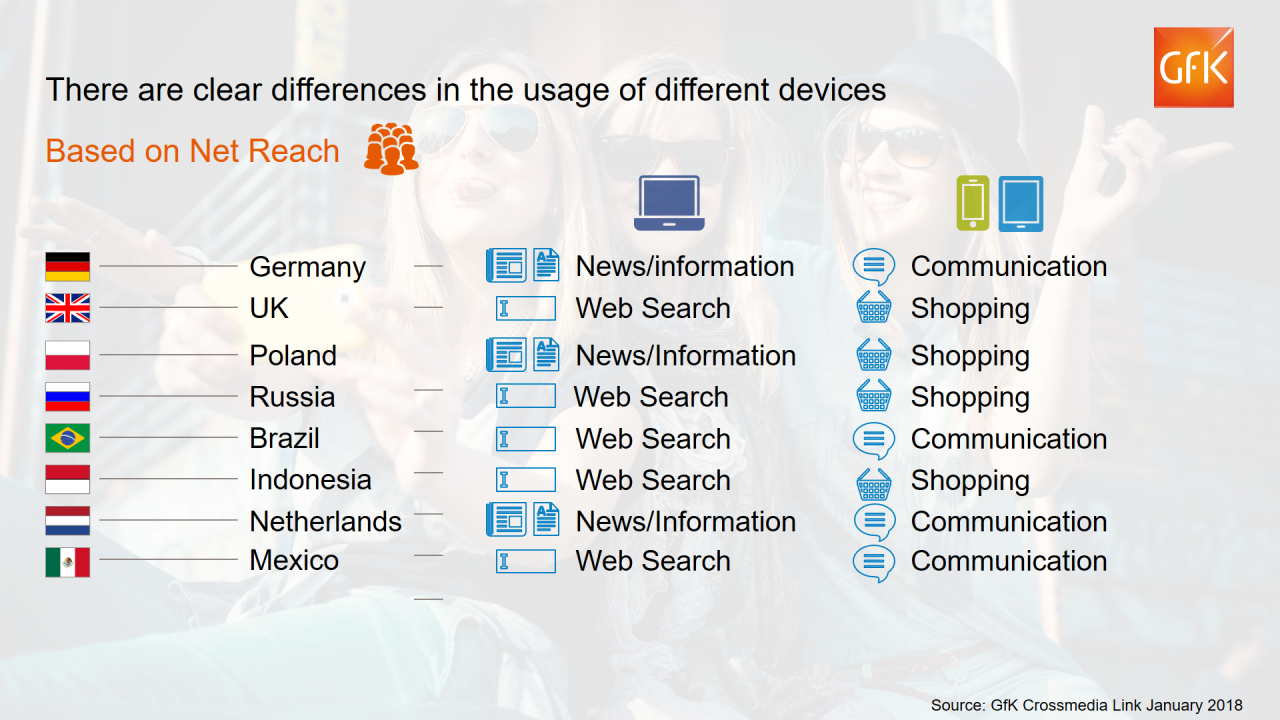
When we view devices separately, there is clear division in use between PCs and mobile devices. People are using PCs for reading news or information and performing web searches, and using their tablet or smartphone for communication and shopping.
A key takeout here is that shopping is the top activity on mobile devices in four out of the eight countries, highlighting the importance of mobile advertising for eCommerce and in-store shopping in these markets. This prevalence of mobile highlights the importance of mobile-enabled webpages and apps with good UX to support eCommerce.

3. Looking at duration shows key differences between countries
Looking at duration of activity (average hours per month, per user) for each category, we see that social networking and communication are the top ranked categories in terms of time spent across all three devices. However, there is a lot of variation between the different countries.
For example, ‘communication’ is the top activity on mobile devices in both Indonesia and Germany. But in Indonesia, the duration is 27 hours – compared to 16.4 hours in Germany. And people in Mexico spend more than twice as much time on social networking as people in Poland (30.3 hours compared to 14.6 hours, respectively).
By looking at duration, we also see that, while we are all addicted to our smartphones, this is especially true in certain countries. In Poland, the average online user spends 34 hour per month on their smartphone – but in Netherlands this rises to nearly double that, at 64 hours per month.
4. Most-used websites and apps (based on reach)
It’s probably no surprise to see that Google is the number one most-used website or app, based on reach, in seven of the eight countries presented in this blog.
The exception is Russia, where Yandex takes the top spot (Yandex is a similar platform to Google which includes Yandex Search, Yandex Mail, Yandex Maps, Yandex Images, Yandex News etc, and even includes a taxi app very similar to Uber).
Similarly, Facebook is the number one social network site, except for Russia where it is VKontakte (VK).
When it comes to streaming, however, the top site is the same across all eight countries: YouTube.
Achieving a single customer view
Integrating data from all sources in one platform allows us to connect the dots and gain a true picture of our consumers. Ultimately, data trails are generated by real people that leave data in many different silos. Digital is the connecter that helps open these silos as all the data traces are left in the digital world. By opening these silos and integrating data from different sources we can achieve that all important single customer view.
Pawel Gershkovich is a Global Senior Product Manager at GfK. To share your thoughts, please email pawel.gershkovich@gfk.com or leave a comment below.


