Powered by the newly enhanced breadth and depth of NIQ’s UK Homescan Panel
During September we saw consumer confidence continue to dip, 1 reflecting the broader mood of the nation. It stands to reason therefore that 50% of consumers separately stated they are severely or moderately affected by the cost of living crisis, which rises to 54% in terms of the expectation for things to get worse.2 One third of consumers then go on to claim that they look to make savings on their grocery bills,3 as shopping baskets remain one area where people can exert a degree of financial control. It is more crucial than ever for grocery retailers and manufacturers to understand the nature of this change to adapt and respond, but in doing so they must be careful not to jump to quick conclusions and misinterpret the meaning of this new mindset.
Headline aggregations are useful but also fuel assumptions. To diagnose and respond in the right way, it is important to understand the detail. NIQ’s recently expanded 30,000-strong Household Consumer Panel is designed to do just this. With more participants, we can track more shopping trips, in a greater variety of places, capturing more products. Combining this with validation from our Retailer Measurement Sales data means we are better placed than ever to advise our clients on the shifting grocery landscape.
The changing nature of how consumers shop
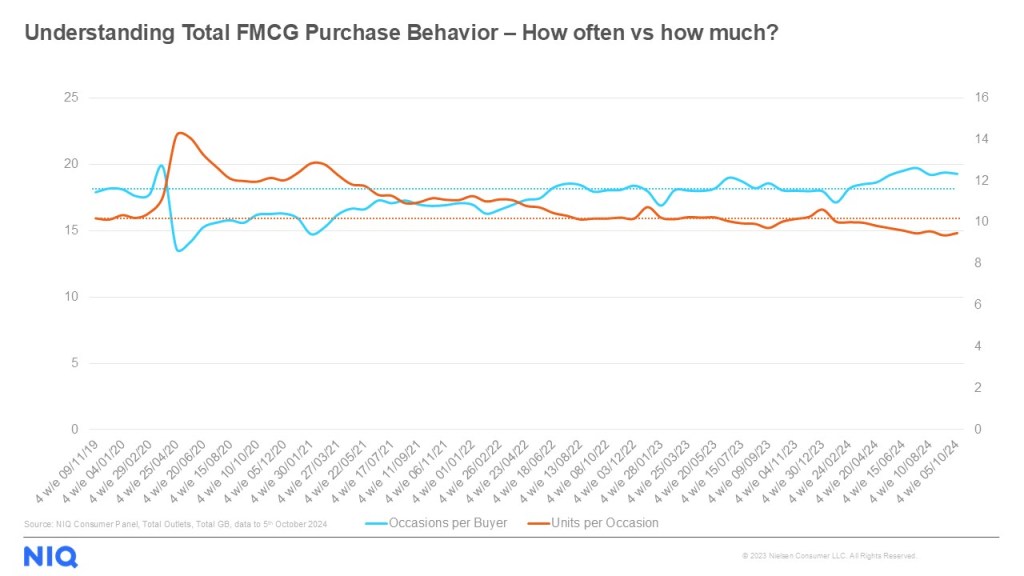
For this study we have reviewed five years of data to the week ending 5th October 2024, while over the last two years, FMCG value sales have grown by +14%. During this same period, units per shopper have stayed relatively flat, but the composition within has altered. A +7% increase in the frequency of shopping has been accompanied by an almost equal rate of reduction in how many units are purchased per trip. This means it is almost entirely the +14% rise (+25p) in average price per unit that has driven headline value sales.4
Understanding the rate of change across these metrics and how they relate to each other allows us to draw initial conclusions. Higher prices drive consumers to buy less each time they shop as they look to manage immediate basket spend. But without altering overall volume needs, they must shop more often to accommodate. This coping mechanism does not prevent the impact of higher prices, instead, it spreads the full impact over a longer period. In other words, shoppers buy less to spend only a little more each trip and they do this more often to prevent exposure to the full impact of higher prices every time they shop.
But is this behavior unprecedented? Are we over-stating coping mechanisms? In fact, much of what has happened over the last three years appears to be a post-COVID correction. However, over at least the last six months we have seen the frequency of FMCG shopping rise to a five-year high. Simultaneously, the amount of units bought per trip has fallen to a five-year low.5
We can interrogate further by understanding the nature of change across different types of consumers. Let’s look at life stage and affluence, given how much money you have, and how many people are in your home will impact your financial situation, and therefore the likelihood of potential coping response.
Repeating the above analysis allows us to quickly establish6:
- There is a consistent relationship between affluence and how often consumers shop. The least affluent people shop the most often. This trend is at a five-year high, and the differential compared to the most affluent is rising
- There is less difference across affluence groups in terms of trip size, as well as a more consistent relationship as all groups reduce at a similar rate
- As such we see a widening gap in terms of purchased volumes – a greater uptick in frequency drives more volume among the least affluent
- Average Price corresponds with affluence too, but again the gap stays consistent. The less affluent are not actively buying less expensively at an enhanced rate
- Therefore, for the first time in five years, the least affluent consumers are now the biggest spenders in Take Home UK FMCG
- Analysis using the additional lens of life stage further validates these findings. It reveals the gap between low and high-affluent families and how often they shop widens at an even faster rate. This is because low affluence plus household size drives the extent of the response.
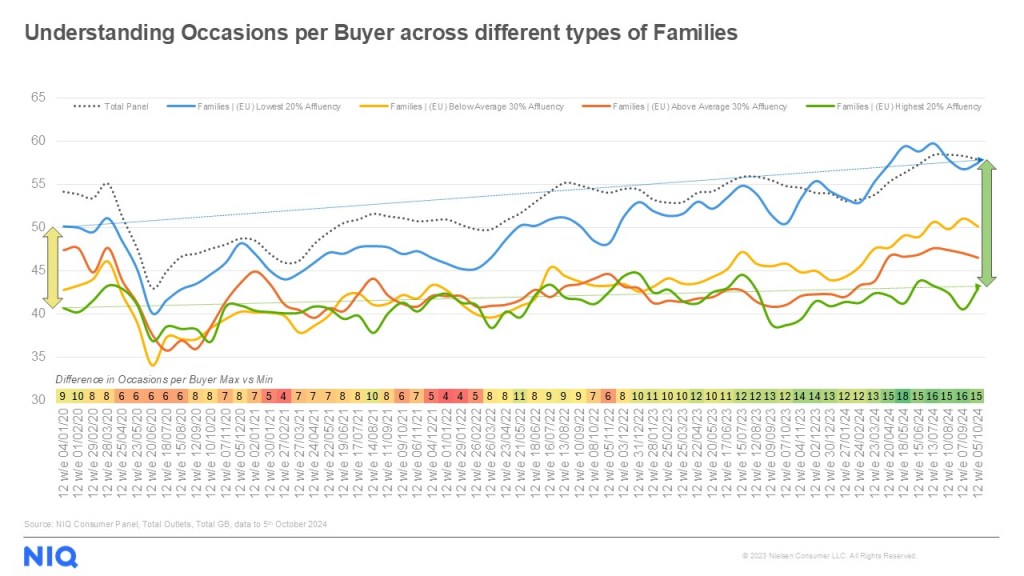
Thus in response to higher prices we see trip frequency increase and units per trip fall from a baseline dictated to by demographic and situation. The growth in frequency amongst the less affluent – and especially less affluent families – is far greater.
Without an equivalent rate of decrease in units per trip, or a slower rate of average price rise adoption, purchased units rise and the less affluent become the biggest spenders. At a time when we are seeing some initial green shoots of unit growth (+0.6% YTD vs YA)7, we must however consider the degree to which early recovery may in part be due to less affluent households consolidating more of their total food and drink expenditure within the home.
’Little and often‘ behaviors hold greater relevance for some, while the enhanced rate of adoption amongst the less affluent adds credence to the emergence of this coping mechanism. But how else have behaviors changed?
The changing nature of where consumers shop
NIQ Homescan reports sales across 49 retailer banners, and in the 12 weeks before the COVID pandemic, on average shoppers visited 7.8 banners. This fell to 6.4 in the height of lockdown, then took 2.5 years to return to pre-pandemic levels. However, since then we have seen shoppers consolidate their retailer repertoire.8
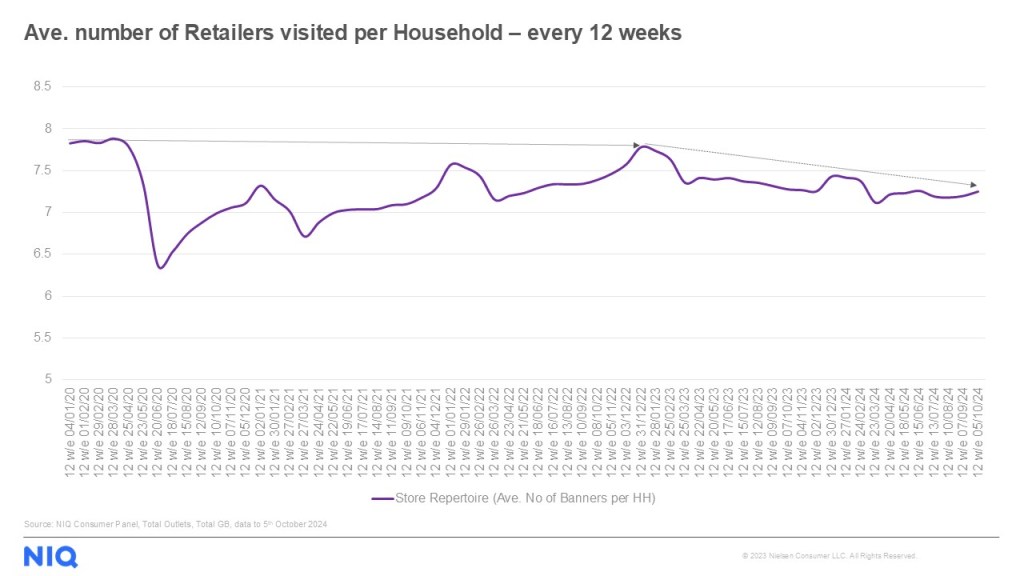
As we shop more often, there are more chances for retailers to win, though over the same period we see consolidation – we shop more often but across fewer stores.
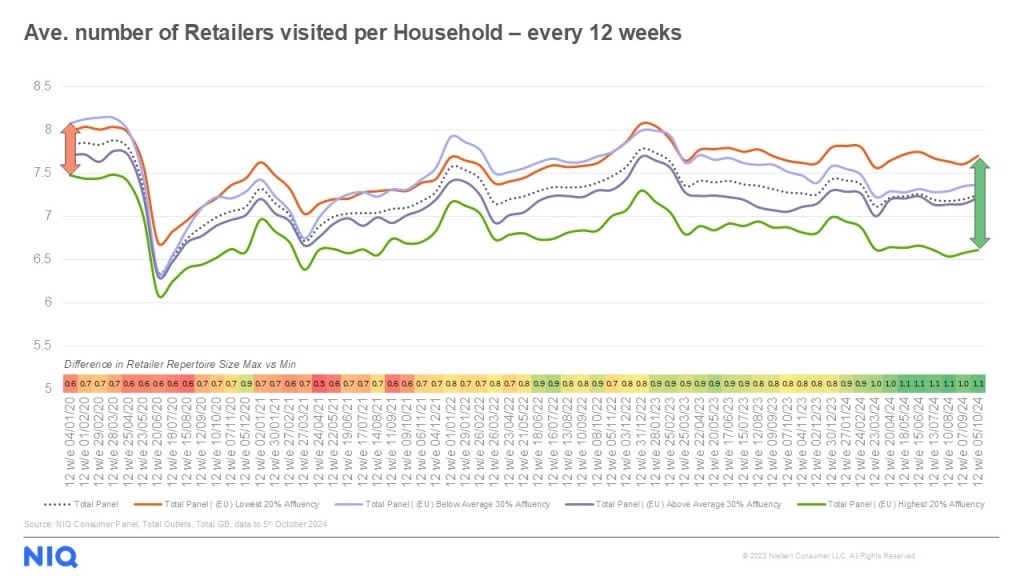
Lower affluence households and post-family groups have a larger repertoire, while higher affluence households and families are more selective. However, since repertoire size started to soften, the gap between the least and most affluent has grown, as those with less continue to shop around, a pattern played out across life stages.9
The changing nature of what consumers buy
FMCG can be categorized into broad areas of store (Super Categories – e.g. Fresh Foods), with discreet categories within (e.g. Dairy), made up of component sub-categories (e.g. Butter, Cheese, Milk), each of which can be sectorized (e.g. Block Cheese, Specialty Cheese, Snacking Cheese). At the lowest level of this hierarchy there are 1,075 options available to the shopper as part of a broader consideration set over any defined period, as well as this forming their potential trip repertoire each time they shop.
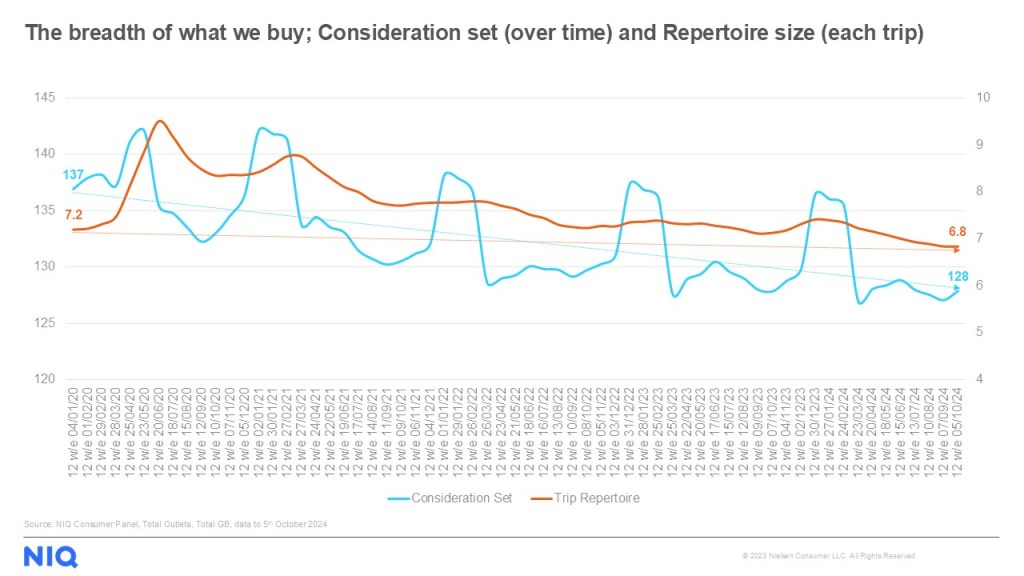
With the shock of COVID-19, both of these behavioral reads grew. At its height in June 2020, shoppers purchased 9.5 sectors each time they went shopping from a broader consideration set of 142 sectors over 12 weeks. As hinted at with our broader read of units purchased per trip, we have seen a decline in trip repertoire to a five- year historical low of 6.8. Although we would have expected the COVID-inflated consideration set to revert, it has fallen to a five-year low (128) too, as we see a consolidation of purchasing.10
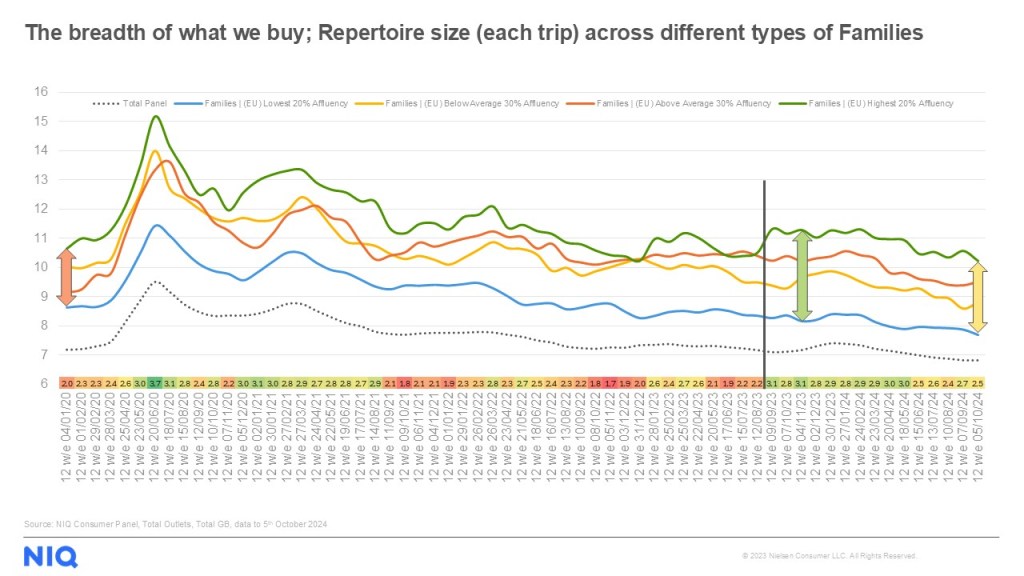
The number of people within the home dictates both consideration set and trip repertoire, requiring more variety in general and each time we shop. As such all families regardless of affluence have a bigger consideration set comparatively, but with notably little difference between high and low affluence families. It is among families where we also see the biggest rate of reduction of consideration set, including amongst high affluence families albeit at a slower rate. Families have a larger trip repertoire too, but within lies more significant differences across affluence levels while over the last twelve months to October within this trend for streamlining, a steady gap has emerged as greater consolidation takes place where financial pressures are strongest.11
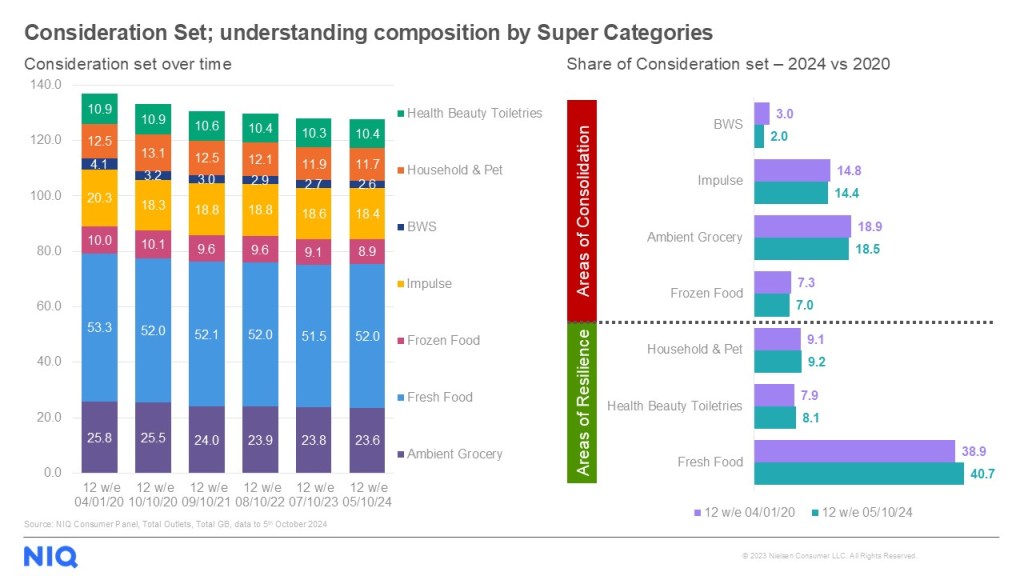
So in which areas have shoppers rationalized? Fresh Foods, Household and Health/Beauty/Personal Care have been the most resilient, while Ambient Grocery sees the most absolute cuts, Beer/Wine/Spirits contribute the most to losses, and Impulse and Frozen see an above-average rate of decline.12
Both push and pull factors underly these movements. Cutting back on indulgences or higher priced non-essentials versus retaining core staples, while a move to more frequent shopping lends itself to smaller store formats with a bias to Fresh. Additionally, while 71% of shoppers claim to cook from scratch at least three to four times per week (+1pt vs YA),13 with the dual benefit of this being cheaper and healthier, Fresh resilience stands to reason, given its broader affiliation with scratch cooking.
Looking beyond the average
For retailers, knowing that affluent shoppers have a more selective nature means that retaining their loyalty at a time of consolidation is crucial. At the other end of the spectrum, value orientation will always appeal. The breadth of the offer in meeting these needs becomes even more important as these shoppers are likely to be looking elsewhere, so priority must fall on driving basket size with enhanced creativity in the light of the trend to shopping ‘little and often’.
Winning in Fresh alongside Household essentials will remain key. For brands outside these areas, justifying the category role within the consideration set takes on a new importance. Winning at the moment of purchase becomes even more critical in the context of the narrowing and consolidation we have observed.
Establishing headline movements indicates the bigger picture and direction of travel, but the ability to respond and take action relies on having a more granular understanding. With consumers shopping more often to spend less, rationalizing what they buy in general and each time they shop and in deciding where to shop, understanding the impact on a brand, category and retailer is more important than ever. This is where the depth of research available in NIQ’s newly expanded Consumer Panel is invaluable.
Shape your strategies with a 360-degree view of your shoppers
We know that there is no one simple answer to every question. Tell us what your unique situation and needs are, and we’ll work with you to find a solution that makes your life easier.
Sources:
[1] GfK Consumer Confidence September 2024;
[2] NIQ Consumer Panel Survey October 2024
[3] NIQ Consumer Panel Survey October 2024
[4] NIQ Consumer Panel FMCG data 52we 5th October 2024 vs 52we 8th October 2022
[5] NIQ Consumer Panel FMCG data 4we 9th November 2019 to 4we 5th October 2024
[6] NIQ Consumer Panel FMCG data12we 4th January 2020 to 12we 5th October 2024
[7] NielsenIQ Scantrack | Total Coverage | Total Store | YTD 2024 WE051024
[8] NIQ Consumer Panel FMCG data12we 4th January 2020 to 12we 5th October 2024
[9] NIQ Consumer Panel FMCG data12we 4th January 2020 to 12we 5th October 2024
[10] NIQ Consumer Panel FMCG data12we 4th January 2020 to 12we 5th October 2024
[11] NIQ Consumer Panel FMCG data12we 4th January 2020 to 12we 5th October 2024
[12] NIQ Consumer Panel FMCG data12we 4th January 2020 to 12we 5th October 2024
[13] NIQ Consumer Panel Survey November 2023


