How Americans will celebrate Thanksgiving in 2022
Consumers plan to stay local and small this Thanksgiving
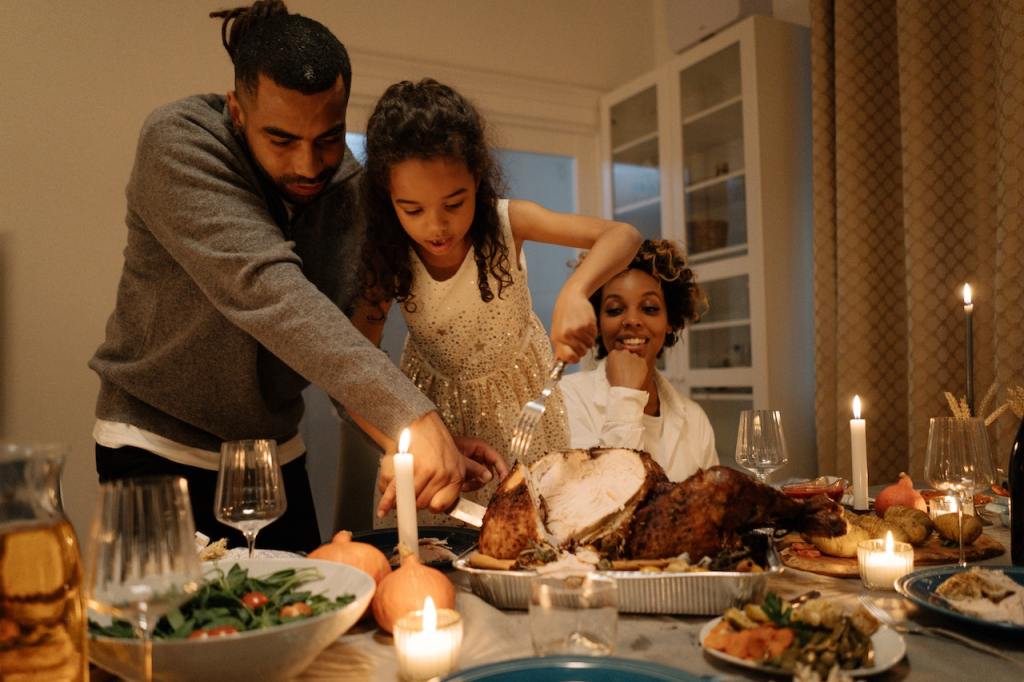
In a recent NielsenIQ survey, 91% of consumers indicated they are planning on celebrating U.S. Thanksgiving this year with a majority (83%) either staying at home (59%) or local (24%) (within 50 miles of their home).
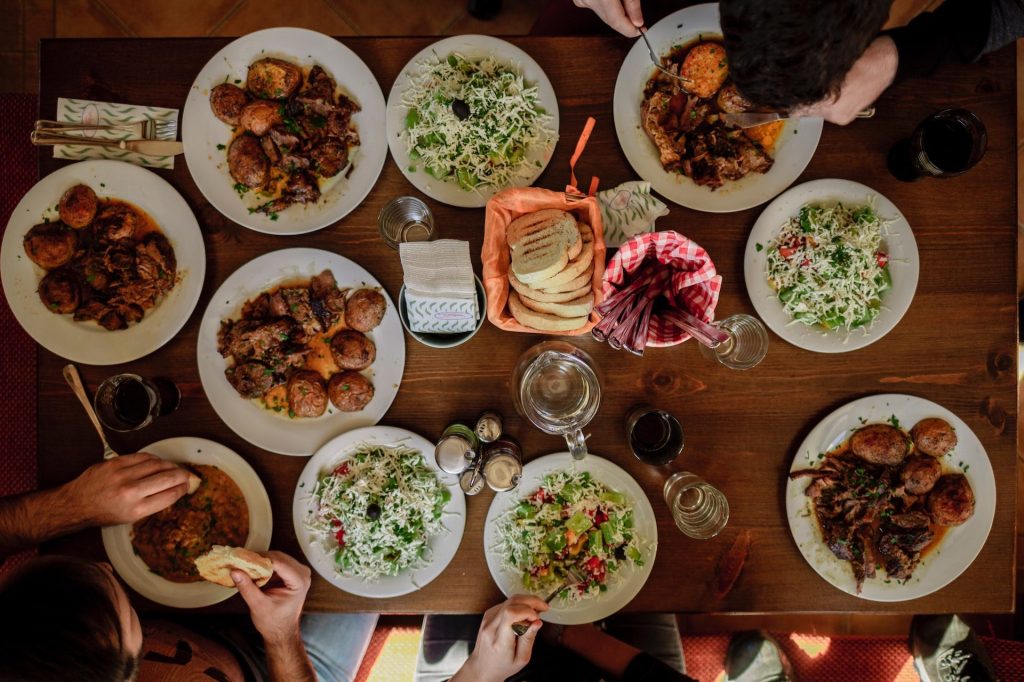
More than 50% of consumers surveyed noted that their gathering size range will be less than 10 people.
Consumers are putting comfort first.
During this year’s Thanksgiving celebration, 24% of respondents indicated they planned to dress up, while the remaining 76% plan to put their comfort first, wearing adjustable pants or sweatpants.
How consumers are budgeting this year
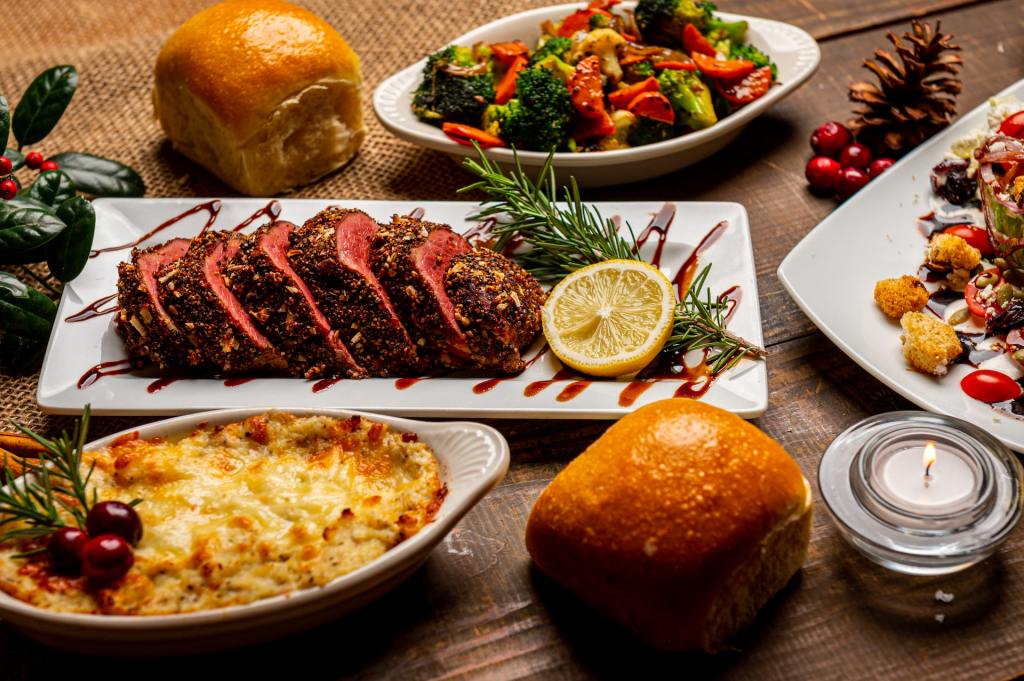
- 41% of consumers surveyed expect to spend more on this year’s Thanksgiving meal than last year.
- Close to 75% of consumers surveyed plan on spending under $200 on this year’s Thanksgiving meal.
- 1 in 4 noted that they are planning on spending within the range of $50–$75.
- 68% of consumers surveyed will be adjusting their Thanksgiving spending as prices continue to rise.
Meal cost-saving strategies
38%
Stated they would consider buying a smaller turkey
38%
Stated they would have a smaller gathering
37%
Stated they would buy less prepared items and make more items from scratch
36%
Stated they would have less side dishes
35%
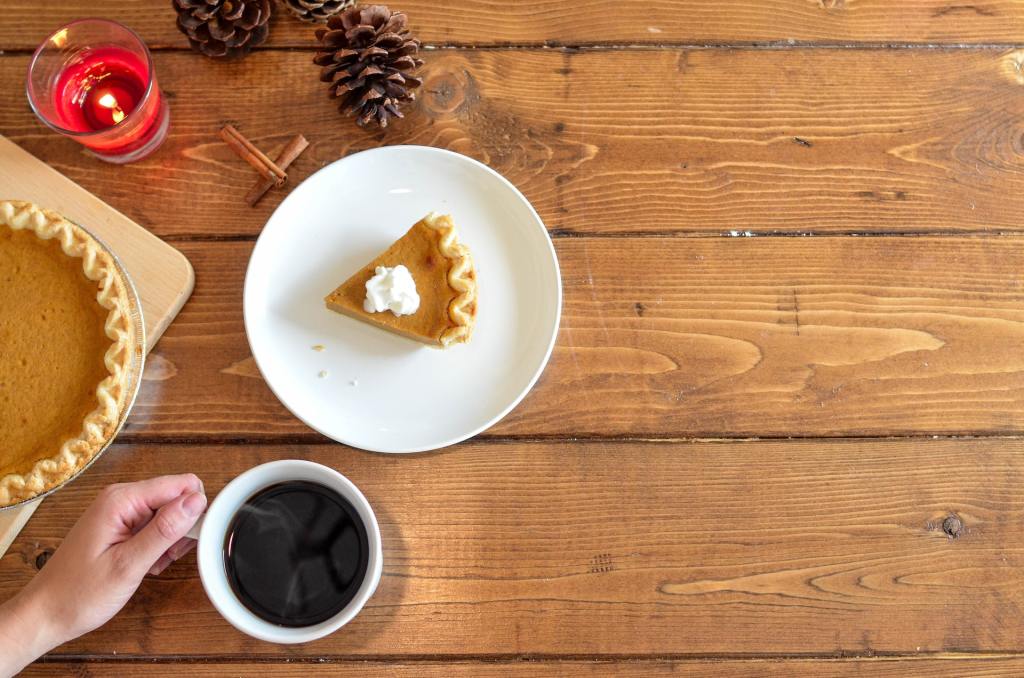
Stated they would have less dessert options
27%

Stated they would cut out alcohol
27%

Stated they would buy more canned or frozen vegetables
20%
Stated they would buy fewer fresh vegetables
13%
Stated they would eat at a restaurant

Global Holiday Hub
See how shoppers plan to spend around the holidays—from online shopping events to in-person celebrations—with NielsenIQ’s Global Holiday Hub.