Know when to hold ‘em, know when to fold ‘em
If you’ve ever pulled up a chair at a blackjack table, you may notice how the players around you approach the game differently. Some gamblers seem to signal for cards at random, enjoying the luck of the draw as if they were pulling levers at a slot machine. But experienced players know that no matter what hand they’re dealt, the right gameplay strategies greatly increase their chances of winning. They apply foundational blackjack strategies that give them the best odds of getting close to 21 without going over.
For manufacturers, reaching innovation vitality might feel like a gamble — but armed with the right insights and strategies, it’s more achievable than you might think.

Why innovation “vitality” instead of “success”?
Innovation vitality = business vitality
Innovation is the lifeblood of business growth. Manufacturers who grew innovation sales in 2022 were 1.8x more likely to grow overall sales compared to those with stagnant or declining innovation sales.
That’s because thoughtful innovation creates engagement with consumers and retailers. It’s a way to build relationships and address needs, whether it’s delighting consumers with a new flavor profile or launching a crowd pleaser that will fly off retailers’ shelves.
Brands don’t exist in a static world. Over time, core products can start losing buyers — see the “leaky bucket theory”— leading to sales declines. That’s where innovations come in. New and improved products can attract new buyers, create new usage occasions, justify a price increase, or simply keep your brand at the forefront of consumers’ minds. Year over year, your strong innovations become your core.
Innovation within reach
Despite the urban myth that 95% of all innovations fail, findings from NIQ’s Innovation Measurement database indicate that innovation vitality is not only possible, it’s worth the pursuit. After reviewing more than 60 thousand innovations across five countries over more than four years, we found that 52% of new items with national distribution show vitality, growing sales in their second year on the market.
Unsurprisingly, innovations with national-level distribution are more likely to grow. But distribution may or may not be the causal factor for growth. Typically, products with high distribution also have other advantages, for example, more funding and resources, or even brand clout, all of which can help support that growth.
Even so, vitality is still well within reach for innovations with limited distribution. When we lower the distribution threshold to include all new items, 31% show vitality. Both outcomes dispel the notion that innovations are destined for “failure” before they even get off the ground.
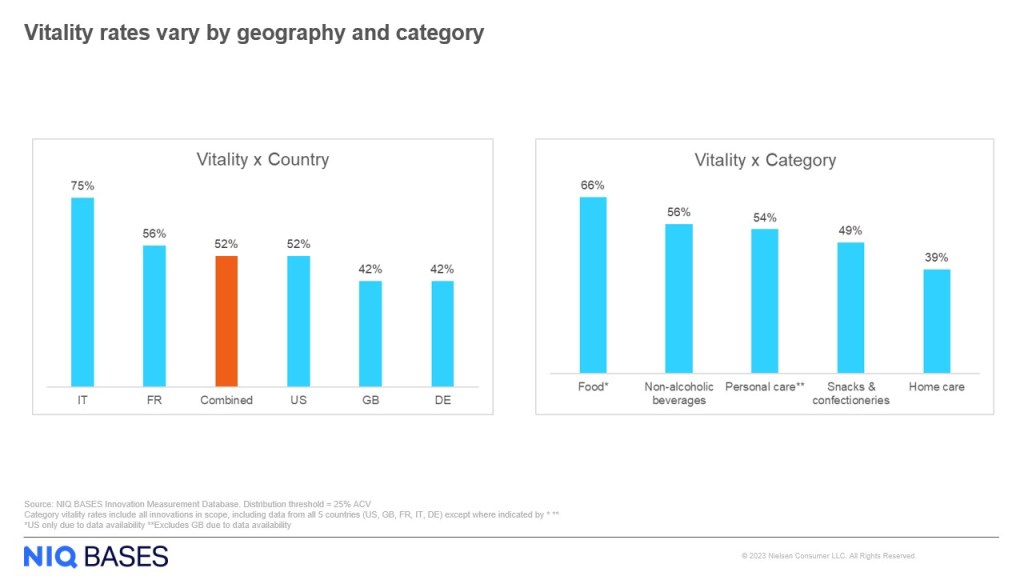
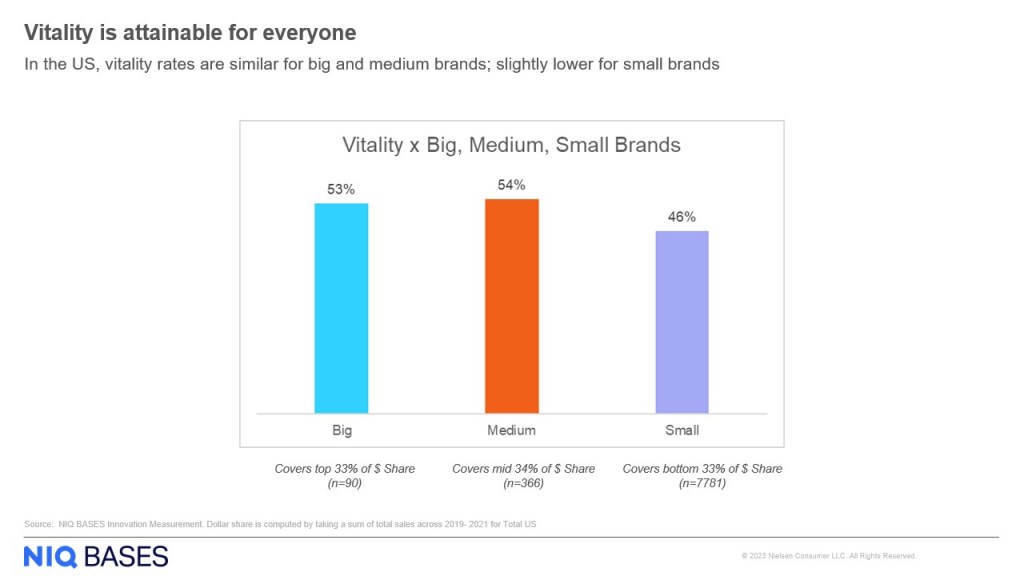
We also examined vitality rates across countries, categories and brands. Although there are differences, we consistently found that growth in the second year on the market is common across the board, and often it’s the more likely outcome — with some critical nuances. When we examined vitality rates by business size in the US, we found that big and medium businesses have similar vitality rates (53% and 54%, respectively), but small businesses have a good shot, too, with vitality rates at 46%.
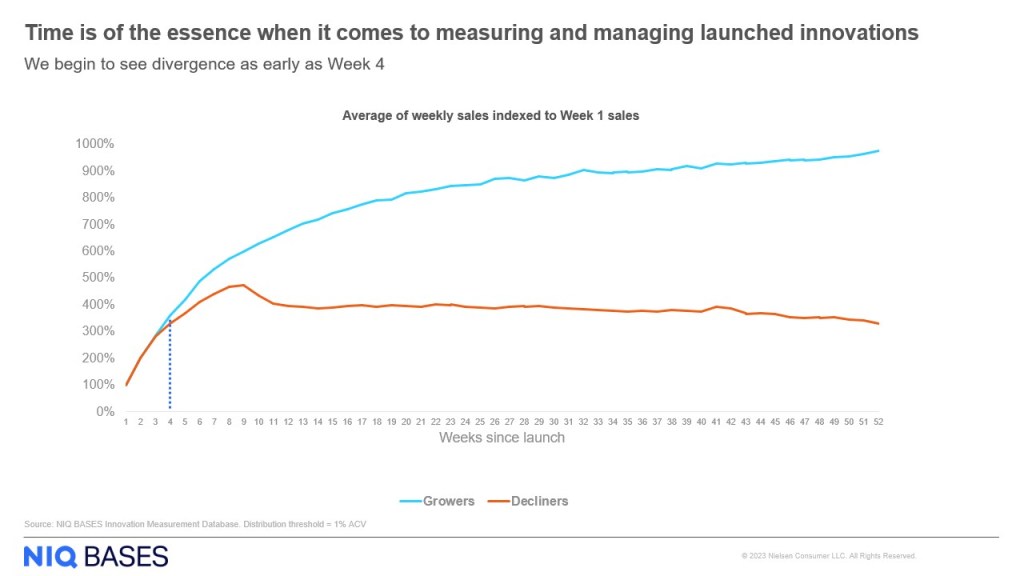
While the pursuit of vitality might feel more like a marathon than a sprint, that doesn’t mean you can start slow. Time is of the essence when it comes to measuring and managing launched innovations —even more than originally thought. Surprisingly, we begin to see divergence in growers and decliners as early as the fourth week in market. That means the window to monitor and optimize your innovation is very short. So how can you quickly seize this opportunity and increase your odds of achieving vitality?
Achieve innovation vitality
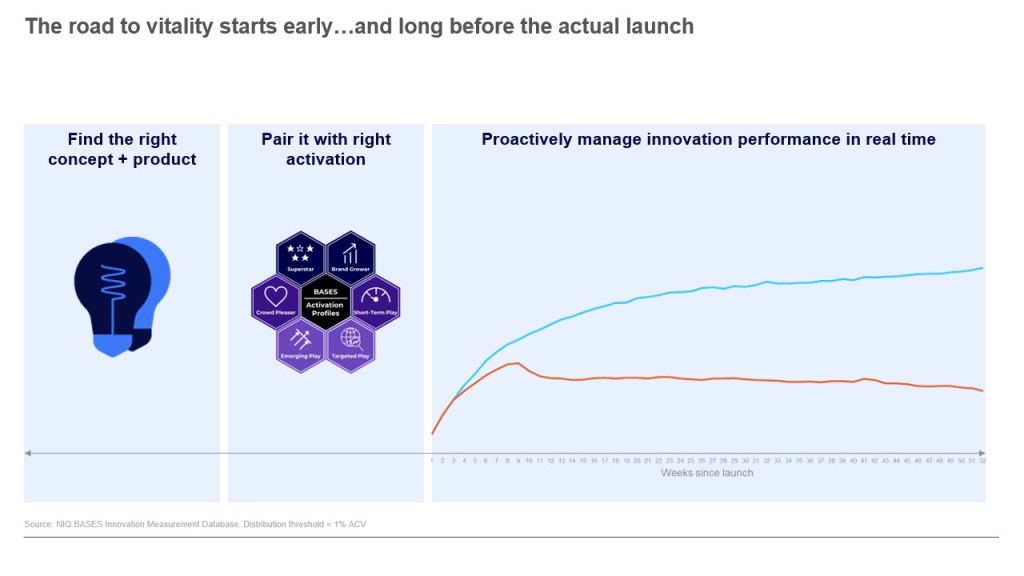
To ensure your innovations have the power to endure, get back to the fundamentals. Finding the right concept and product, pairing it with the right activation, and proactively managing innovation performance in real time will help you drive sustained growth.
Find the right concept + product
Don’t cut corners during pre-launch planning and early-stage concept testing. Instead, invest in a rigorous screening and validation process. Our research found that top innovators, on average, spend four more months in pre-market prep than low performers.
That’s because a solid concept begins with solid research. We’re living in a time with more access to data collecting tools and resources than ever before — many of which promise speed and low-cost results — but not all data is quality data. And more importantly, you don’t have to sacrifice quality for speed and cost-effectiveness. In the long run, sub-par data results in missed opportunities and wasted time and resources chasing concepts that don’t produce desired results.
In fact, we recently analyzed 91 concepts for a major CPG manufacturer who had previously utilized a DIY supplier’s concept pass system. In running these concepts through our BASES Activation Profiles solution, we found that 62% of their concepts were misclassified. It’s important that, however you begin your concept design and testing, you are leveraging valid, reliable data.
Learn more in our recent article series on data quality.
Data
Quality
Checklist
- Test–retest reliability
- Data consistency and sample quality controls
- Benchmarks and norms that account for overstatement differences
- Multiple fraud detection tools
Execute great activation
Don’t treat every innovation the same. While foundational principles still hold, there’s no one-size-fits-all approach. Execution may look different across categories, markets, and brand type and size. For instance, is this a Brand Grower that will bring new users to the brand, and therefore needs a broad reach of category buyers for advertising and distribution? Or is this a Targeted Play that requires a focused reach on core targets with advertising and distribution?
Support the right innovations in the right way by understanding your innovation opportunities based on strategic potential, evaluating tangible activation tactics and implications by looking at different pathways to success, and making better decisions using predictive analytics.
How you measure is key. Early and continuous monitoring of critical metrics that automatically refresh allows you to identify emerging trends and brands faster, make informed strategic investment and execution decisions by benchmarking innovation performance, and manage innovation performance post-launch in real time. Understanding the true potential of your innovations is crucial for success.
Activation Success Checklist
- Ensure your projections are realistic
- Confirm your innovation will grow vs. cannibalize your brand
- Know where you stand competitively in your category
- Understand which marketing levers to pull
- Look for learnings beyond launch
Proactively manage innovations in real time
Innovation is never a “launch and leave” project — the work doesn’t stop once you launch. Sustaining vitality requires ongoing monitoring and optimization. In our analysis, we observed critical milestones that have an impact on vitality.
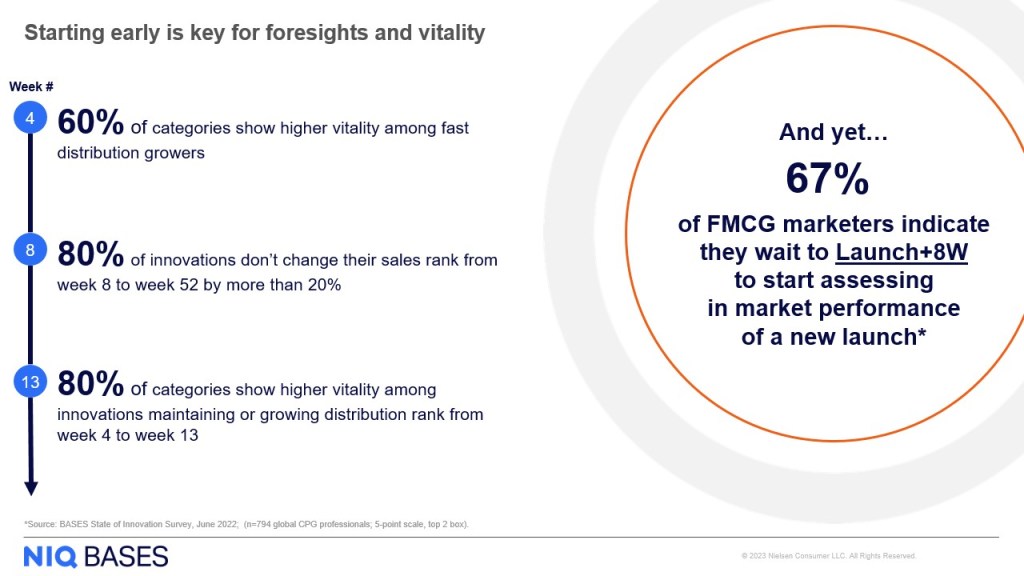
As we noted earlier, the first 4 weeks are critical to increase your odds of reaching vitality. Yet many FMCG marketers have admitted to waiting up to 8 weeks to begin assessing performance, which deprives them of the ability to course correct during a critical time. By week 4 of launch, 60% of categories show higher vitality among fast distribution growers. Whether your innovation is big or small, focus on your retailer story and value proposition to maximize your distribution opportunities.
This is particularly critical because 80% of innovations don’t change their sales rank from week 8 to week 52 by more than 20%, meaning that sales ranks at week 8 are indicative of where you’ll be at the end of the year. Not only should your distribution be on point from Day 1, your marketing support should be as well. If you’re not tracking where you want to be, start diagnosing where the softness is coming from. For example, if you have high-ranking distribution but low-ranking velocities, start assessing if your consumer message is landing. If you’re over-shooting your targets, start planning for increased production to avoid shortages.
We also found that 80% of categories show higher vitality among innovations maintaining or growing distribution rank from week 4 to week 13. It’s not only about growing distribution; we found that your distribution ranking in the category (i.e., your competitive position) is also a key indicator of vitality. If you’re not growing your distribution rank, you risk not meeting your year-end objective. At this point your options are either to find a way to drive more distribution and/or reassess sales projections.
Ultimately, your vitality increases if you launch big. But those odds are even greater if you grow or maintain your competitive position in the category through the first 13 weeks of launch.
Proactive Innovation Management Checklist
- Assess the state of innovation vs. total market
- Ascertain actions that maximize likelihood of growth
- Act early on learnings to maximize vitality
Innovate with purpose
Don’t gamble away your innovations. While your innovations aren’t doomed by default, manufacturers can greatly increase their odds of achieving and sustaining innovation vitality by finding the right concept and product, pairing it with the right activation, and proactively managing innovation performance in real time.

Do you know your innovation vitality rate?
Contact your BASES representative to see where you stand. Or, to learn more, download and watch our latest BASES Masterclass, The Innovator’s Guide to Vitality.


