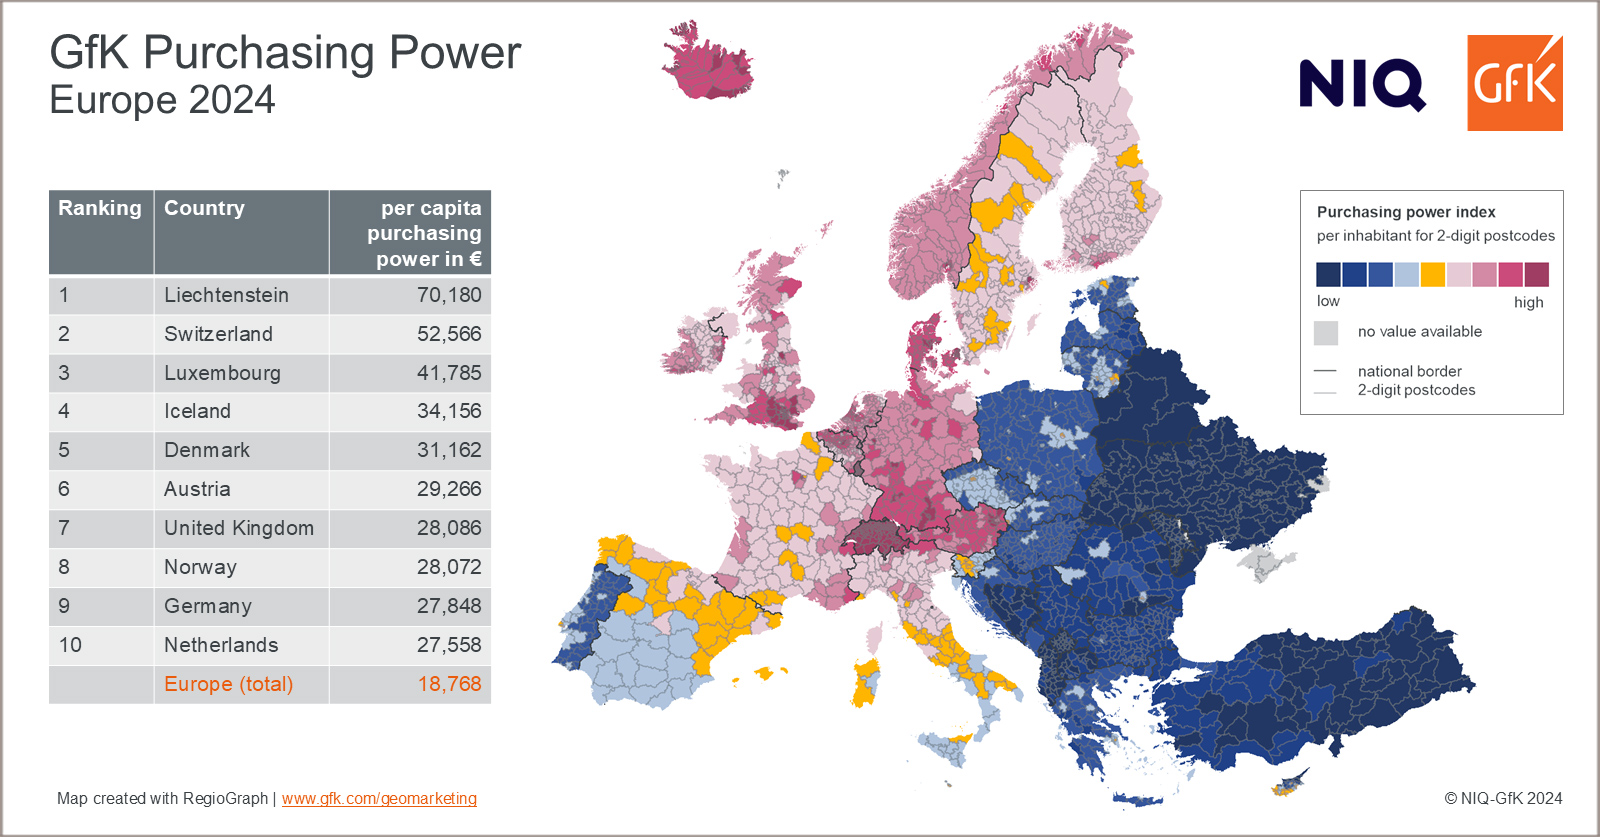
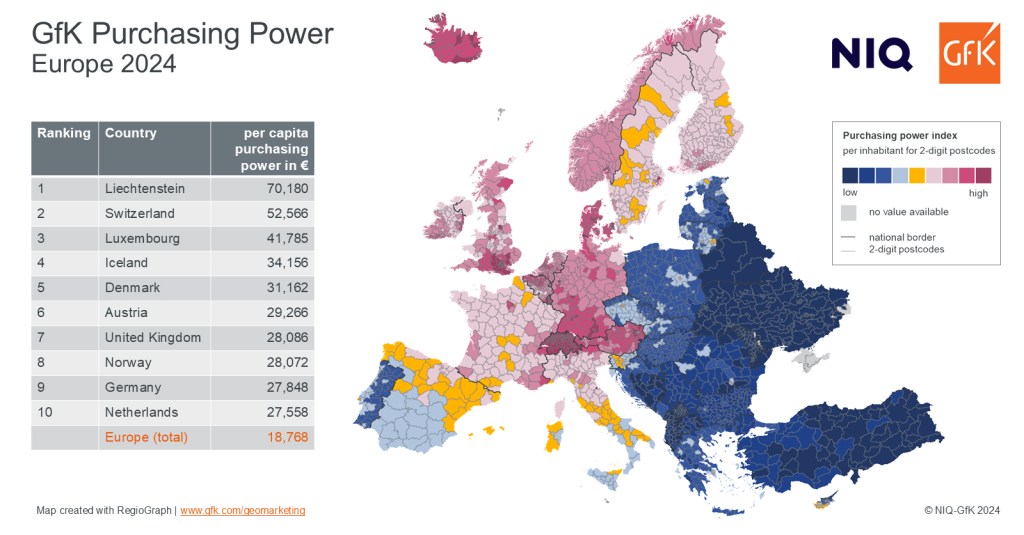
Our Geomarketing Map of the Month for October shows the regional distribution of purchasing power in Europe in 2024.
This year, the average per capita purchasing power in Europe rises to 18,768 euros. However, there are significant differences between the 42 countries: Liechtenstein is in first place with a spending potential of 70,180 euros per capita, while people in Switzerland and Luxembourg in second and third place still have 52,566 euros and 41,785 euros available for spending and saving. As in previous years, Ukraine brings up the rear. With a per capita purchasing power of 2,878 euros, Ukrainians are almost 85 percent below the European average.

Download the map in high-resolution JPG format…
GfK Purchasing Power 2024 is available for 42 European countries at detailed regional levels such as municipalities and postcodes, along with seamlessly fitting data on inhabitants and households as well as digital maps.
More results from our 2024 purchasing power study can be found in our recent press release from October 24, 2024.
The map may be freely distributed and reproduced if the following attribution is included: “Illustration: NIQ-GfK”.
Further insights into NIQ-GfK’s market data offering can be found here.


