
Map of the Month: NIQ Purchasing Power, Europe 2026
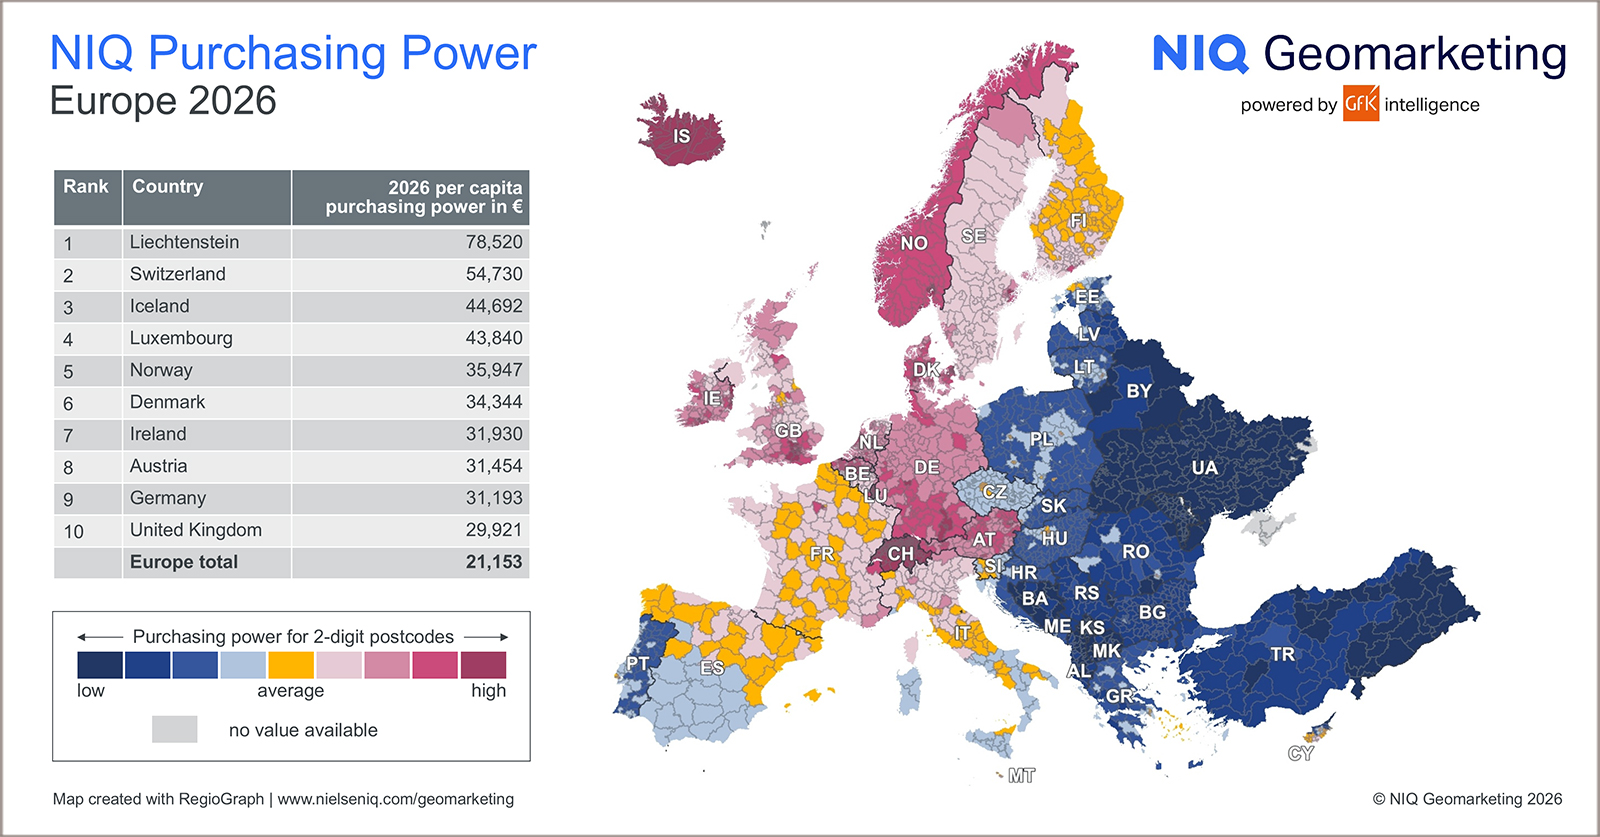
Our Geomarketing Map of the Month for October shows the regional distribution of purchasing power across Europe in 2026.
Average purchasing power in Europe increases by 4.4 percent to 21,153 euros per capita in 2026. At the same time, purchasing power levels across Europe continue to converge, with countries in Central and Southeastern Europe in particular recording above-average growth. Nevertheless, considerable differences remain among the 42 countries analyzed. Liechtenstein once again tops the ranking with a per capita purchasing power of 78,520 euros, followed by Switzerland with 54,730 euros and Iceland with 44,692 euros. At the lower end of the ranking, Ukraine remains in last place with a purchasing power of 3,456 euros per inhabitant.
Download the map in high-resolution JPG format…
NIQ Purchasing Power 2026 is available for 42 European countries at detailed geographic levels such as municipalities and postcodes, alongside complementary data on inhabitants and households as well as digital maps.
Further results on 2026 purchasing power in Europe can be found in our recent press release.
The map may be freely distributed and reproduced if the following attribution is included: “Illustration: NIQ Geomarketing”.
Further insights into NIQ Geomarketing’s market data offering can be found here.