
Map of the Month: NIQ Retail Purchasing Power, Europe 2025
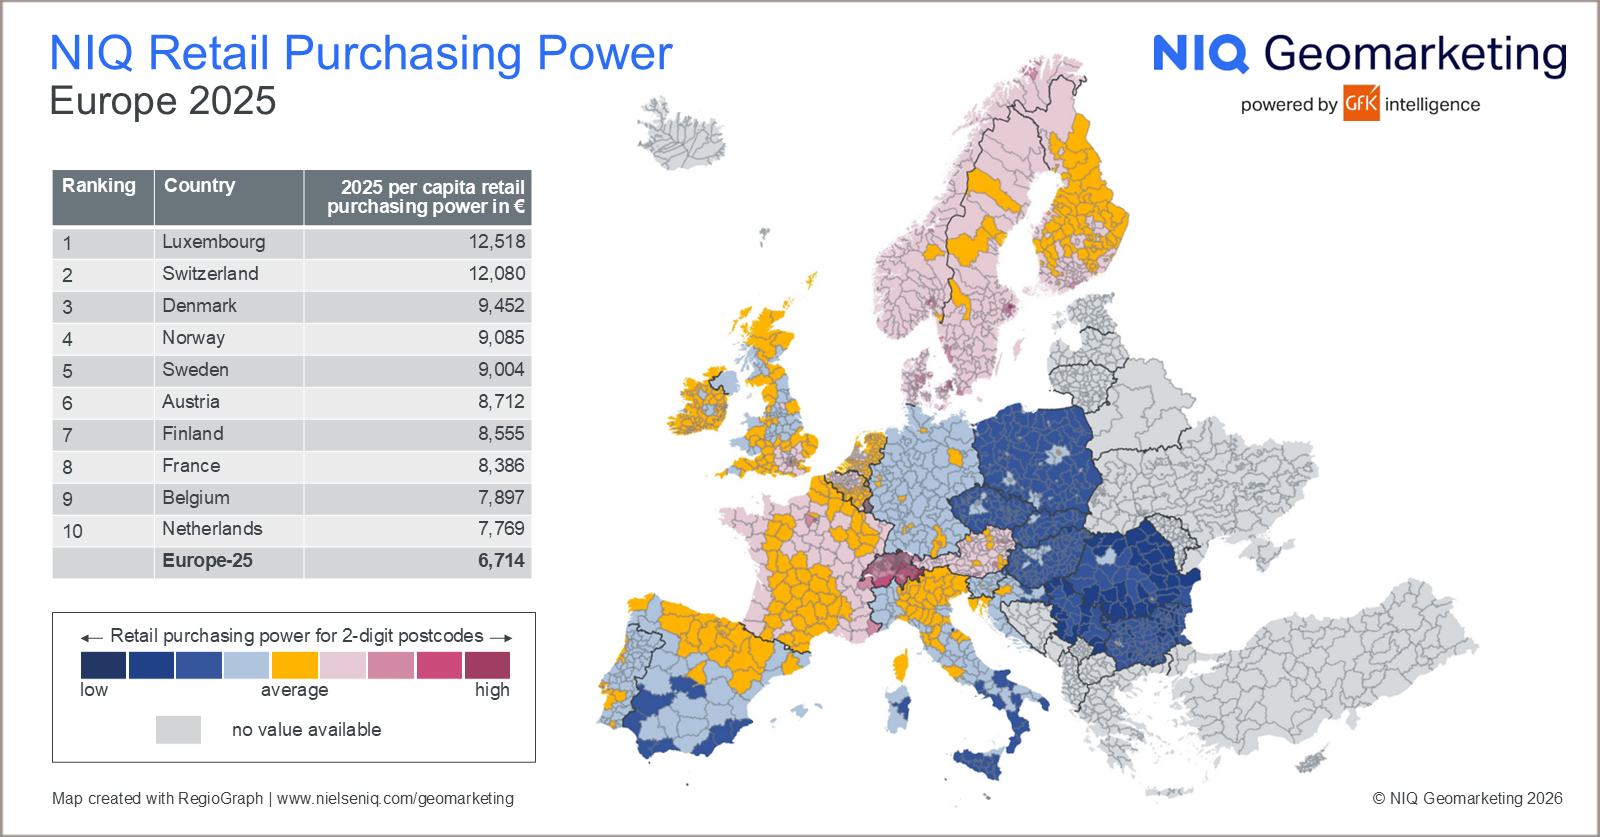
Our Geomarketing Map of the Month for June shows the regional distribution of retail purchasing power in Europe in 2025.
Retail-relevant purchasing power in Europe averages 6,714 euros per capita. However, the 25 European countries analyzed show significant differences in retail spending: At 12,518 euros per capita, Luxembourg residents spend the most in retail, followed by Switzerland (12,080 euros) and Denmark (9,452 euros). Serbia ranks last, where people spend an average of 3,849 euros per capita in retail.
Beyond national averages, purchasing power also varies considerably at the regional level. In many countries, capital cities and major metropolitan areas significantly outperform their surrounding regions. In France, for example, Paris reaches 12,944 euros per capita, while the neighboring Seine-Saint-Denis records only 6,314 euros – less than half the value of the capital.
Download the map in high-resolution JPG format…
Further insights on retail purchasing power in Europe can be found in our recent press release.
The map may be freely distributed and reproduced if the following attribution is included: “Illustration: NIQ Geomarketing”.
Further insights into NIQ Geomarketing’s market data offering can be found here.