
Pivoting to long-term growth with omnichannel strategy
Staying relevant during constant change
When, where, how frequently, and what assortment consumers buy have shifted significantly in recent years. To stay relevant with today’s consumers, businesses must approach planning with an omnichannel mindset to answer questions such as:
- Will online growth continue to accelerate or take a backseat to in-store growth?
- Are we measuring the total market, or are there blind spots we’re missing?
- Was our sales growth incremental, or was it driven by shifting customers?
- Are there new patterns in consumer spending we aren’t capturing and capitalizing on?
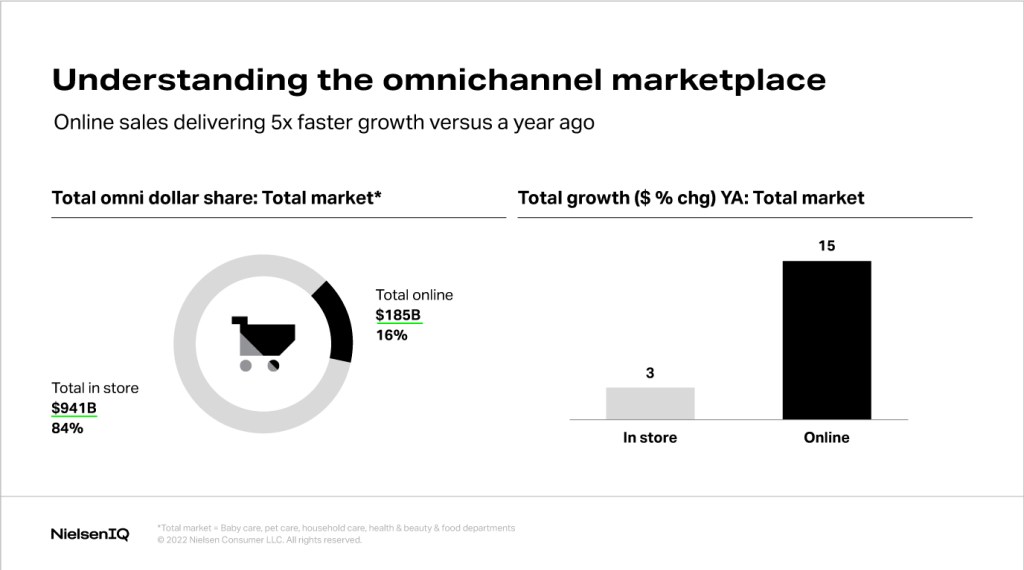
An evolving omnichannel marketplace
Online CPG sales are grew 15% over the last year. That’s five times faster than in-store sales growth. This marks a massive increase in omnishoppers—people who shop for CPG products both online and in-store. A few years ago, online growth was outpacing in-store growth in just a few categories, such as Health and Beauty. Now online sales growth is higher across all categories.
Omnichannel is new, with new aspects of consumer behavior to measure and new challenges. Most omnichannel analytics look similar to their in-store counterparts, but there are notable differences. In-store, brand visibility hinges on shelf placement: products must be at the right eye level on the right shelf in the right part of the store. Online, brand visibility is driven by search rankings for specific keywords. E-commerce measurement requires the same precision as in-store analytics.
There are three key pillars needed for strong, robust digital shelf monitoring:
- Census data: Data must be collected from and monitored in all stores, not just one store or a select sample.
- A category view: CPG businesses must have access to data for an entire category rather than a sample of SKUs. The category changes constantly—new products coming in, new products exiting—and knowing about these changes in a timely manner is critical. A category view also provides visibility on smaller brands. Although they are individually small, they have made their way into every category and should be monitored.
- 360 degree view: Seeing all the levers to activate in the digital shelf to achieve different results and win over competitors.
Optimizing decisions requires a full category view
A business can’t make effective or optimized decisions based on data measured from just one store. Data varies by store, even online. When a shopper types in their zip code, they are then directed to a store-specific website with store-specific inventories. Search results from two different stores will have different featured products, different pricing, and different promotions. Consequently, a shopper at one online store will not add the same product to their basket as a shopper at another store.
To be competitive in today’s evolving market, CPG retailers and manufacturers need a comprehensive view of all online and brick-and-mortar locations. However, it’s not enough to rely on in-house data; businesses also need a sightline into overall category performance to ensure they are keeping up with competitors as well as industry trends.
Case study: Pivoting to long-term growth
A shampoo brand, Brand A, within a large manufacturer wanted to check the effectiveness of its omnichannel strategy. It faced two significant problems:
- Inability to compare in-store and online sales to determine which channel was driving growth.
- A lack of competitive intel and inability to know if its growth was healthy or falling behind the category.
At the time, Brand A was basing decisions on sales data from just one online store. Partnering with NielsenIQ to leverage Omnisales data, the brand was able to gain a comprehensive look at the whole category to see which benchmarks signaled a winning—or losing— performance.
In the Shampoo category, 31% of sales were online and the remaining 69% were at brick-and-mortar locations. In-store sales showed 3% growth while online sales rose 11%.
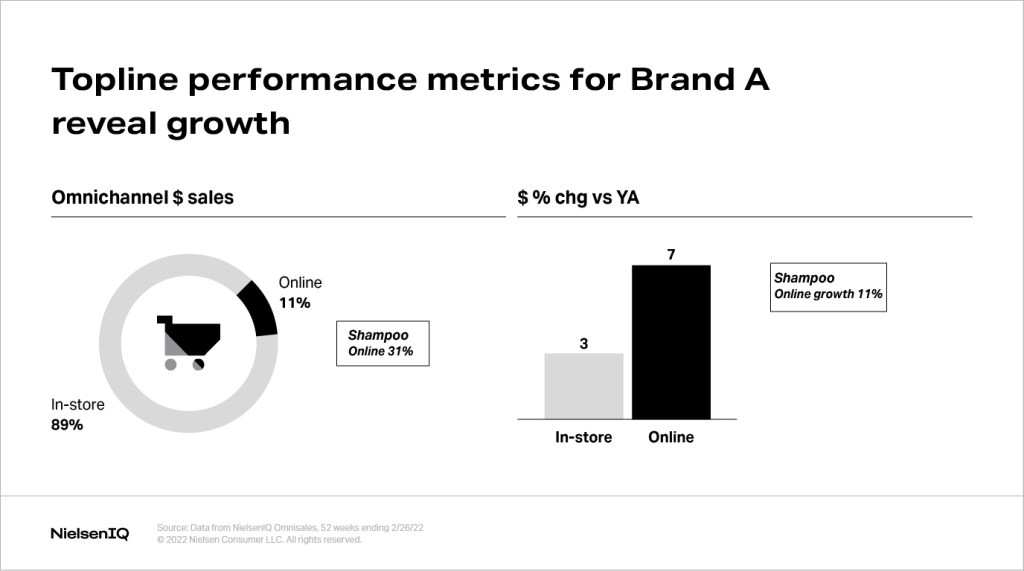
A review of Brand A’s performance (with the category’s growth in mind) immediately revealed an area of opportunity. Just 11% of Brand A’s sales took place online, while 31% of category sales occurred online. Brand A’s growth also fell short: its online growth was just 7%, lagging behind the category’s 11% growth.
Slower online growth had already caused Brand A to lose share in the category. The brand needed to take action as soon as possible to stop losing ground and return to growth.
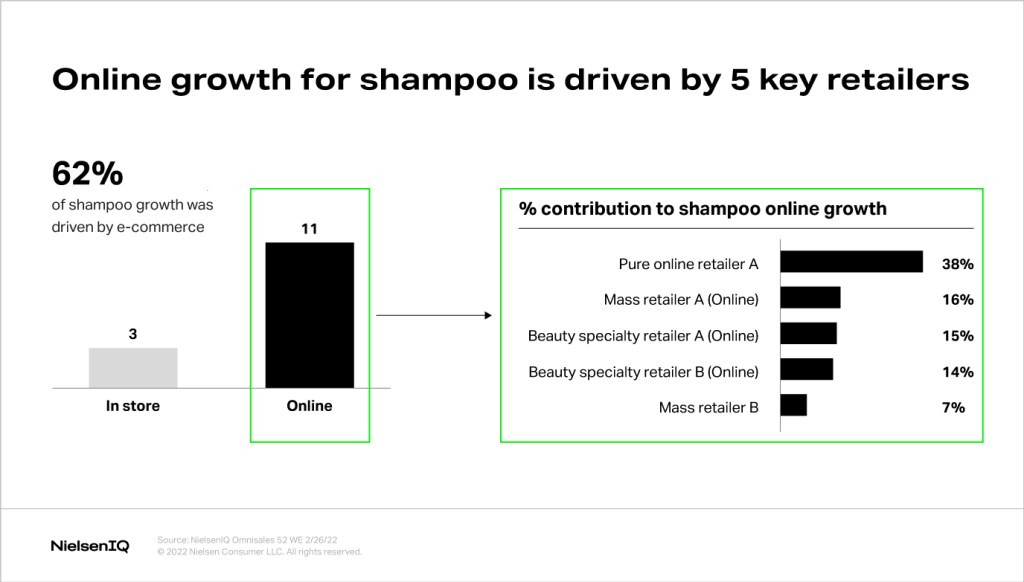
A deeper analysis of NielsenIQ Omnisales data showed that 62% of shampoo growth was driven by e-commerce, and 90% of that growth was driven by the dot comms of five key retailers. Seeing a detailed breakdown of the category let Brand A prioritize where to start pursuing higher growth and optimize online sales. In this case, Brand A opted to look more closely at its performance in the Pure Play Online retailer and Mass Retailer B.
Assortment drives search and page rank
Product assortment was a key factor in Brand A’s lagging online sales. In the Pure Play Online retailer, Brand A had reduced the number of products displayed per page, choosing to streamline assortment. This caused a significant decrease in its search position rank and a decrease in sales. In contrast, a key competitor began aggregating its assortment, showing more products per page. The competitor’s decision had the opposite effect, driving a significant increase in sales.
The change in performance did not necessarily mean that Brand A’s decision was inherently right or wrong; it highlighted an opportunity to revisit whether the assortment was meeting customer needs in this channel.
Empty digital shelves led to slower sales
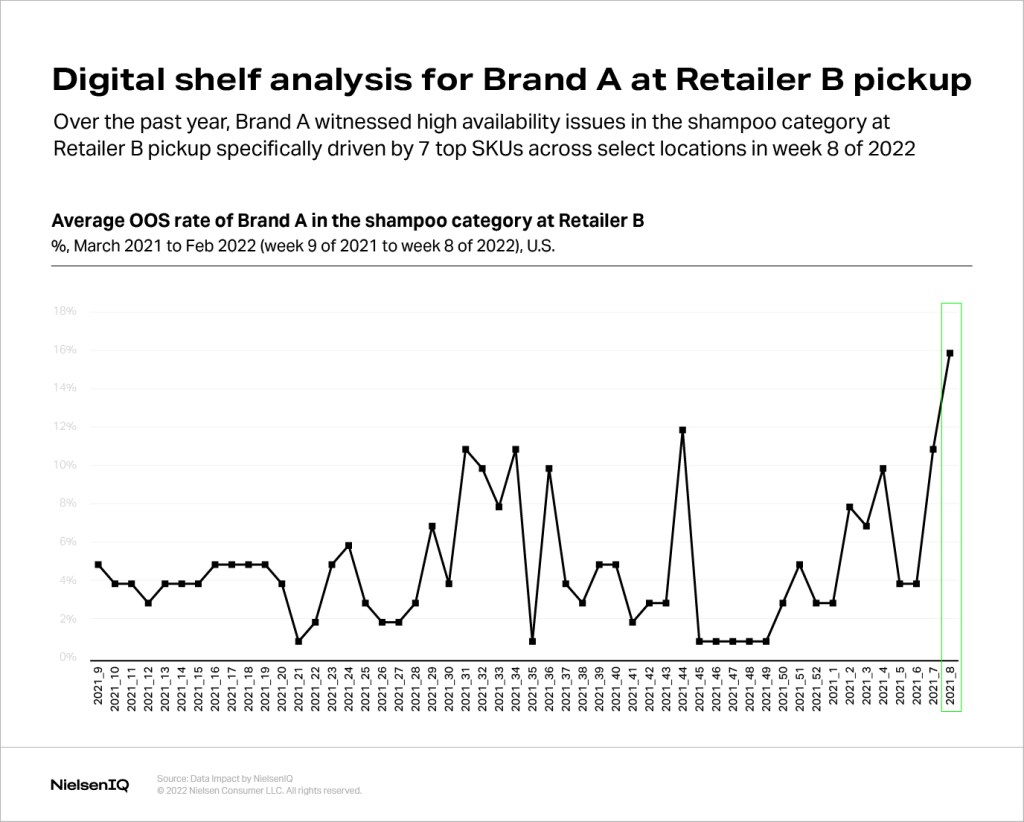
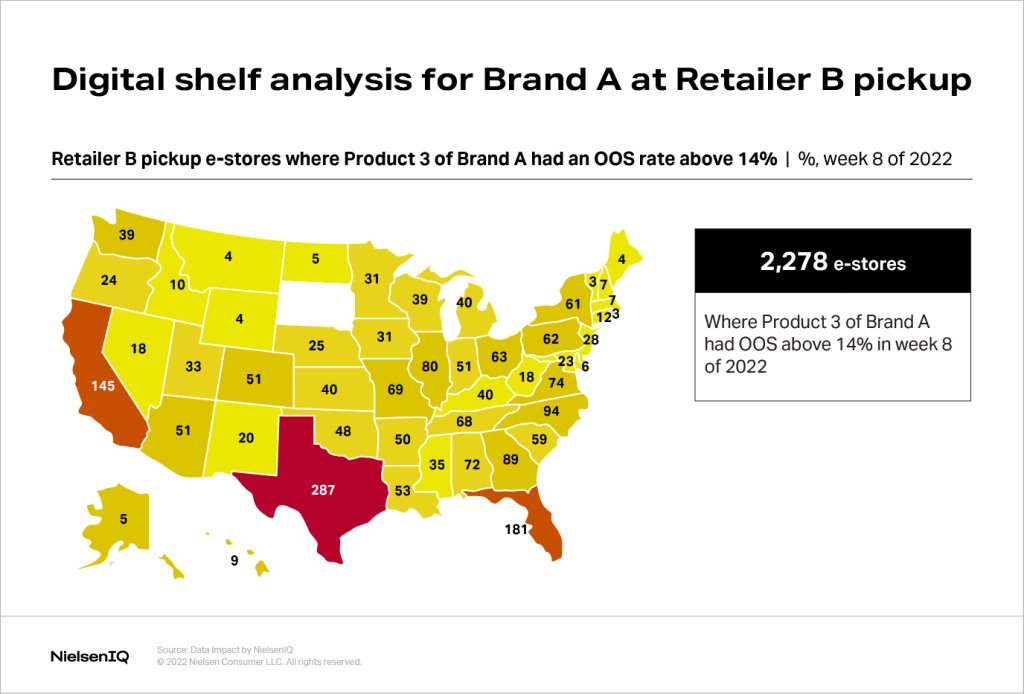
Moving on to analyzing Brand A’s online performance in Mass Retailer B, NielsenIQ determined that one potential cause of declining market share was the product being out –of stock (OOS). NielsenIQ discovered that Brand A’s products had a higher-than-average OOS rate for months. In one week alone, it peaked at a 16% OOS rate.
Optimizing Brand A’s visibility was crucial for improving online sales growth. Prior to working with NielsenIQ, Brand A made decisions based on just one online store’s metrics, but this narrow scope resulted in dangerous performance blind spots.
In the graph below, each line represents share of search for an individual store from Retailer A. Some stores showed a very high share of search; others had an extremely low share of search, or none at all, meaning that Brand A’s products were not visible—most likely because they were out of stock. Because of these massive differences in visibility, decisions based on just one store would not fit the actual needs of most locations.
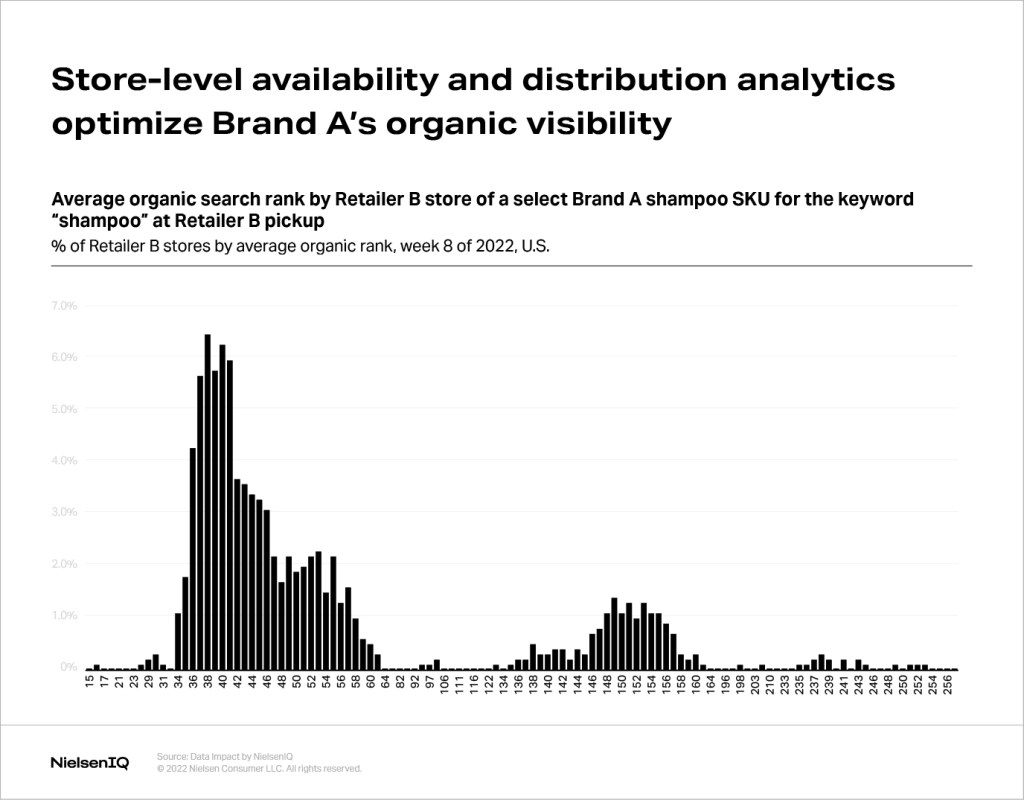
NielsenIQ delved deeper into the out-of-stock rates to see if specific products or geographies were causing empty digital shelves. There were just a few stores in a few states causing the majority of out-of-stocks, creating a clear roadmap for prioritization and strategy adjustments.
NielsenIQ also analyzed Brand A’s share of assortment by store. At 22% of Mass Retailer B’s stores, the share of assortment was below average, indicating long-term out-of-stocks and delisted products.
Brand A now understood that its lagging online sales growth wasn’t driven by a lack of promotion, pricing issue, or product-market mismatch: it was an issue of availability. Optimizing product availability would improve Brand A’s online sales growth substantially and help reverse the loss of market share.
Equipped with these findings, Brand A began working with its supply chain on tactics to increase its digital shelf availability, which would in turn improve search rankings, organic visibility, and overall online sales. The data empowered the supply chain team to have much more productive conversations with retail partners and chart a path toward lower OOS rates.
With omnichannel data, Brand A’s large, unwieldy problem—underperforming online sales— became a well-defined problem with actionable solutions: “Out-of-stocks in key retailer locations are causing our online sales to lag behind category performance.”
Shining a light on the optimal path forward
Having an end-to-end view of CPG data, from total store and category sales, all the way to individual retailer and item performance, is vital for success in today’s omnichannel environment. A comprehensive view empowers brands and retailers to allocate time and resources where they will make the greatest impact on growing sales, gaining market share, and achieving other business goals. NielsenIQ is working to bring this end-to-end capability to clients, now and in the future.