
NIQ-GfK releases purchasing power for retail product lines studies for 25 European countries
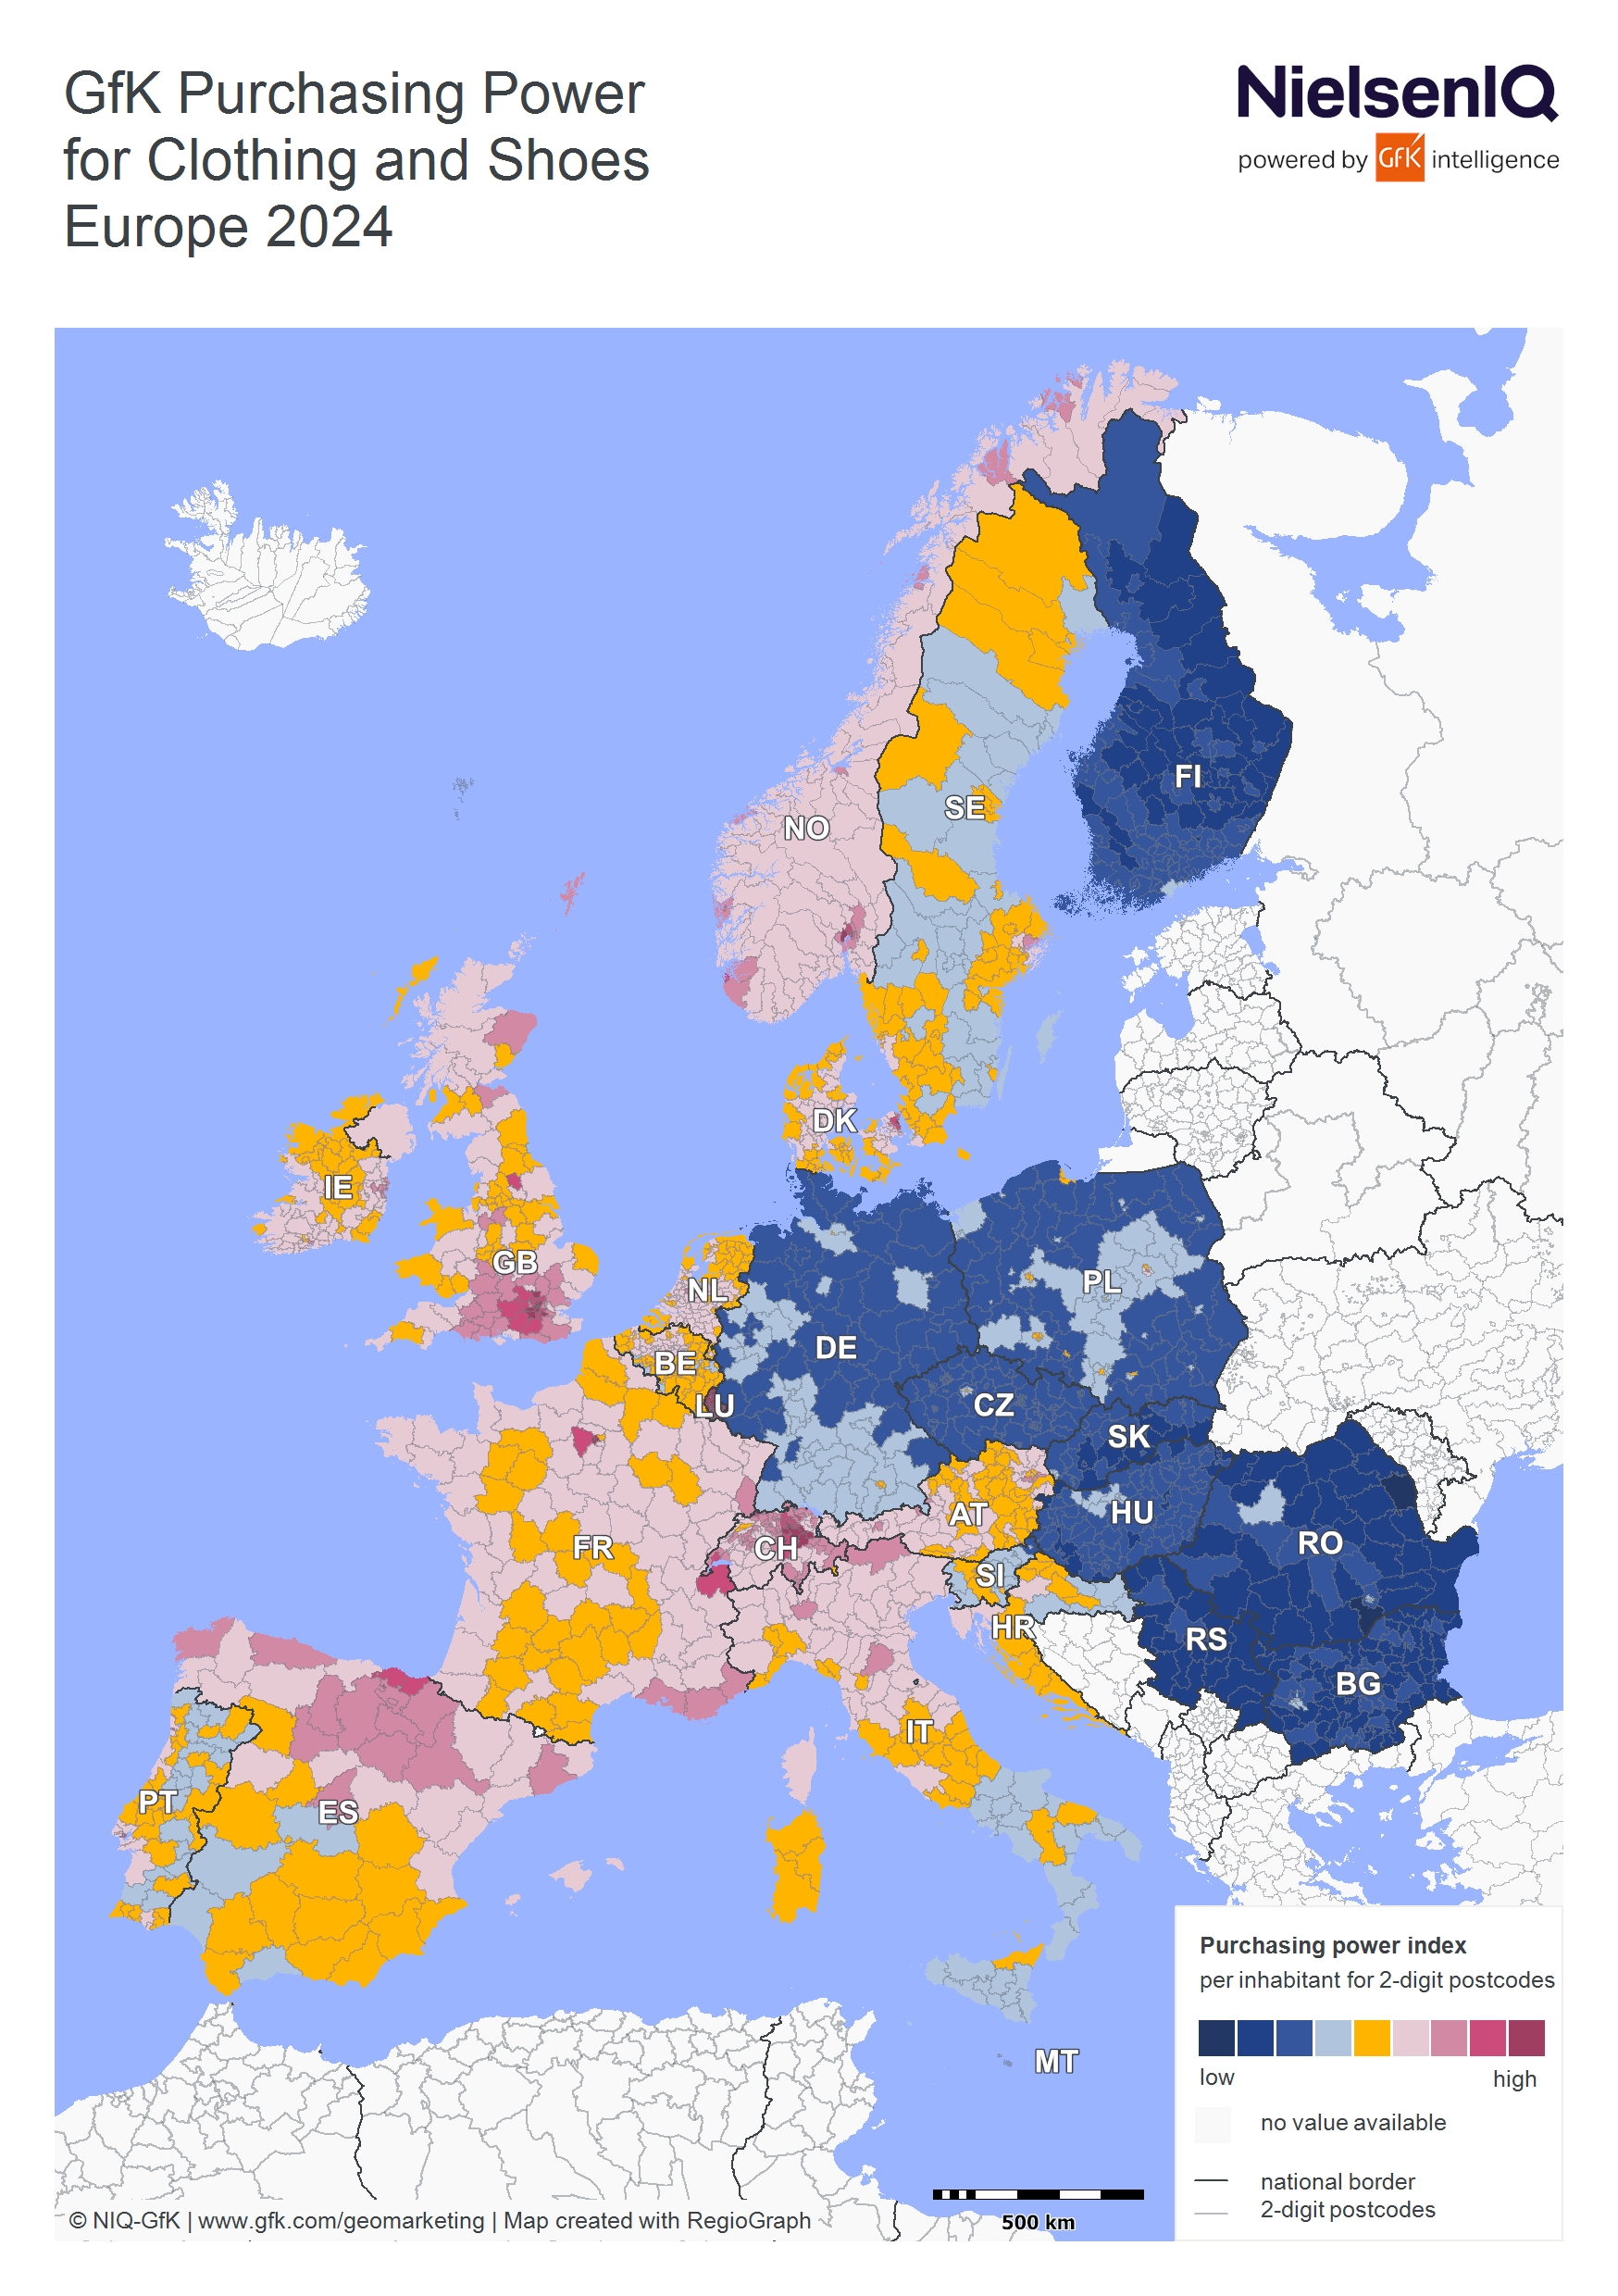
Bruchsal, Germany, June 18, 2025 – The average purchasing power for clothing and shoes in Europe is 772 euros per capita. However, there are significant differences between the 25 analyzed European countries: At 1,777 euros per capita, Luxembourgers spend the most money on clothing and shoes, whereas Romanians, with an average spending potential of 375 euros, make up the rear. There are also strong regional differences within the respective countries. These are some of the results of NIQ-GfK’s study on purchasing power for retail product lines in Europe.
The inhabitants of the 25 European countries considered by the study have a total of almost 400.2 billion euros to spend on clothing and shoes, which corresponds to an average purchasing power of 772 euros per capita. With fashion expenditures of 1,777 euros per capita, Luxembourg is more than 130 percent above the European average and thus by far the front-runner, while Switzerland and Norway follow in second and third place. Whereas the per capita purchasing power for clothing and shoes of the Swiss is about 42 percent above the average at 1,096 euros, the inhabitants of Norway have a fashion spending potential of 1,034 euros per capita. This puts them exactly 34 percent above the European average. Closest to the average is Sweden, where people spend 757 euros on clothing and shoes.
Filip Vojtech, retail expert in NIQ-GfK’s Geomarketing department, comments: “Compared to other European countries, Luxembourgers spend by far the most money in the fashion sector. However, if we look at the share of fashion purchasing power in total retail spending, Luxembourgers are only in third place with 14.3 percent. Proportionally, Spain is in first place with 14.8 percent, followed by the United Kingdom with 14.4 percent. Finland, on the other hand, is in last place, with only 5.0 percent of retail spending going towards fashion retail. On average, 11.1 percent of available retail purchasing power flows into fashion retail in the 25 European countries examined.”
Purchasing power for clothing and shoes in Europe
| Ranking | Country | Inhabitants | Per capita purchasing power for clothing & shoes in euros | European purchasing power for clothing & shoes index* |
| 1 | Luxembourg | 672,050 | 1,777 | 230.3 |
| 2 | Switzerland | 8,815,385 | 1,096 | 142.1 |
| 3 | Norway | 5,550,203 | 1,034 | 134.0 |
| 4 | United Kingdom | 67,603,461 | 991 | 128.5 |
| 5 | France | 66,142,961 | 954 | 123.6 |
| 6 | Spain | 48,085,361 | 921 | 119.4 |
| 7 | Ireland | 5,271,395 | 912 | 118.2 |
| 8 | Denmark | 5,961,249 | 911 | 118.1 |
| 9 | Netherlands | 17,942,942 | 883 | 114.5 |
| 10 | Austria | 9,104,772 | 862 | 111.8 |
| 11 | Portugal | 10,639,726 | 840 | 108.8 |
| 12 | Italy | 58,989,749 | 836 | 108.3 |
| 13 | Croatia | 3,850,894 | 815 | 105.6 |
| 14 | Belgium | 11,763,650 | 800 | 103.7 |
| Europe-25 | 518,683,724 | 772 | 100.0 | |
| 15 | Sweden | 10,551,707 | 757 | 98.1 |
| 16 | Slovenia | 2,123,949 | 662 | 85.9 |
| 17 | Poland | 37,636,508 | 572 | 74.1 |
| 18 | Germany | 84,358,845 | 547 | 70.9 |
| 19 | Hungary | 9,584,627 | 496 | 64.3 |
| 20 | Czech Republic | 10,900,555 | 490 | 63.5 |
| 21 | Finland | 5,603,851 | 460 | 59.6 |
| 22 | Bulgaria | 6,445,481 | 425 | 55.1 |
| 23 | Slovakia | 5,424,687 | 423 | 54.9 |
| 24 | Serbia | 6,605,168 | 390 | 50.6 |
| 25 | Romania | 19,054,548 | 375 | 48.6 |
Source: © GfK Purchasing Power for Retail Product Lines 2024 | * Index per inhabitant: European average = 100
Overall, 14 of the 25 countries have above-average per capita purchasing power for clothing and shoes. In contrast, 11 countries have below-average per capita purchasing power for these product lines. Romania brings up the rear with only 375 euros, which corresponds to just under 49 percent of the average.
However, there are also significant differences within European countries in terms of how much people spend on clothing and shoes. A look at Romania shows that the people of Bucharest spend almost three times as much money on fashion as the inhabitants of Giurgiu County, which borders Bulgaria to the south of Bucharest. In general, it can be observed that the regions in and around many European capitals have above-average purchasing power for clothing and shoes. In addition to Romania, this is also the case in France, Portugal, the UK and the Scandinavian countries, to name just a few.
Although in Italy people in the capital Rome also spend above-average amounts of money on clothing and shoes, the fashion capital Milan is the undisputed leader. Milanese spend over 30 percent more money on these product lines than the average Italian. Similarly, inhabitants of Spain’s capital Madrid also have an above-average purchasing power for clothing and shoes, but the fashion hotspots are the Basque provinces of Gipuzkoa and Bizkaia on the Atlantic coast.
However, not all capital city regions have above-average fashion purchasing power. Berliners, for example, spend less than the average German on clothing and shoes. By contrast, the highest purchasing power for fashion items is found in and around Munich as well as in Hamburg.
About the study
GfK Purchasing Power for Retail Product Lines is calculated on the basis of various surveys and analyses of consumers’ shopping behavior. This consumer information is then transferred to the regional level using geostatistical modeling. This methodology very effectively reveals regional variations in the demand potential for the following retail product lines: (1) food and related items (food, alcohol-free beverages, alcoholic beverages, tobacco products), (2) health and hygiene products, (3) clothing, (4) shoes, leather goods, (5) furnishings, (6) household products, glass, porcelain, (7) electrical household appliances, (8-11) consumer electronics, information technology and photography, (12) watches, jewelry, (13) books, stationery, (14-15) sporting goods, hobbies and recreation, (16) home improvement items.
The data is available for all administrative and postal territorial units – from federal states to districts and municipalities to 5-digit postcode areas. Besides purchasing power for retail product lines, data on general purchasing power, retail purchasing power, population by age group as well as inhabitants and households are also available for 25 European countries, Australia, New Zealand and selected core markets in America and Asia.
Purchasing power is shown as a nominal, i.e. not inflation-adjusted, forecast value. It relates to the place of residence. The data represent average values for all inhabitants of a region.
Additional information
on NIQ-GfK’s market data can be found at geodata.gfk.com.
A print-quality image
can be found here.
Press contact: Thomas Muranyi, T +49 911 395 4928, thomas.muranyi@nielseniq.com
About NIQ
NielsenIQ (NIQ) is a leading consumer intelligence company, delivering the most complete understanding of consumer buying behavior and revealing new pathways to growth. NIQ combined with GfK in 2023, bringing together two industry leaders with unparalleled global reach. Our global reach spans over 90 countries covering approximately 85% of the world’s population and more than $7.2 trillion in global consumer spend. With a holistic retail read and the most comprehensive consumer insights—delivered with advanced analytics through state-of-the-art platforms—NIQ delivers the Full View™. For more information, please visit www.niq.com.


