Seasonal and holiday CPG spending: Measuring the little things
Around the world, seasonal holidays are often about gathering with friends and family to celebrate an occasion and to reconnect with familiar sights, sounds, and people.
But holidays are about the little things too: favorite candies and desserts; seasonal hot and cold beverages; and addictive holiday snacks that bring back fond memories—and seem to appear on store shelves only at specific times of the year.
While many seasonal holidays (especially religious observances) don’t specifically promote alcohol, holidays mean time off from work—even for those not observing a holiday. Extended time off from work and social gatherings is the classic recipe for spurring food and drink consumption.
In this analysis, we’ll examine consumer packaged goods (CPG) spending from late December 2024 through early April 2025, primarily by region—both overall CPG and within popular holiday categories (Confectionery & Snacks and Alcoholic Beverages, for example). Other categories, such as Food categories during Ramadan, will be included as well.
All these “little things” add up to a significant portion of holiday CPG spending (and a significant helping of holiday joy). Determining the percentage of CPG sales that can specifically be attributed to holiday-related consumer spending is difficult to quantify, however.
A new way to identify holiday spending
To shed more light on holiday-induced spending, in this analysis we’ll use a key performance indicator called the Holiday Shopping Index (HSI). This is a proprietary algorithm developed by NIQ that isolates holiday-generated spending. Specifically, HSI:
- Measures weekly value sales specifically driven by “shopping-inducing” holidays across product categories
- Adjusts for long-term trends, seasonality, inflation, and other factors to isolate holiday effects
A score of 100 is the level of sales one would expect in the absence of a holiday. So, for example: If the HSI is 112, this means that sales are 12% greater than would be expected in the absence of a “shopping-inducing event,” such as a holiday.
Holiday spending often peaks during the week a holiday occurs—but not for all categories or holidays. In this analysis, we identified peak holiday spending weeks, regardless of when the peak occurs. For example, peak spending in a particular category may occur two weeks prior to a holiday date.
Armed with this knowledge, brands and retailers can better identify which product categories in specific regions are in demand for different holidays. They can also see the relative strength of a holiday’s pull on CPG category spending.
Asia Pacific
In Asia Pacific, we see several holidays boost consumer spending in the first half of the year: Lunar New Year, Ramadan, and Eid al-Fitr (end of Ramadan).
Lunar New Year
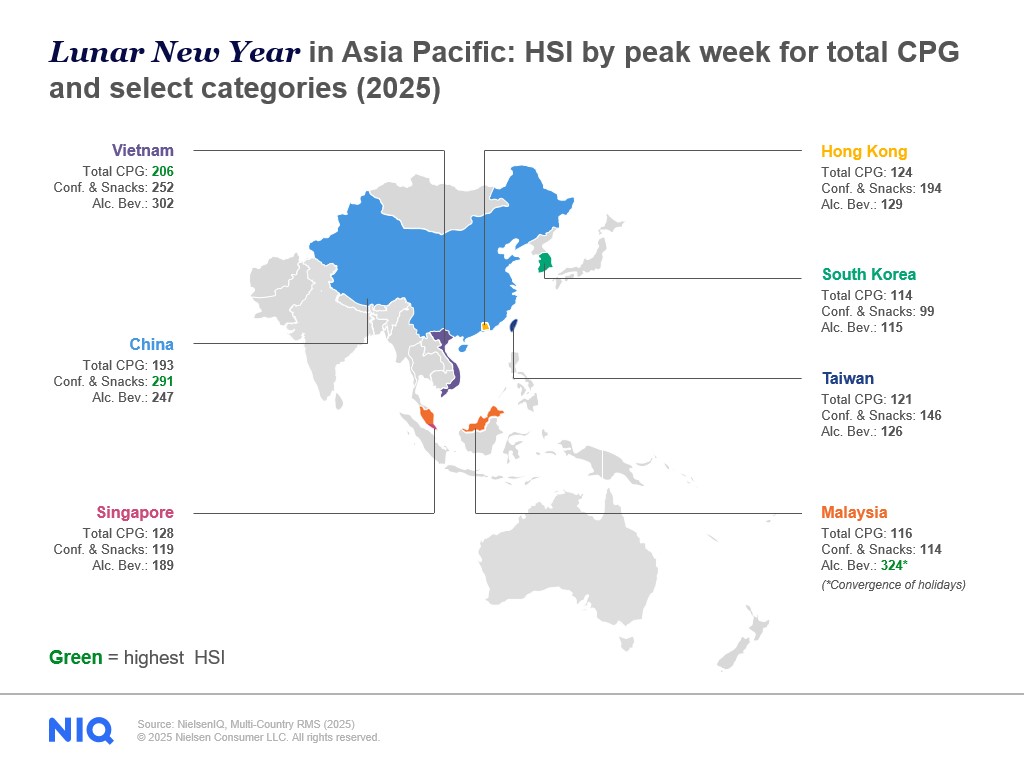
Lunar New Year, which fell on January 29 this year, generates strong consumer spending in Asia Pacific—especially in China and Vietnam. In both countries, the holiday (known as Tet in Vietnam) is a time for family gatherings and plenty of seasonal food and snacks, such as savory or sweet sticky rice cakes.
The highest spending lift for CPG items, measured by peak week, was in Vietnam, with an HSI of 206, slightly higher than China’s HSI of 193.
In the Alcohol category, Vietnam experienced a higher percentage increase than China, too, (302 compared with China’s 247). That value means that in Vietnam, Tet generated a peak week of consumer spending 202% higher than normal.
The percentage increase in this category was also relatively strong in Singapore (189). The lift for Confectionery & Snacks was highest in China (291), followed by Vietnam (252) and Hong Kong (194).
A spike in Malaysia
In Malaysia, an interesting anomaly appears. Modest Lunar New Year spending is accompanied by a sharp percentage rise in the Alcohol category (an HSI of 324—224% above normal).
This spike isn’t solely tied to Lunar New Year, however. It results from a unique pairing of holidays appealing to ethnic groups of Indian and Chinese origin. In addition to Lunar New Year (Jan. 29), Malaysians also celebrate the religious holiday of Thaipusam (Feb. 11). Although Thaipusam, which is celebrated mainly by Malaysian Tamils, doesn’t involve alcohol consumption, the overlap of holidays and extended time off from work likely contributes to increased spending.
Ramadan
In Asia Pacific, Ramadan’s impact on consumer spending is most notable in Indonesia and Malaysia, where it began on March 1 and 2 this year, respectively. CPG spending typically rises before Ramadan and again near its end for Eid al-Fitr (March 31 in Indonesia and Malaysia), marking the close of the month-long fast.
In Indonesia, we see a higher HSI around Eid al-Fitr in overall CPG spending (134) than around the beginning of Ramadan (115). This is culturally driven, as Eid al-Fitr (known locally as Lebaran), is a major national holiday in Indonesia, with workers receiving extended leaves to return home for celebrations and feasting. Confectionery & Snacks in Indonesia hit a higher peak during Lebaran (151) than at the start of Ramadan (122).
We also see a significant lift in Frozen Food, experiencing a peak HSI of 170 during the week of Lebaran, as families stock up for holiday meals. Lebaran drives significant increases in other categories too: Health & Beauty (146), Non-alcoholic Beverages (132), and Home Cleaning (125).

India Republic Day
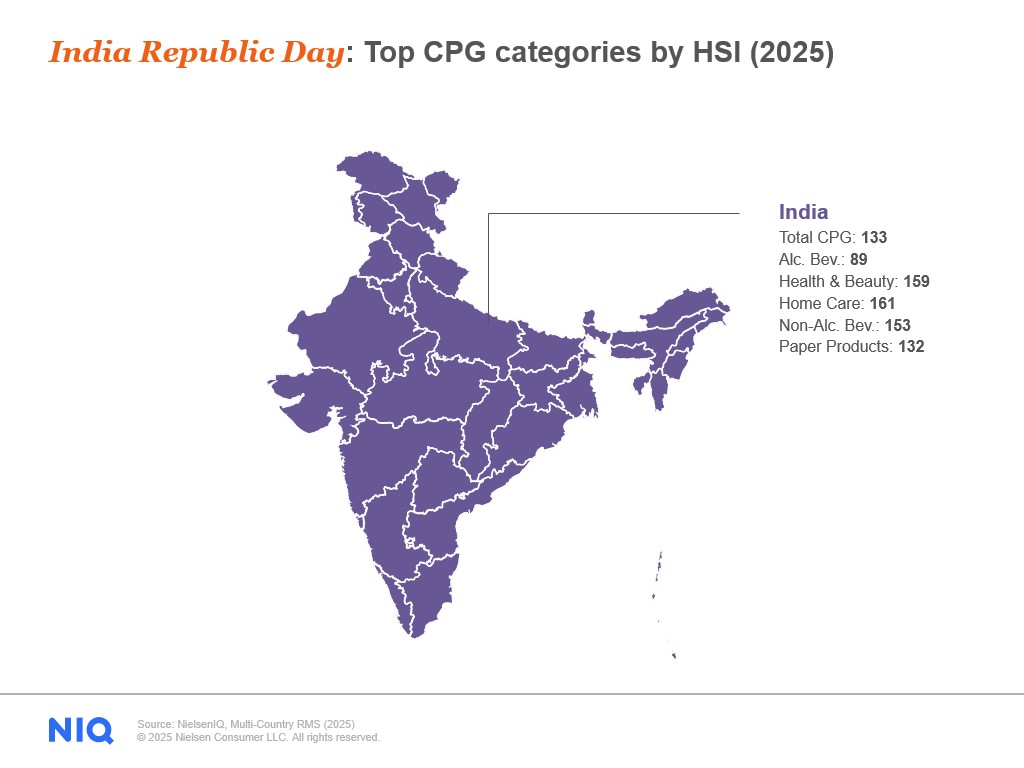
In India, alcohol sales drop on India Republic Day (Jan. 26) due to the tradition of honoring the Indian Constitution’s signing with respectful and sober celebrations, reflecting Mahatma Gandhi’s advocacy of temperance.
Commercially, India Republic Day is one of India’s biggest shopping events of the year. Sales by large national retailers and e-commerce platforms generate increased spending, which explains the significant boost in Health & Beauty products (159). Offerings during sales focus on large discounts, encouraging consumers to stock up on popular items and necessities. Other categories boosted by India Republic Day sales are Home Care (161), Non-alcoholic Beverages (153), and Paper Products (132).
Europe
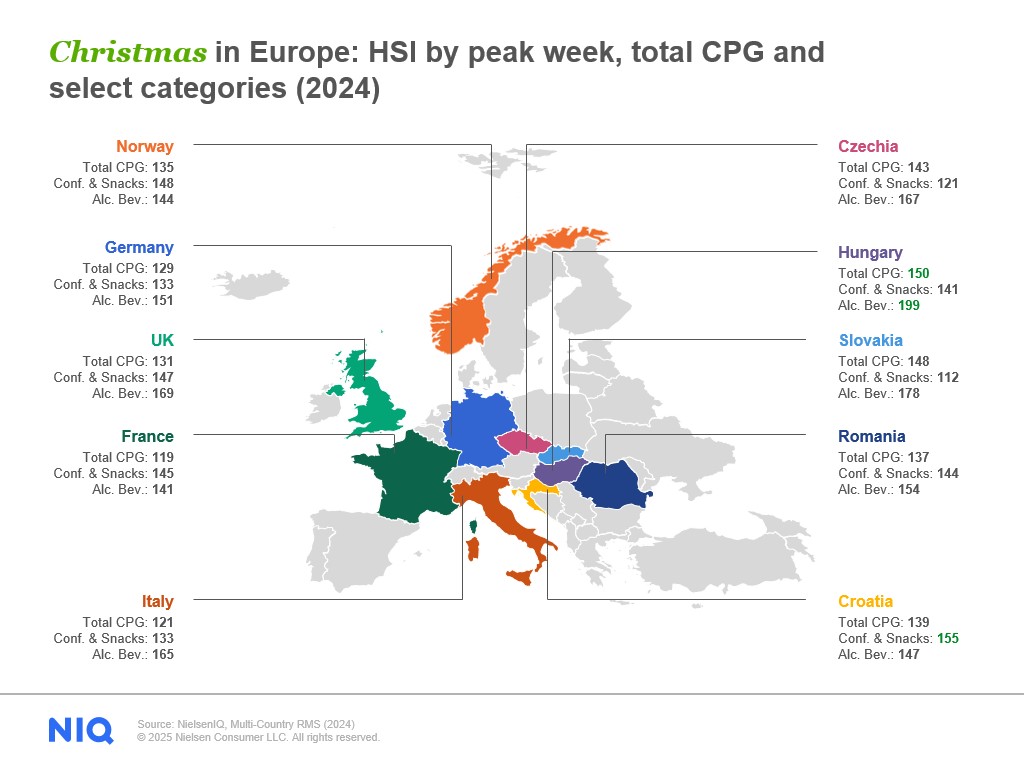
In Europe, where holiday spending is pronounced at Christmas, HSI numbers reveal some regional nuances. The top five countries with the highest HSI for overall CPG, such as Hungary (155), Slovakia (148), and Czechia (143), are all Eastern European. We notice the same trend in the Alcohol category, where Hungary (199) and Slovakia (178) top the list. Hungary’s prominence on the list may be explained by Hungarians’ affinity for gifting local, premium wines during Christmas.
Latin America
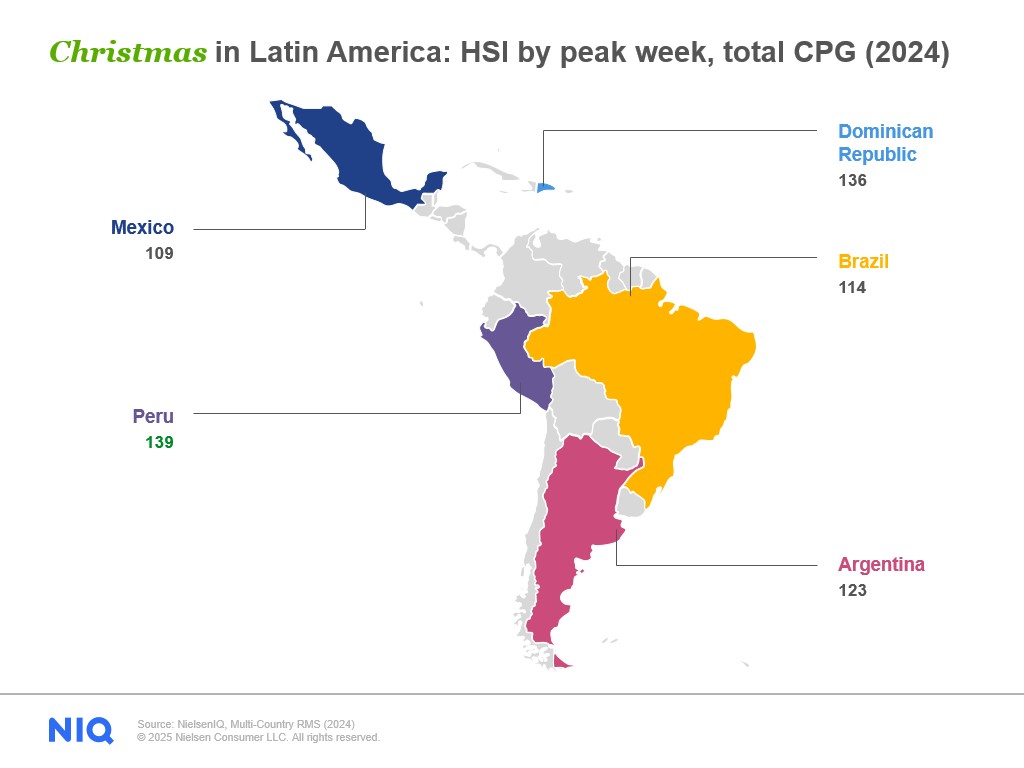
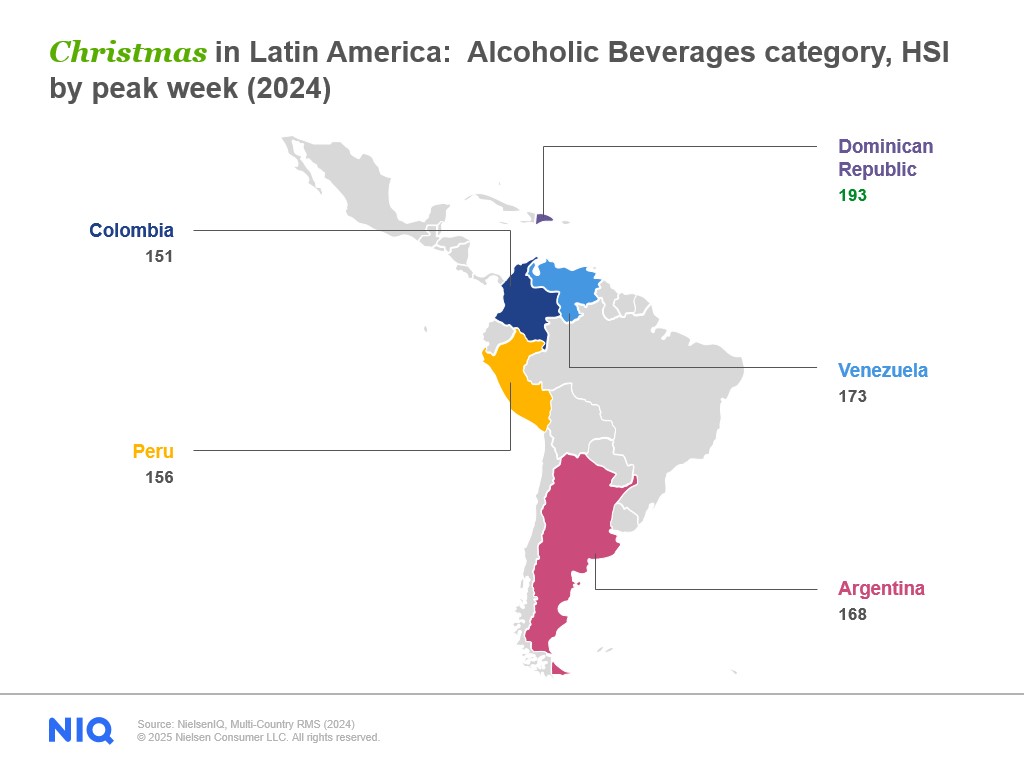
In Latin America, Christmas is historically a less commercial holiday compared with Europe and North America. In addition, recent and ongoing effects of inflation may have made many Latin American shoppers more cautious.
In the top five countries, as measured by total CPG spending, we see a large spread in the index between smaller countries and much larger ones (by population). Peru ranks at the top of the list (139), followed by the Dominican Republic (136), Argentina (123), Brazil (114), and Mexico (109).
We also see a sharp peak in Puerto Rico (201) in the Confectionery & Snacks category for Valentine’s Day. This is likely due to Puerto Rico’s close economic and cultural ties to the US, where large CPG retailers heavily promote the holiday and its emphasis on gifting chocolate and sweets. (US retailers such as Walgreens and CVS can be found in Puerto Rico too.)
North America
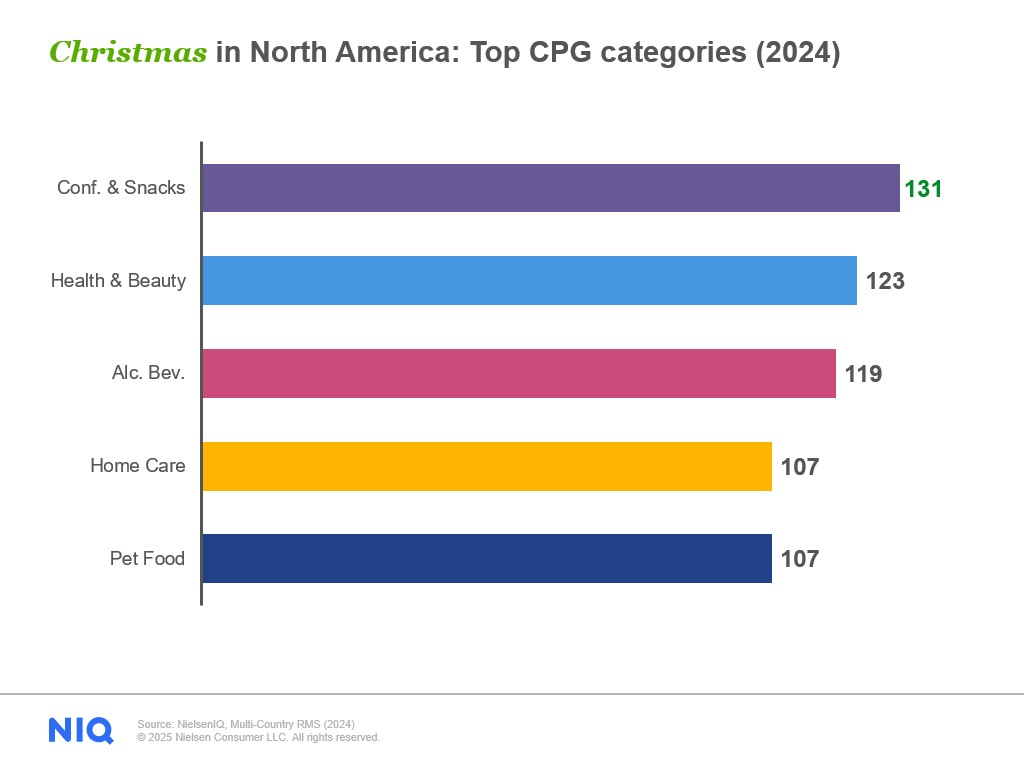
For North America, total CPG values are relatively low compared to Europe. Canada (112) and the US (110) also show a relatively lower rise in the Alcohol category compared with Europe. In general, Christmas in the US is more commercial, with heavier retail promotion of Tech & Durables categories during shopping events such as Black Friday and Cyber Monday. In contrast, in Europe, gift giving of premium foods, wine, and liquor is more common during the Christmas season.
Middle East
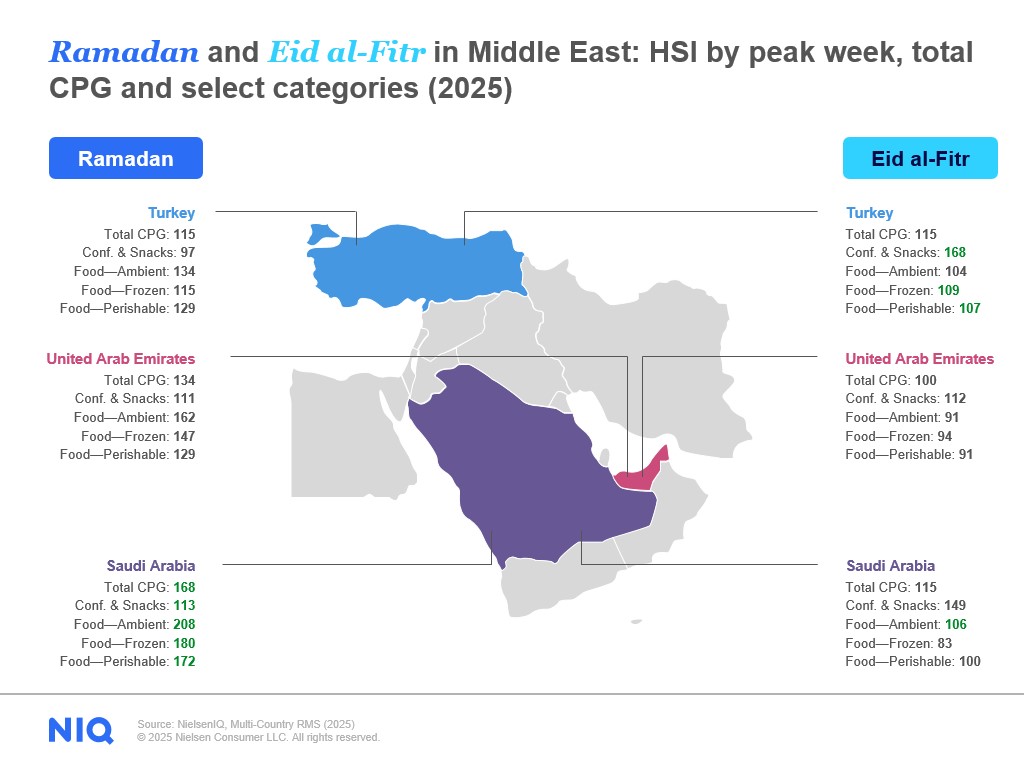
We analyzed Ramadan and Eid al-Fitr spending in three strong economies: Saudi Arabia, Turkey, and the United Arab Emirates (UAE). For the start of Ramadan, Saudi Arabia topped the list for highest lift in overall CPG (168) as well as in the Food category (Ambient, Frozen, and Perishable). In all three countries, CPG and most Food category values were higher at the start of Ramadan (March 1) than during its end (Eid al-Fitr).
An exception was Confectionery & Snacks, which peaked in Turkey (168) for Eid al-Fitr, where the holiday is known as “Ramazan Bayrami” (which translates to Sugar Festival—a fittingly sweet end to the season of fasting). A three-day public holiday in Turkey, Ramazan Bayrami includes gifting candies to children and indulging in well-known sweet desserts, such as baklava and revani. According to a recent NIQ analysis, Ramadan’s contribution to annual CPG sales is highest in Turkey compared with any other market.
Global highlights
Regional flavors of holidays
The Holiday Shopping Index highlights how local culture shapes consumer behavior. For example, during Ramadan, spending patterns vary by region. In Indonesia, where Eid al-Fitr (Labaran) is a major holiday, extended time off and family gatherings drive strong spending at Ramadan’s end.
In contrast, in Saudi Arabia, Turkey, and UAE, CPG consumption tends to peak at the start of Ramadan. Turkey stands out, with a surge in Confectionery & Snacks purchases during the Sugar Festival at the end of the holiday.
Health & Beauty’s global reach
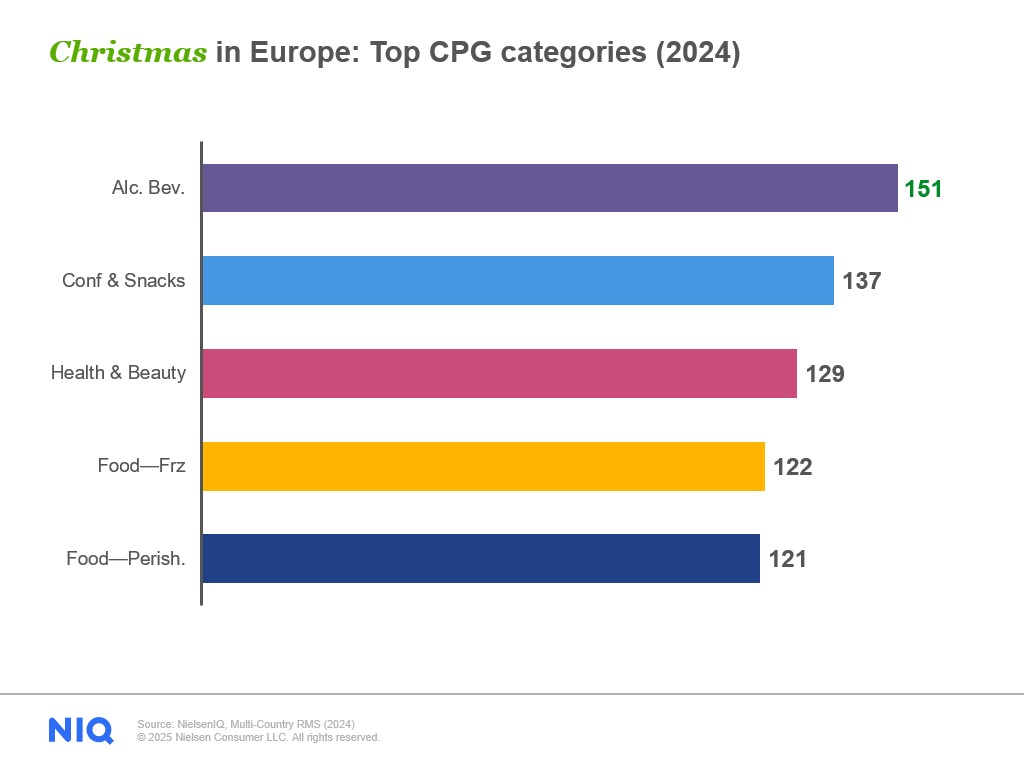
It’s also worth noting that in addition to core holiday CPG categories like Confectionery & Snacks, Alcoholic Beverages, and Food, we see Health & Beauty products rank highly across many holidays and regions. For instance, the Health & Beauty category shows up prominently in the top CPG categories for India Republic Day (159), in Christmas in Europe (129) and North America (123), and even in Indonesia for Eid al-Fitr/Labaran (146).
Key takeaways
In today’s market, manufacturers and retailers must be nimble enough to understand regional and cultural consumer differences, while also keeping their eye out for truly global trends, like the global rise of Health & Beauty categories. In our analysis, we also found holiday-influenced shopping occurring weeks before the actual calendar date of a holiday, emphasizing the need for manufacturers and retailers to anticipate demand well in advance.
Want to learn more about the Holiday Shopping Index? Contact us today!
For more data and insights pertaining to seasonal shopping occasions, visit NIQ’s Total Commerce hub.


