Traditional sales metrics alone won’t fully reveal incrementality
Contrary to popular belief, sales rankings don’t tell the entire story of an item’s in-store performance. In traditional sales rankings, meeting or exceeding expected sales goals is one indicator of success.
For example, on a list of the 100 top-performing products for a brand, an item ranked #10 might seem to be doing well and contributing positively to your bottom line. However, hidden within this data may be the reality that the product is eating into sales of the #2 item, in which case the actual net result becomes more difficult to assess.
Getting rid of item #10—even if it looks strong from a sales perspective—could make room for other products that can do more volume. By leveraging incrementality analytics to get the right items on the shelf, retailers and brands can quickly determine which segments can be contracted, which items can be delisted, and which items ensure category sales growth.
Put simply, “incrementality analysis can help you understand how to have a high-performing item that also grows your category, not one that takes away sales,” says Andrea Binder, NielsenIQ’s Associate Client Director of Retail Assortment Analytics.
Incrementality analysis can help you understand how to have a high-performing item that also grows your category, not one that takes away sales.
Andrea Binder, Associate Director, Retail Assortment Analytics for NielsenIQ
Incremental sales: Is the juice worth the squeeze?
So why doesn’t incrementality tell the whole story of a category’s overall sales? “You could find an item that is entirely incremental—meaning its sales are entirely new to the category, and its sales don’t cannibalize other items on the shelf,” Binder says. “But without knowing the sales rate, you don’t know how well that item would truly perform.”
Finding success is a combination of understanding both sales velocity—its turnover rate, or how quickly it’s sold and restocked—and incrementality, according to Binder. She stresses that having one without the other will undermine the relationship between a retailer and manufacturer by not driving profitable results.
“You wouldn’t get the sales volume from that item needed to offset the costs to put that item on the shelf,” she says. That means that while an item may look highly incremental to grow the category, products may not have the needed sales velocity to succeed. Or, as Binder puts it, “the juice might not be worth the squeeze.”

Make your assortment strategy work for you
While assortment is getting harder, your competitors are looking for every edge. Stay ahead with proactive strategy and solutions to simplify the complexity of the changing retail and manufacturing landscape.
The right data to determine incrementality
When it comes to better understanding incrementality, where should you start? First, analyze high-performing individual retail SKUs. Then, identify high and low cannibalization between on-shelf items. This way, retailers and manufacturers can determine which items represent incremental sales opportunities, and which are less productive to the category.
One way to perform this analysis is through clear visuals, such as bubble charts. These dynamic data visualizations can help identify areas to grow and optimize, and are a great place to start for businesses looking to improve sales and maximize shelf space.
A bubble chart visualization combines sales data with how fast a product is moving, as well as how incremental that item is. By placing items within a four-quadrant setup, a graph can make clear an item’s impact relative to the rest of the assortment, and ultimately on a category’s overall sales volume.
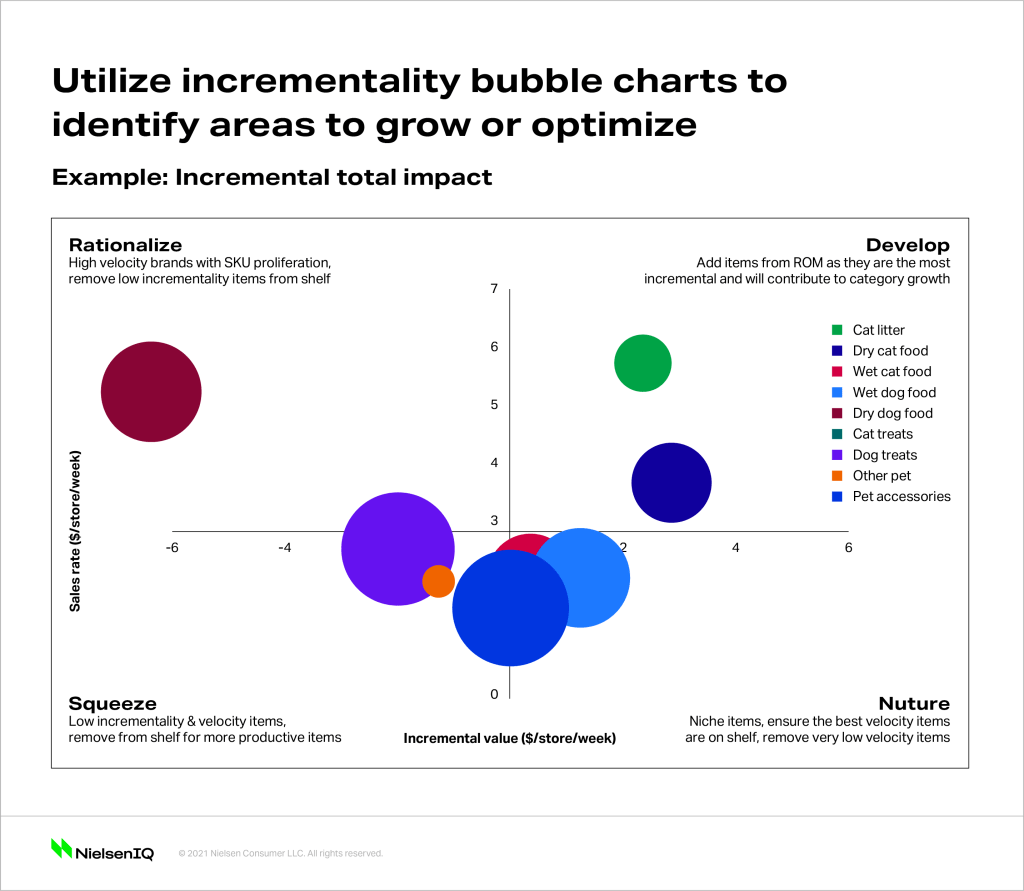
4 stages of incrementality
Based on the chart above, you can see that each quadrant represents a different incrementality strategy. Here is a quick summary of what your incrementality strategy should be for products in each section.
Rationalize: By recognizing saturated and restricted category growth and high rates of sale—as well as understanding negative incrementality and only putting the best items in distribution—small business owners will be able to ensure that only the best items remain in distribution.
Develop: A key driver of a category’s high rate of sale is positive incrementality, which can increase the number of products on-shelf. “The items that fall in this bubble have a high rate of sales and are highly incremental,” Binder says. “You’ll want to find more items in the market that you’re not carrying to fall into this segment that you can add to your shelf.”
Squeeze: Products with low incrementality and low velocity are unproductive and detrimental to a category’s sales performance. “For example, dog treats aren’t very incremental: You might want to pull back some of those to make room for cat litter, or dry cat food,” Binder recommends.
Nurture: A key pillar in helping to maximize category sales, niche products and emerging innovations, slow-moving items should be nurtured by using positive incrementality, which can make up for a low rate of sale. By reviewing slow-moving products, retailers will be able to make room for new items on-shelf.
Understanding incrementality adds a deeper dimension to simple sales figures alone. It can mean the difference between plateauing with mediocre performance, or making the right decisions and winning within your category. The right data and visualization tools are the starting point for finding actionable insights and growing your business.