The growth of personal care presents brands with new opportunities
With a vast and growing array of products available across the health and beauty segments, to the pace of innovation, the level and breadth of competition, to consumers’ continuously evolving needs and tastes, this “super category” can present myriad challenges to brands trying to carve their niche, understand competitor performance or improve their market share.
There’s also tremendous growth potential for health and beauty brands if they can understand how consumers buy health, beauty, and personal care products today, who is shopping for their products and how shoppers make brand choices that align with their values.
The question is, how? Demographics and their respective buying power have shifted in the category, while consumer priorities and needs states have evolved. Omnichannel shopping for health and beauty products has exploded, resulting in a consumer who’s become more adept at finding what they want at the price they’re willing to pay, irrespective of channel. And product attributes and characteristics have become more defining considerations for shoppers eager to make brand choices that align with their values.
To seize market share opportunities in this highly competitive environment, brands need data. Not just surface-level performance data but rich and deep insights into consumer need states, granular attribute-based sales driver analytics, and comprehensive demographic and consumer behavior data that reveals emerging buying patterns and highlights growth opportunities.
The evolving landscape of health and beauty
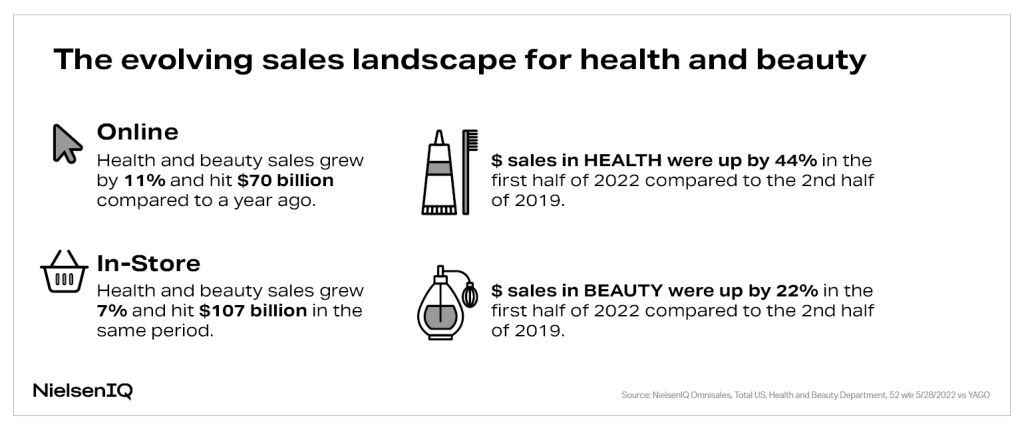
For CPG manufacturers with products in this category, online is more important for their sales than ever. Like many categories, growth in the online channel is outpacing in-store. NielsenIQ Omnisales data found that in the 52 weeks ending May 28, 2022, online health and beauty sales hit $70 billion, an 11% increase over one year ago, and in-store sales hit $107 billion, a 7% increase.1
The fastest overall growth in the same period came from categories like medical accessories (+61%), upper respiratory (+38%), ear care (+23%), fragrances (+16%), and sun care (+15%).2
Consumers have adopted a more flexible shopping routine since the pandemic, regularly combining in-person and online trips. But according to NielsenIQ Omnichannel Shopper data from 2022, 68% of consumers insist on purchasing certain items in-store, like personal care, produce, bakery, meat and seafood, and clothing.3
During the Amazon Prime Day period in July 2022, 37% of consumers surveyed by NielsenIQ said they purchased beauty and personal care products. Major online sales events like Prime Day have inspired other retailers to run sales both online and in physical stores, further blurring the lines between e-commerce and brick-and-mortar.
Personal care’s new lens on ‘traditional’ consumer groups
Online isn’t the only sales and fulfillment channel that experienced growth over the last few years. Shipped and delivery orders and curbside pickup increased as consumers first pulled back on in-person shopping, then embraced the convenience of other shopping methods. It’s cross-generational and cross-cultural, too. Consumers of all ages and backgrounds have developed new behaviors focused on convenience, saving time, and maximizing their choices.
Within the health and beauty category, millennials and consumers with a higher income are most likely to shop online. Only 10.1% of over-the-counter health product sales in-store come from consumers under 35, while 42.4% come from consumers over age 55.4
Younger shoppers aren’t afraid to try new products, as evidenced by the cohort of consumers under 35 who’ve shown interest in trending items like topical analgesics and natural upper respiratory products. They’re also more willing to shop online through click-and-collect or use services such as Shipt and goPuff,
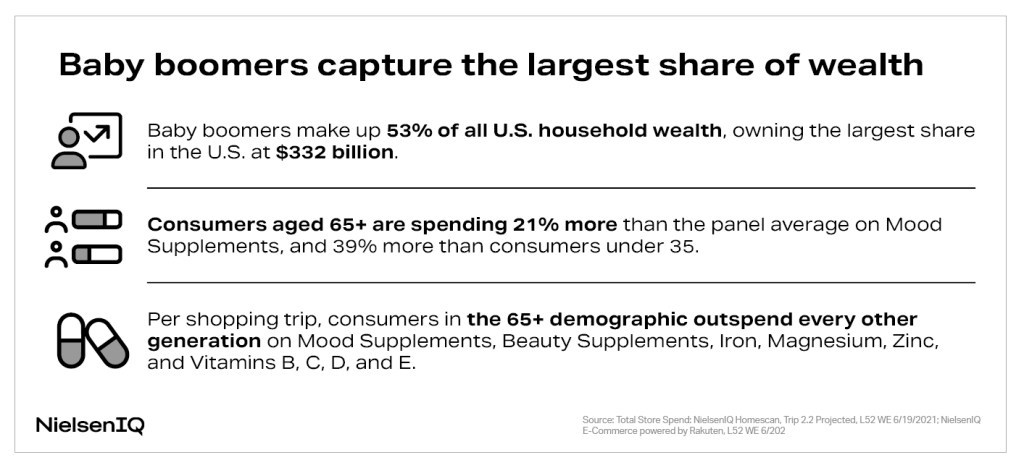
Another generation of shoppers also presents brands with new opportunities: Baby Boomers. They had the largest share of wealth in the U.S., $332 billion, for the 52 weeks ending June 19, 2021. Boomers make up 53% of all U.S. household wealth, according to NielsenIQ Homescan data and have enormous buying power.5
Boomers tend to favor the traditional drug and club stores when shopping in-store for OTC items. But they are the fastest growing group of e-commerce shoppers, and they’re incentivized to stay connected to brands online because they enjoy being rewarded through loyalty programs.
Leveraging health and beauty need states
Consumers across demographics are engaging more profoundly with wellness-focused content and products, and that’s become a cornerstone of the health and beauty industry today. Their needs have evolved beyond the basics of physical wellbeing; consumers are now indulging in self-care, preventative care, innovative care, and selfless care, all evident in the products they buy and brands they support.
Different demographics have embraced wellness for various social, environmental, financial, and physical benefits. Some consumers want wellness products to manage health conditions, while others are proactive against future health concerns.
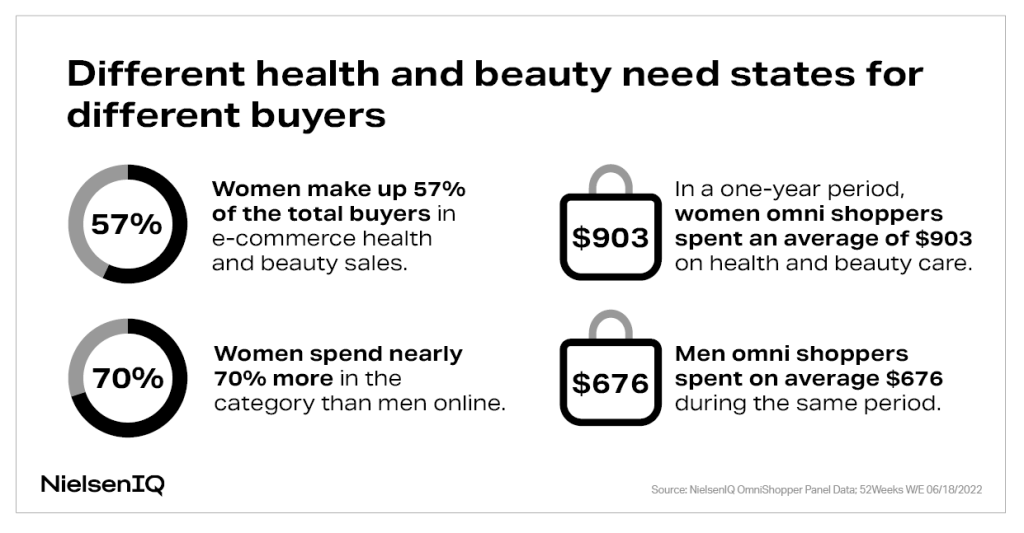
In the 52 weeks ending June 18, 2022, women made up 52% of the total buyers in omni health and beauty sales, 52% in-store sales, and 57% in online sales. Data also shows that women spend 33% more in the category than men overall and nearly 70% more online.6
The Brand Balancing Act, a global consumer survey conducted by NielsenIQ in May 2022, found that more women are shopping for brands that align with their culture and identity7 and for brands that prioritize areas that are important to them: destigmatizing period care & adult incontinence, embracing aging, and using clean label ingredients.
Consumers also want to see authentic marketing from brands in period care and incontinence. Indie brand The Honey Pot Company advertises its plant-derived products by incorporating realistic depictions of periods and sexual health education. The brand’s sales have grown by $100 million over the last two years, making it a new leader in the category.
Period care and adult incontinence products that are better for the environment with safer ingredients are significant health and beauty care trends in the sexual wellness category. Emerging trending attributes for these items include “100% recycled paperboard,” “shea butter,” and “biobased product certified.” Period care products that are “premium” have grown by 25%, “recycled packaging” has increased by 13%, and “free from phthalates” has grown by 6% year-over-year.8
Activating the modern personal care consumer
Consumer shopping preferences and behaviors may have changed, but not everyone agrees on every issue. The Brand Balancing Act survey also found that 41% of global consumers are more likely to trust larger, well-known brands. In comparison, 48% of global consumers plan to buy from mostly smaller brands as they are local, personalized, unique, and authentic.9
Calling out key attributes is another opportunity for personal care brands to reach niche consumer segments through packaging and digital product pages. Search volumes for attributes such as “sulfate-free,” “vegan,” and “biodegradable” have grown significantly, as has consumers’ spending on products with these types of claims and certifications.
Brands, too, have many options for placing products with the right attributes or claims directly in the path of values-oriented customers, for example, circulars, in-store promotions, seasonal events, loyalty programs, personalized offers, digital coupons, and online ads. Yet the marketing ecosystem that incentivizes consumers to make a specific purchase has become increasingly personalized and complex. In the evolving health and beauty landscape, brands have an incredible opportunity to reach beyond traditional customer demographics and activate consumers on and offline.
Staying ahead of beauty and personal care purchase trends
While there is plenty of room for brands to expand and innovate within the health, wellness, beauty, and personal care categories, the number of emerging entrants, larger competitors and shifting channel behaviors have made it harder to navigate. By understanding who their consumers are, how they are shopping for health, beauty, and personal care products, and what they care about, brands can zero in on the right shopper for their products and boost category growth and market share.
Learn how NielsenIQ’s consumer data solutions, including Omnisales and Omnishopper, can help your brand reach more of the right consumers and beauty and personal care shoppers.
Visit our Beauty and Healthcare Hub for more resources or get in touch with us to learn more.
Sources:
1 NielsenIQ Omnisales, Total US, Health and Beauty Department, 52 w/e 5/28/2022 vs YAGO
2 NielsenIQ Omnisales, Total US, Health and Beauty Department, 52 w/e 5/28/2022 vs YAGO
3 NielsenIQ Omnichannel Shopper, March 2022; UK, US, and Canada
4 NielsenIQ OmniShopper Panel Data; 52Weeks W/E 06/18/2022
5 Total Store Spend: NielsenIQ Homescan, Trip 2.2 Projected, L52 WE 6/19/2021; NielsenIQ E-Commerce powered by Rakuten, L52 WE 6/2021
6 NielsenIQ OmniShopper Panel Data; 52Weeks W/E 06/18/2022 7 7 NielsenIQ 2022 Brand Balancing Act Survey, May 2022; Nielsen Retail Measurement Data YTD W/E 06.18.22; Label Insights Trending Attributes; Google Trends
8 NielsenIQ RMS, NielsenIQ Product Insight, Total US xAOC; Beauty & Personal Care; L52W ending 5/21/22; vs Year Ago
9 NielsenIQ 2022 Brand Balancing Act Survey May 2022

