
Essential tips for FMCG manufacturers to analyze pricing and drive sales
Unlock success with price analysis
Understanding how pricing impacts sales is crucial to brand success. Ask yourself, “Is my price contributing positively or negatively to my sales? Does my average price align with my desired perception of value? How does my competition’s pricing compare to mine? Are there opportunities to offer tiered pricing to appeal to different shoppers?” Regularly analyzing your pricing is the key to answering these questions and more.
4 essentials tips for analyzing pricing
When analyzing prices to drive sales, consider the following tips.
- Always analyze average price at the item level
To make effective price adjustments, it is important to analyze the average price of a product at the item level. This is where most of your modifications will likely take place. However, when taking a more strategic approach to your pricing, it is also important to consider brand level pricing. For example, if you are comparing your low or value price tiers to premium brands, analyzing the premium level pricing can help you determine if your average sales are truly reflecting your desired premium retail price.
- Consider your assortment
Any time you analyze price above the item-level, consider your assortment. If your line consists of large packs and small packs, an increase in sales for large packs can lower your average selling price. On the other hand, if your sales are higher for small, single-serve packs, your average selling price can be inflated.
- Take promotions into account
Promotion can also influence the average price of your product. If you are positioned as a premium brand, but a substantial portion of your sales occur on promotion, your average selling price might be lower than you expect. Use price ladders for a clear view of your brand or item positioning in high, medium, or low-price points. For example, consider product lifecycle. Manufacturers often promote new items at launch. Comparing new items to more mature items could result in misdirection.
- Know your competitor’s pricing tendencies
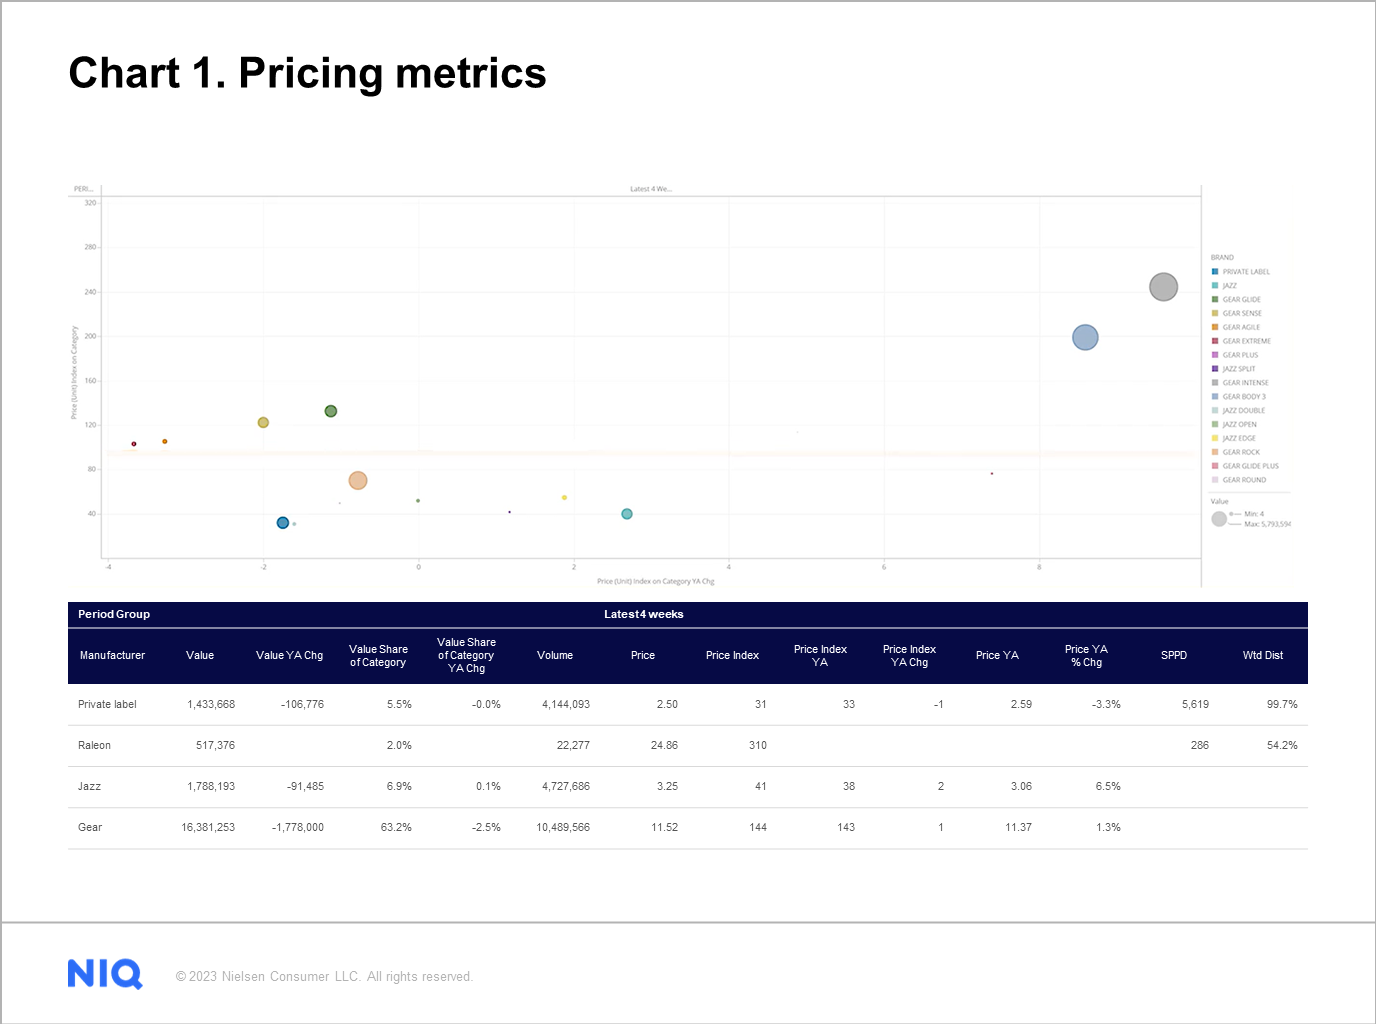
Know your competitor’s pricing tendencies since their actions can impact your performance. To understand your price positioning versus your competitors, use a Price Index. Price Index is your average price divided by your competitor’s average price, multiplied by 100.
Your pricing strategy largely determines your target Price Index, but you will want to be sure changes and trends meet your expectations. The bubble size on this chart indicates value sales.
To understand the impact of your price changes on sales, you will need to look at a broader picture than just pricing metrics alone. Think of pricing as a lever that manufacturers and retailers use to affect purchasing behavior to drive sales and volume. Price metrics are most insightful when compounded with other metrics, such as distribution and rate of sale – otherwise known as sales per point of distribution.
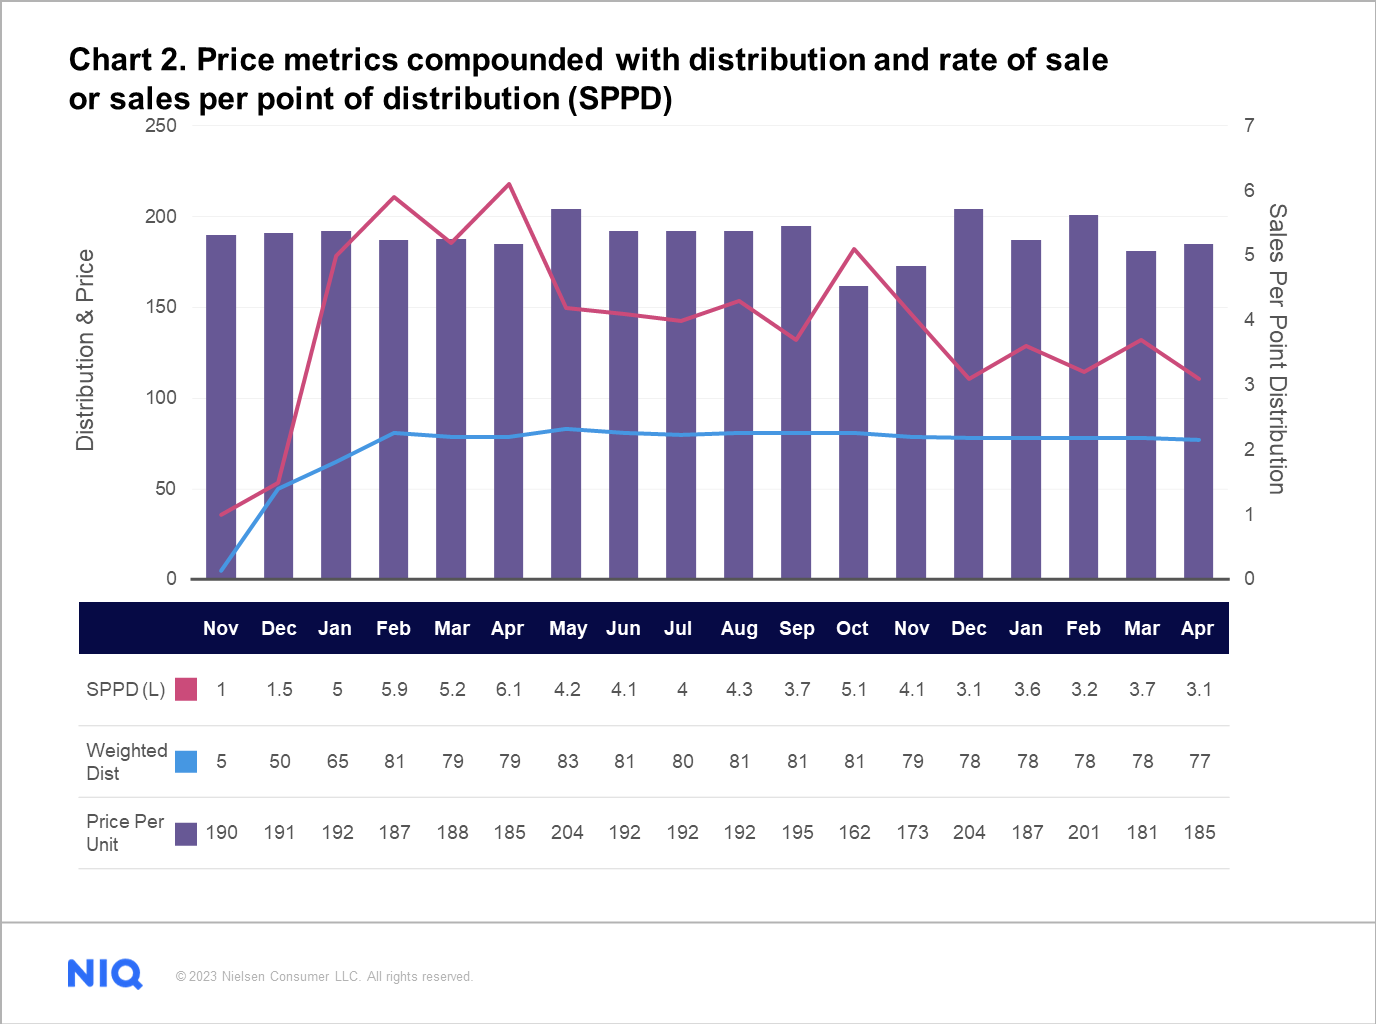
The chart above uses those metrics to answer the question: “How do price changes impact performance?” On this chart, over the course of many months, you can see that when price increases, the rate of sale always falls, while weighted distribution remains flat. When price is lowered, rate of sale tends to increase, without impact on distribution. While this example was selected to show the impact of price on rate of sale, it is important to note that other factors can drive the rate of sale, such as advertising. Build a similar chart with your competitor’s data to see how your competitor’s performance changes with price changes.
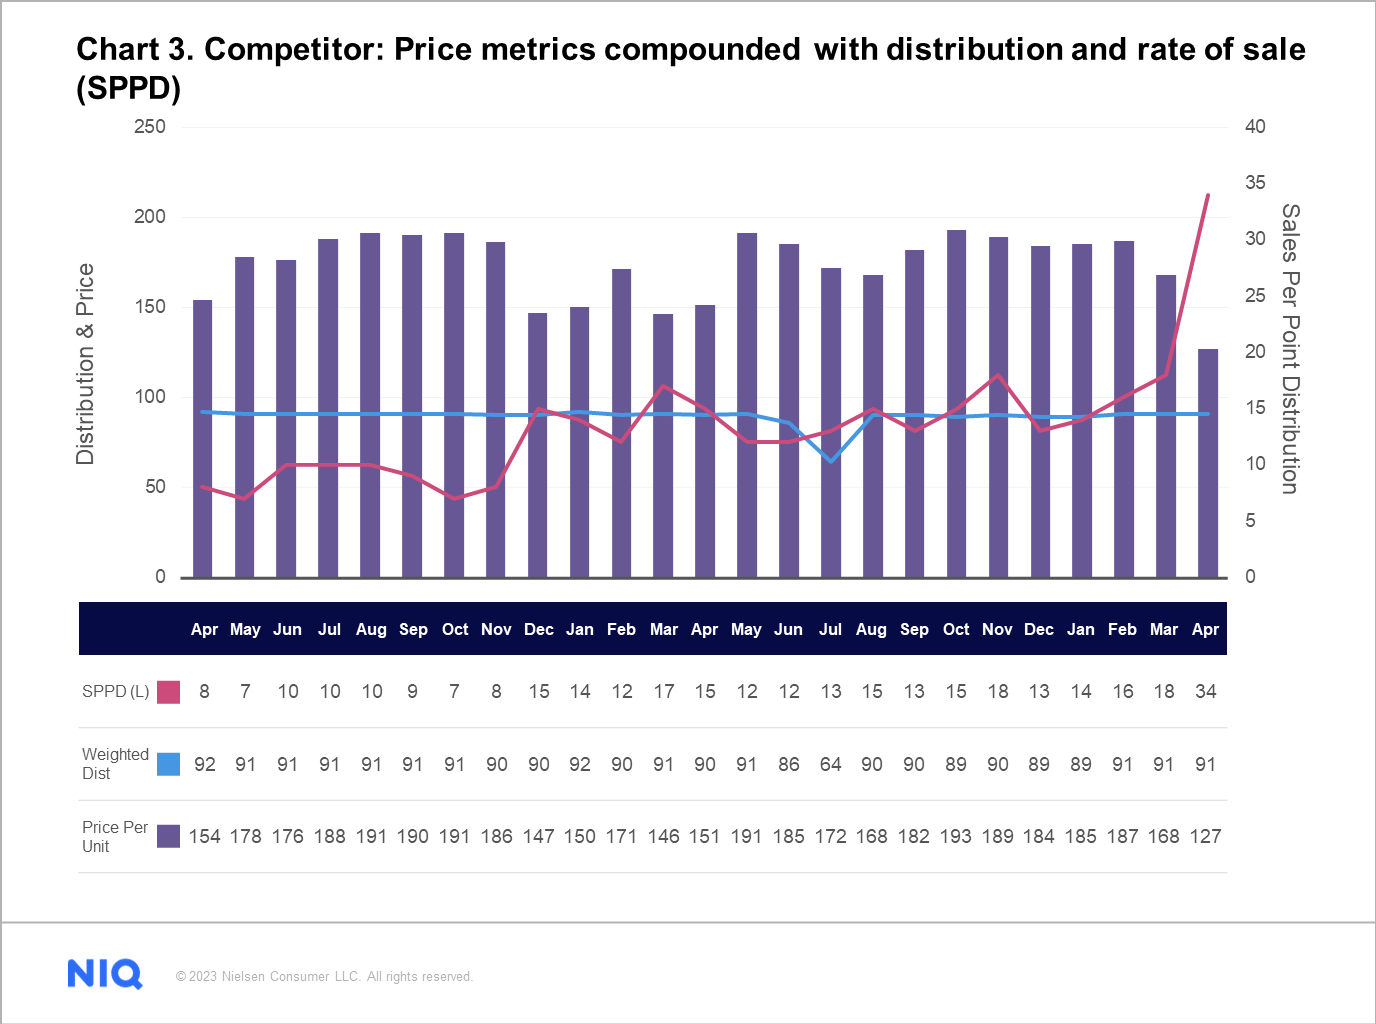
The chart above shows that the competitor’s performance is remarkably similar to the brand we looked at in chart 2, except that their price fluctuates more often. When prices increase, the rate of sale falls and vice versa. When price was at the lowest, the rate of sale was the highest. Also, like in chart 2, weighted distribution remains stable throughout the year. Overlay both charts to see a combined view of your performance versus your competitor and category.
Mastering price analysis to boost FMCG sales
Effective pricing analysis is vital for FMCG manufacturers to stay competitive and increase sales. Analyzing your average item price, assortment, promotions, and competitor pricing tendencies can provide valuable insights for informed decision-making. Combining pricing metrics with distribution and rate of sale can provide a more comprehensive understanding of how price changes affect performance. Regularly analyzing your pricing strategy will enable you to make informed decisions and drive long-term success.
To learn more about pricing, visit the Pricing module of the Ultimate Guide to NielsenIQ Retail Measurement Services (RMS) Client Learning site.

Leverage trusted and comprehensive retail data to optimize FMCG pricing strategies
Gain valuable insights into pricing trends, market share, and sales data across various channels and regions to make informed decisions about your pricing strategy and stay ahead of the competition.