The state of the U.S. beer market
In the U.S., beer is a massive category. In the U.S., Americans spent more than $37 billion on beer at NielsenIQ-measured retail stores in the year-ended Feb. 25, 2017. For perspective, Americans spent just over one-third as much ($12.5 billion) on water, the most consumed beverage globally. Beer sales also outpace those of wine and spirits—the other two categories in the adult beverage space.
Despite the massive scale of the category, however, sales growth in recent times has largely been due to pricing rather than increased consumption. In fact, beer has lost some of its footing over the past five years or so, with consumers across generations spending more on wine and spirts without increasing their overall alcoholic beverage spending. And this loss of share, combined with an increasingly crowded pace (the rise of craft, new flavors, and hard sodas/seltzers), makes it that much more critical that we provide an over-arching view of the landscape to help clients navigate the path forward.
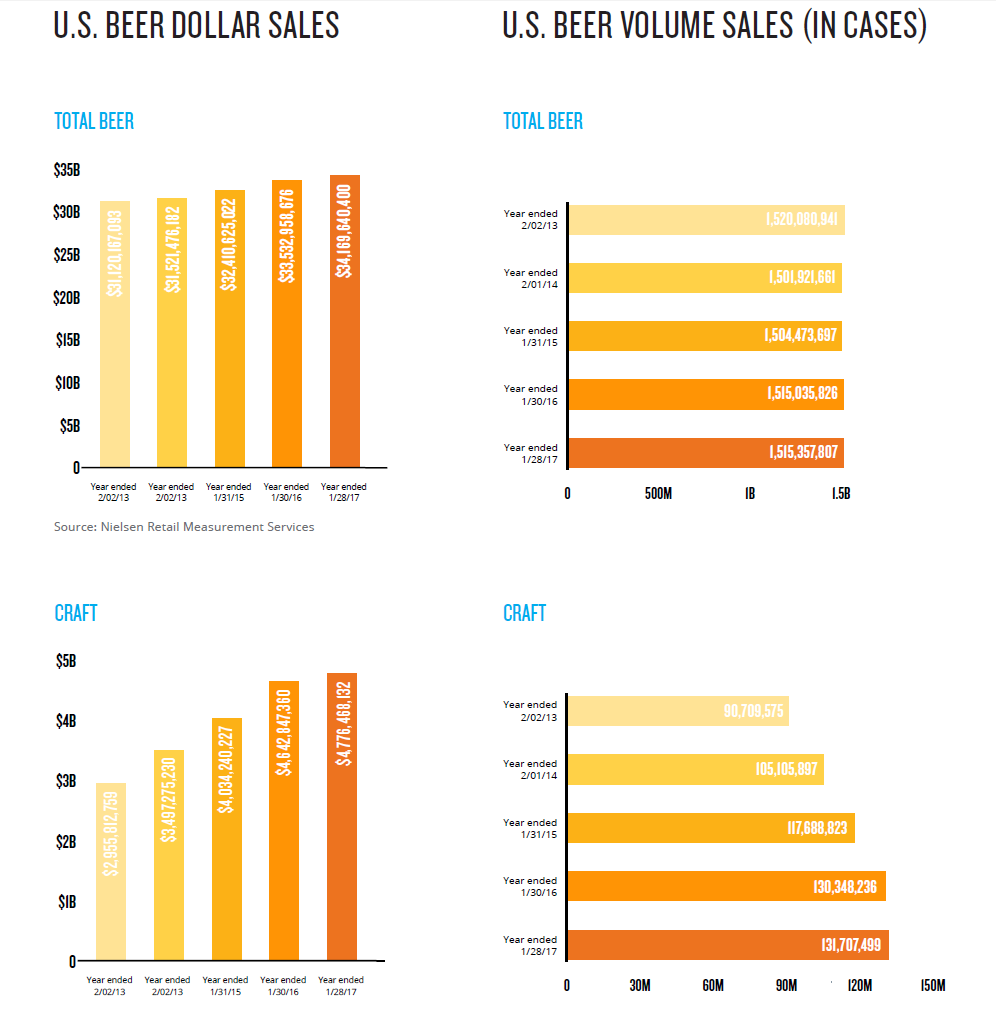
U.S. beer sales
Up until recently, the real opportunity in the beer category has been in the craft sub-category. Specifically, dollar sales growth in the craft realm ranged between just over 15% to just over 18% from 2013 through early 2016, well above the 1.3%-3.5% posted by the overall beer category (excluding flavored malt beverages, ciders, and seltzers). For the year ended Jan. 28, 2017, however, the craft engine slowed significantly, with dollar sales growth of just 2.9% in NielsenIQ-measured off-premise channels. Comparatively, sales growth in the overall beer category for the same period was 1.9%.