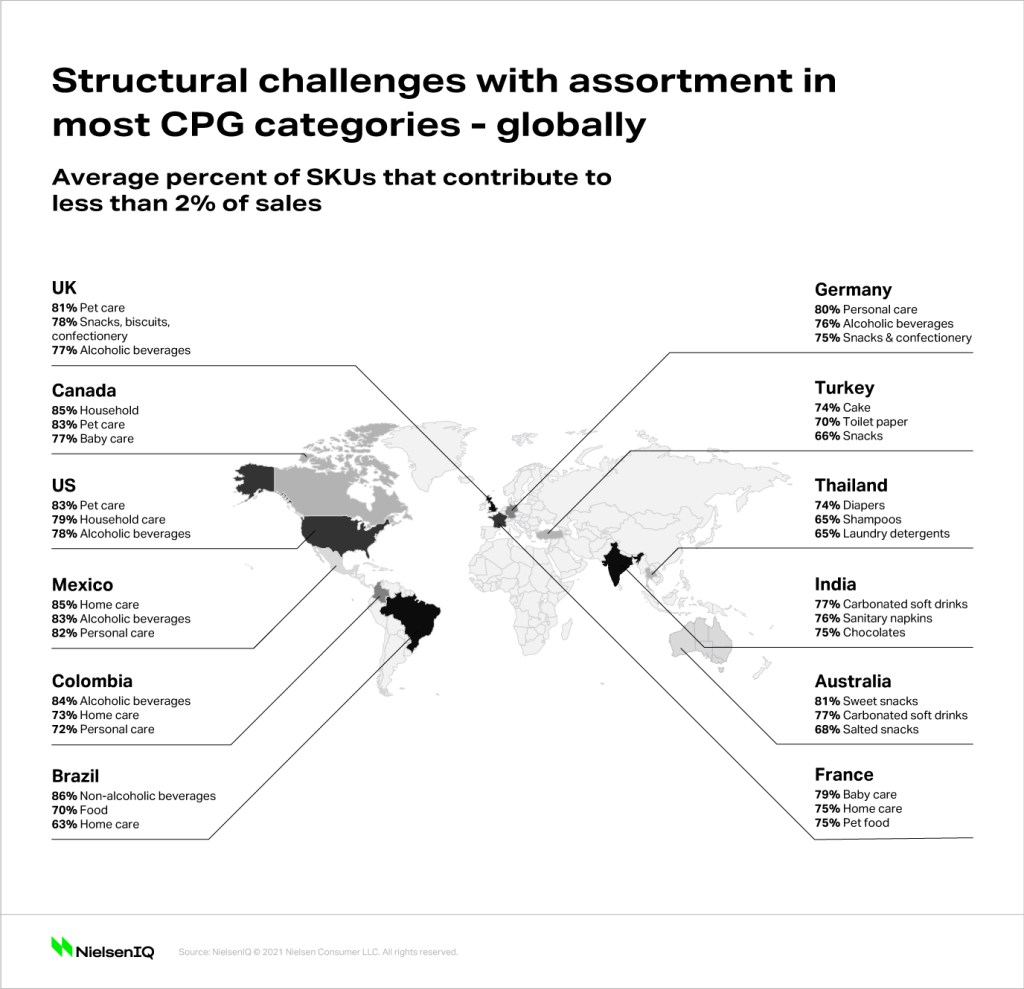
Majority of SKUs in key categories contribute less than 2% of overall sales
Across the globe, there are structural challenges with assortment in most CPG categories.
In the U.S., for example, a whopping 83% of SKUs in pet care contribute to less than 2% of overall category sales—pointing to the glut in non-performing products and variations that exist in this category alone. The same can be seen across other key categories, such as household care (79%) and alcohol (78%), showcasing that this is not an isolated incident. Rather, it is an issue that needs to be addressed by the entire global CPG industry.
Baby care, personal care, and pet care are some of the most underperforming categories in Europe’s top five markets1. In Brazil, non-alcoholic beverages, food, and home care (86%, 70%, and 63%, respectively) form the top three. Looking at the most underperforming categories in emerging and developing markets, on average, 75% of SKUs contribute to less than 2% of category sales. Beverage, instant noodles, chocolate, and detergent are some of the most underperforming categories in the region’s top 15 markets2.

COVID-19 has strengthened the case for assortment rationalization in CPG
The pandemic has impacted consumers differently, and spending is driven by four distinct consumer groups. Newly constrained, existing constrained, and cautiously insulated consumers are streamlining their budgets and have become more discerning about what, where, when, and how they purchase products.
Conversely, unrestricted insulated consumers do not feel the need to watch what they spend. The challenge for manufacturers and retailers is to ensure that the products and brands in their portfolio cater to consumers at all ends of the economic spectrum, while also remaining cost-efficient and eliminating waste.
With the rise in e-commerce and increased trust in online shopping platforms, shoppers are visiting physical stores less often. When they do, they come prepared with lists and spend less time browsing the shelves than before the pandemic—hence, products get fewer (and shorter) opportunities to be noticed.
In many countries, shoppers are increasingly favoring smaller store formats. In Malaysia, Vietnam, and Australia shoppers are making fewer trips to large-format stores, such as hyper stores and supermarkets. Instead, they are moving towards smaller formats, such as convenience stores, minimarkets, or local independent and specialty grocers—a development that only reinforces the need to make the best possible use of limited space.
Many innovations do not get enough support to survive
A recent NielsenIQ BASES study demonstrated that an average of 90 new items are launched daily in the U.S. and 120 in the top five European markets—with about 30% of promising innovations not getting enough support, such as through marketing activities, to realize their full potential.
Complementary studies by Bain & Company show that a 10% to 20% SKU reduction can result in:
- Up to 10% of savings in production costs
- Up to 10% reduction in supply chain costs
- Up to 10% lower inventory
- Up to 5% optimization in raw materials and packaging costs
However, streamlining the assortment is not just about eliminating those SKUs with low sales. It requires a more sophisticated and data-driven approach, focused on the idea of incrementality, which means building a range that can drive profitable growth while drawing the interest of more shopper segments (through niche products, for example).
Assortment rationalization provides a triple win
The overall lesson? Less is potentially more, as CPG manufacturers and retailers should understand how streamlined product portfolios can lead to profitable growth.
By correctly identifying which SKUs to retire and keep, not only can manufacturers focus production and supply chain efforts on incremental brands and SKUs, but also they can also eliminate waste, increase profitability, and reinvest profits into new product development, which will ultimately capture new shoppers. This is a win for the shopper, win for the manufacturer, and a win for the retailer.
Methodology:
Insights in this article are derived from:
- NielsenIQ Intelligent Analytics
- NielsenIQ Global Survey “Unlocking Consumption”, December 2020/January 2021
1 France, Germany, Italy, Spain, United Kingdom
2 Russia, Singapore, Thailand, India, Indonesia, Turkey, UAE, Saudi Arabia, Greece, Malaysia, Australia, Hong Kong, China, Vietnam, Philippines
- NielsenIQ “Shopper Trends”
- NielsenIQ BASES Study “Breakthrough Innovations Report 2020”
- Bain & Company Data


