
Planning for 2023 in a shifting retail landscape
New buying patterns emerge
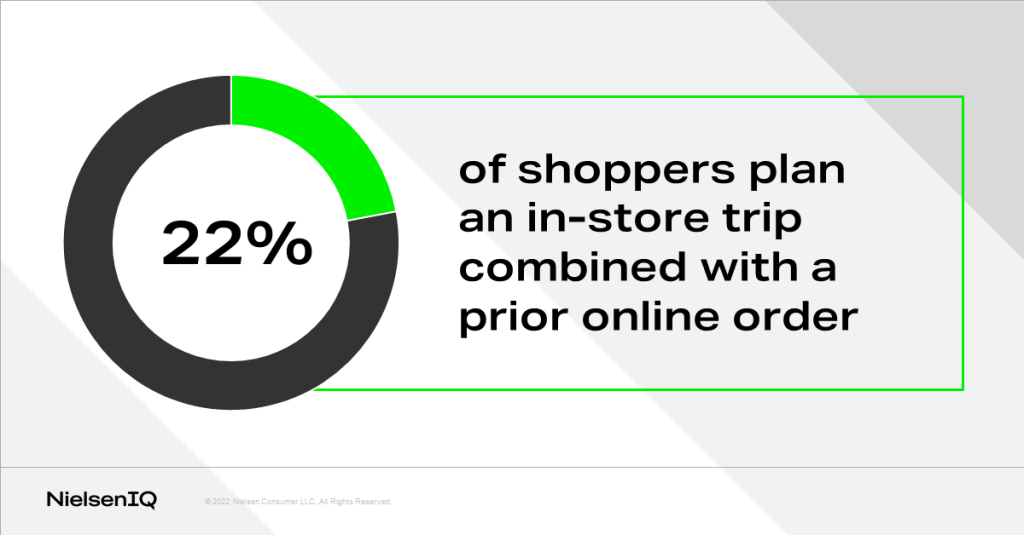
The path to purchase has become exponentially more complicated: the rise of omnichannel has opened entirely new worlds to businesses that must be managed through an omni lens. For example, alongside curbside and “click and collect” buying patterns, NielsenIQ has uncovered a new buying pattern: Click + Collect + CompleteTM. More than one in five (22%) of shoppers plan an in-store shopping trip combined with a prior online order.
As businesses plan and budget for 2023, the question remains, “How do we figure out what to expect?” Consumers’ needs, priorities, and shopping habits have radically transformed and continue to change. Past forecasting and measurement methods can fall short, leading to expensive inventory surpluses or shortages.
CPG businesses must plan with an omnichannel mindset to stay relevant, measure behavior in a way that allows them to anticipate future changes and capitalize on emerging trends. Omnichannel insights illuminate the “why” behind consumer behavior, empowering businesses to answer crucial strategic questions such as:
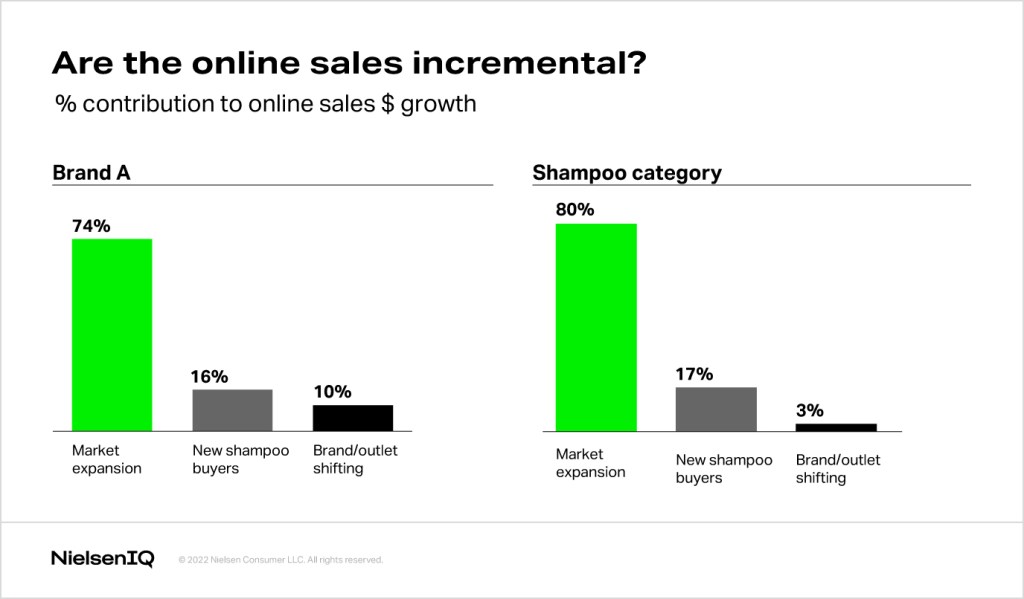
- Are our online sales incremental or caused by shifting customers?
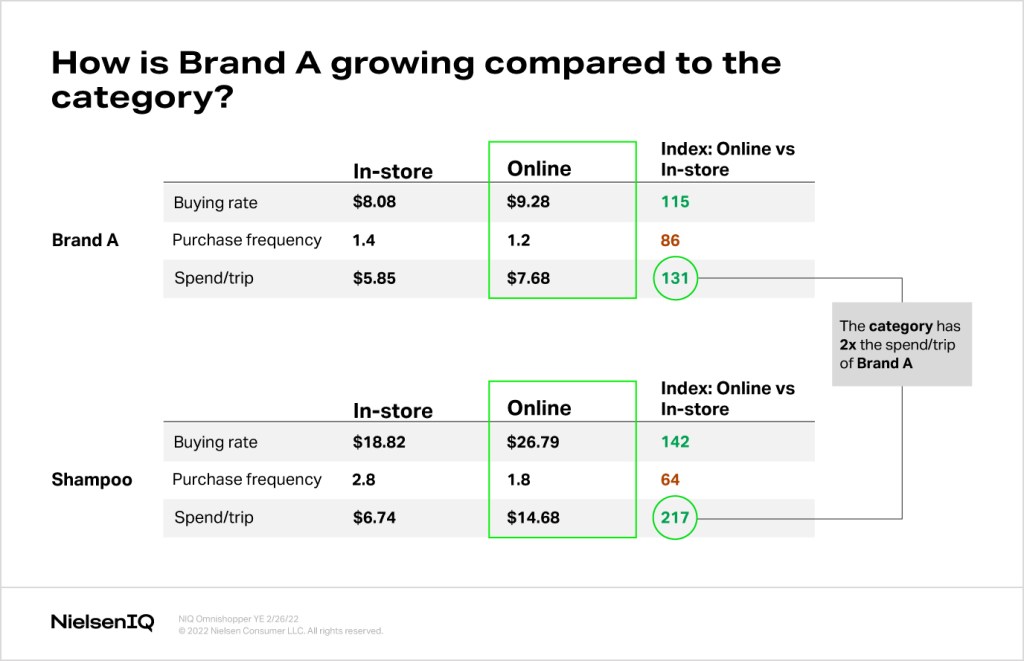
- How does the buying behavior differ online versus in-store?
- Are we leaking to competitors?
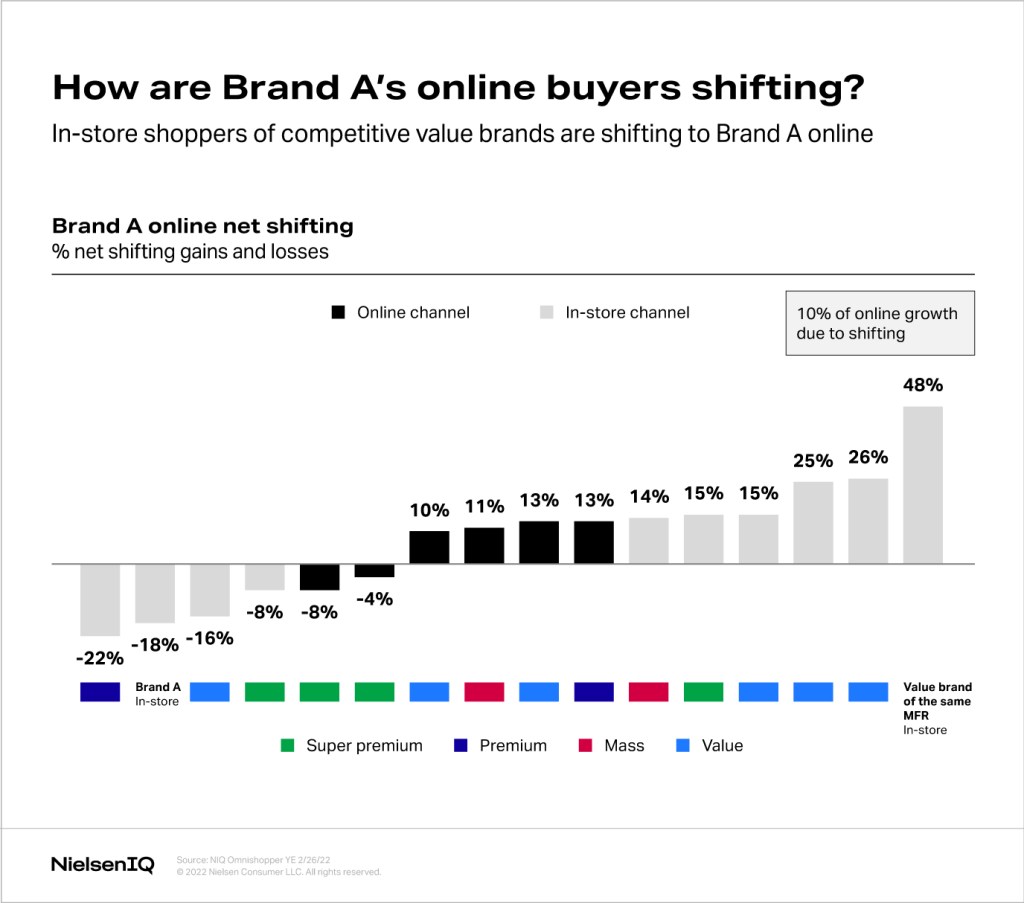
- How are my buyers shifting from in-store to online?
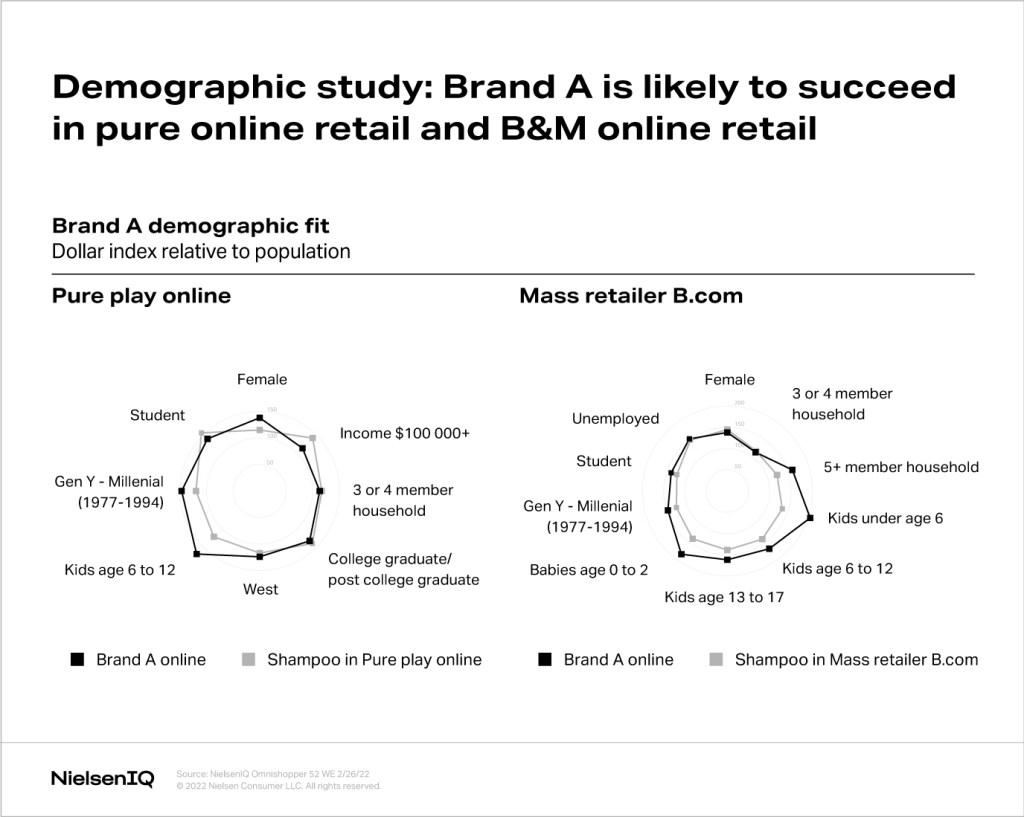
- What are the demographics of my buyers online versus in-store?
- What are the emerging trends in our category?
Omnichannel shopping maintains dominance
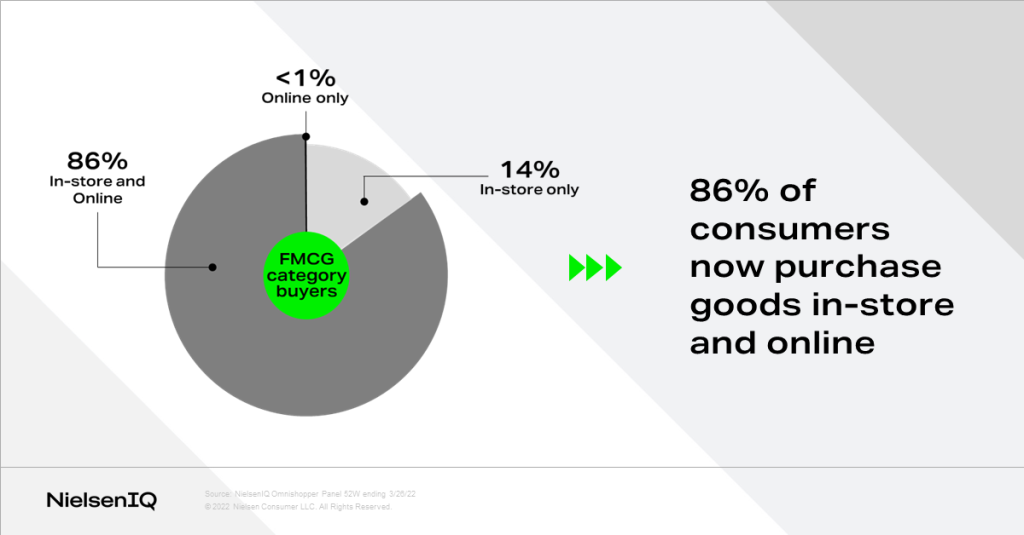
Omnichannel is the rule rather than the exception: 91% of FMCG dollar sales are represented by omnishoppers. Consumers who purchase goods both in-store and online comprise 86% of shoppers, with just 14% of buyers shopping exclusively in-store. Less than 1% of consumers shop exclusively online. Far from being a passing trend, omnichannel is a permanent—and substantial—fixture of consumer behavior.
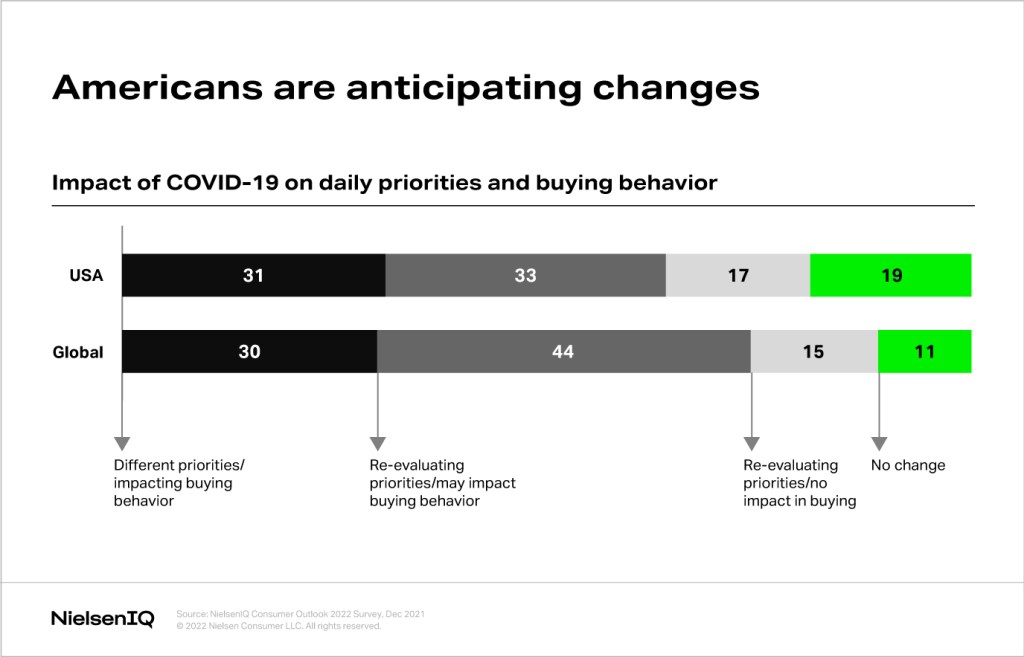
With the industry already experiencing massive transformation, shoppers are anticipating even more changes to their spending decisions. Globally, 30% of consumers indicated that they now have a completely different set of priorities that impact their purchase behavior, and 59% are re-evaluating their priorities. In the U.S., 81% of consumers are re-evaluating their priorities or already have different priorities.
Welcome news for CPG companies is that Americans intend to spend more on groceries, according to NielsenIQ’s Consumer Outlook 2022 survey. U.S. consumers also plan to spend more on in-home entertainment, food delivery and home improvements.
See the total marketplace for your category
With a comprehensive view of the shopper journey and detailed brand, category, and product details you can easily identify new growth opportunities with NielsenIQ Omnishopper
Case Study: Finding the cause of shampoo blues
Let’s look at an example of omnichannel insights in action with a use case, through the lens of a brand manager searching for the underlying cause of one product’s low performance.
The manufacturer of a shampoo brand, Brand A, identified a problem: they were losing sales and market share. They began investigating potential causes, asking a series of questions to uncover irregularities and prioritize the biggest areas of concern:
Are our online sales incremental? A NielsenIQ incrementality report showed that market expansion was significant compared to the category, so it was safe to conclude that the growth was likely incremental.
How does the buying behavior differ online versus in-store? Comparing Brand A’s performance to category performance revealed a significant difference that prompted further investigation. Although 20% of shampoo shoppers bought online, just 8% of Brand A’s shoppers were. Was there an issue with buyers of the brand not converting online?
To take a deeper dive into the behavior of their online buyers, Brand A examined online purchase frequency and pricing data, two of the biggest triggers from an online standpoint. The shampoo category had almost double the spend rate of Brand A. The purchase frequency for the category had also significantly decreased. These changes aligned with the broader trend of larger pack sizes and multi-packs being offered, and Brand A’s lagging numbers warranted further investigation.
Are customers leaking to competitors? A review of omnichannel consumer panel data showed that Brand A’s performance was just half a percent below category performance, so leakage to competitors was not a significant or urgent problem to address. The manufacturer’s investment of time and resources would be better allocated elsewhere.
See where your customers are leaking
Increase your wallet share by clearly seeing and fully understanding your customers’ movements across categories, brands, and retailers.
How are my buyers shifting from in-store to online?
Omnishopper data showed there had been gains in mass and value brands, but the largest gains by far had come from another brand the manufacturer owned. If it had been part of the manufacturer’s promotion strategy to upgrade shoppers to a higher-tier brand, they succeeded. However, if the push was unintentional, then the manufacturer had inadvertently cannibalized its own products.
What are the demographics of my buyers online versus in-store? Some manufacturers believe that they cannot compete in pure play online or mass retailer dot coms. But a demographic study can help brands determine whether they can perform well in this channel. Omnishopper data showed that Brand A was likely to hold its own.
What are the emerging trends in our category? The manufacturer also examined which individual attributes drove online purchases, discovering that Brand A was missing from over 160,000 customer searches because it was only claiming one of the top seven most-searched attributes, “Repairing/healing.”
It was estimated that Brand A’s missing (but claimable) attributes resulted in 945 million missed impressions. Assuming a conversion rate of 12% and a unit price of $4.85, this resulted in an estimated $550 million in missed revenue. Even a conversion rate of 6% would indicate missed revenue of $275 million—revenue easy to capture by pulling a few simple levers.
While many external and internal factors influence each brand’s decision around which attributes to emphasize, omnichannel insights like these help them make informed decisions that best align with their goals, strategy, and desired outcomes.
Finding your footing in a shifting landscape
The omnichannel landscape is increasingly difficult to navigate, with a bevy of challenges standing between CPG companies and consumers’ new expectations. Succeeding in this evolving environment requires using tools built to measure omnishopper behavior, providing a comprehensive view of customers across in-store and online channels for a deeper understanding.
Develop your 2023 plan with a total view of shopper behavior
With NielsenIQ Omnishopper you can capture consumer purchases across online and offline channels for a complete view of the changing omnichannel behaviors.