Welcome to your strategic guide to 2026
Caution is the new normal
The global outlook for 2025 saw a shift from cautious to intentional consumption. For 2026, continued volatility has deeply ingrained a lingering caution into consumer psychology, which is impacting spending.
Still, areas of opportunity and growth remain amid this emotional battleground. In this analytical assessment of the state of consumers, we’ll help equip you to win with cautious yet hopeful consumers over the next 12 to 18 months—and beyond.
As always, NIQ’s Consumer Outlook report marries survey and purchase data to deliver the most comprehensive outlook possible. We uncover the divide between what consumers say and what they do, along with disruptions impacting the retail industry.
Caution may be the new normal, but our Consumer Outlook: Guide to 2026 gives manufacturers and retailers the insights and takeaways they need to not just keep pace with—but stay ahead of—whatever comes our way in the year ahead.

Chief Communications Officer & Head of Global Marketing COE, NIQ
Marta Cyhan-Bowles is Chief Communications Officer & Head of Global Marketing COE at NIQ. A proven marketing and communications leader, Marta specializes in guiding teams toward long-term customer success through data-driven rigor and a personal bias for innovative campaigns that captivate, engage, and ultimately drive measurable growth. As head of the Global Marketing COE, she leads the charge in unifying the global team at NIQ across communication and thought leadership efforts to unlock transformational value for C-suite leaders across the retail and manufacturing sectors.
Key takeaways
- Consumers are numb to volatility—confidence is misleading. Shoppers have adapted to constant shocks, which makes them feel more confident even though their financial realities haven’t changed. Inflation, everyday expenses, and borrowing costs still squeeze wallets, making volatility a semi-permanent condition leaders must plan around.
- Spending is intentional—every purchase has to earn its place. Shoppers reward retailers and brands that deliver trust, personalization, and convenience. ESG and sustainability are table stakes; today’s consumer wants tangible benefits that simplify their life and align with their values.
- The pricing playbook is over for now. Consumers are tapped out and won’t accept more price hikes. Growth depends on volume—capturing trips and baskets through sharper assortments, innovation, and private label strategies that stretch limited discretionary dollars further.
- Retailers are the new media moguls. Retail media networks (RMNs) are reshaping commerce, blending shopping with advertising at shelf, on apps, and across digital touchpoints. For consumers, RMNs deliver real benefits: personalization, convenience, and loyalty rewards, while forcing retailers and manufacturers to rethink how they scale.
- Private label remains a loyalty lever. Store brands are no longer the “cheap option.” They’re often where shoppers see the best value without compromise, giving retailers margin while pressuring national brands to prove they still belong in consumers’ baskets.
- Commodity volatility is fueling consumer-first innovation. Ingredient price swings—from cocoa to eggs to coffee beans—are forcing reformulation, but they’re also opening doors. Manufacturers that pivot fast with alternatives (e.g., vegan egg replacers that don’t sacrifice on taste or quality) can deliver affordability, functionality, and trust all at once.
- Seamless commerce is the next frontier. Social commerce, quick commerce, and RMNs are converging into one ecosystem. Consumers expect frictionless, personalized, and instant shopping pathways—raising the bar for retailers and manufacturers to deliver everywhere, all at once.
Want to read later?

Chapter 1: State of consumers and economic uncertainty
Spending caution is now baked into household economics
Inflation-driven austerity is fading, but consumers are wary of another “rebalancing.” Across income brackets and geographies, economic and political volatility are driving caution among consumers.
With trust in long-term stability low, consumers are adapting to volatility as the new normal. They are looking to brands for emotional reassurance as much as they are for affordability.
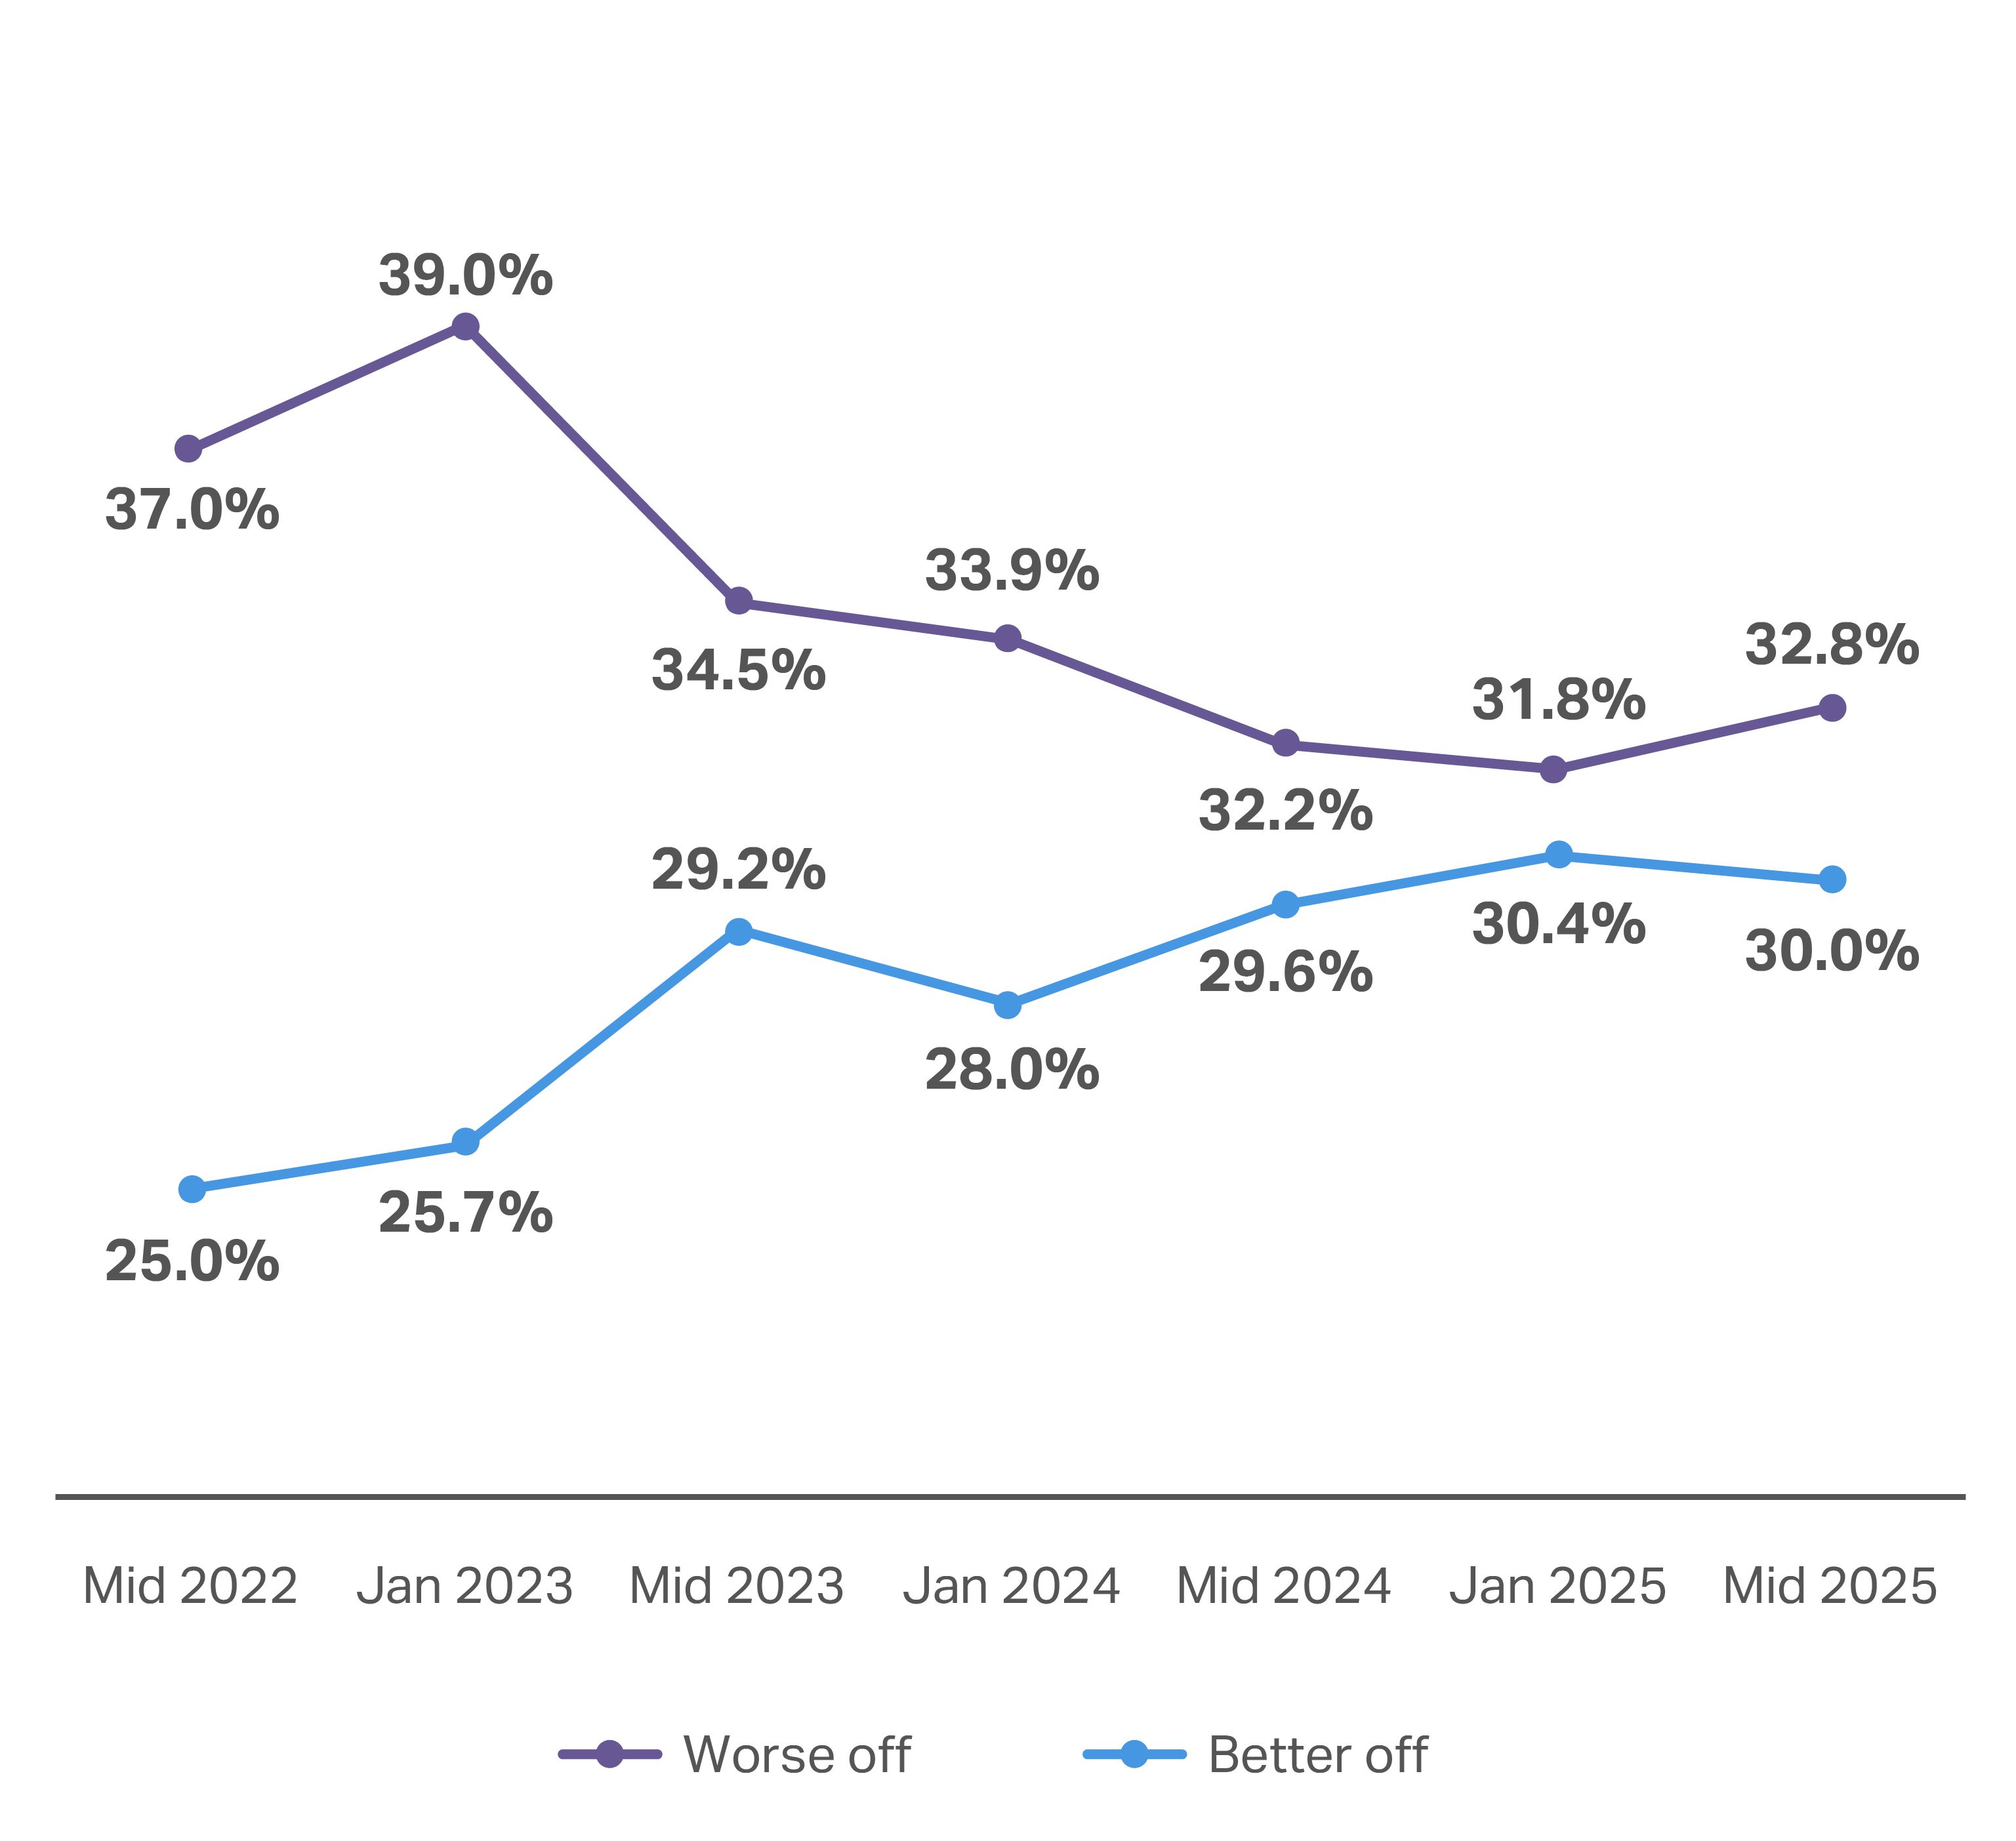
While consumers are largely in the same financial position they were last year, they’re feeling much better about their positions.
30% of global consumers say they’re in a better financial position than they were a year ago—up 0.4% from July 2024
32.8% say their financial position has worsened in the past year—up 0.6% from July 2024
+4% US dollars spent per trip ($36 per household per trip)
+1% US shopping occasions per household (roughly 294 trips per household per year)
Global consumer sentiment remains relatively unchanged year over year
Consumers who said in 2025 that they were “better off” than a year ago remained consistent with 2024’s mid-year survey results. There was a nominal uptick (0.6%) of global consumers reporting they were “worse off.”
Even in the US—a market that has shown lagging optimism—the number of respondents who said they were “much worse off than a year ago” dropped by over half, to just 8.5% between July 2024 and today. This shift in positivity in the US has resulted in a 4% increase in average spending on FMCG products. However, the average number of items purchased per trip remains largely flat.
Compared with a year ago, is your household better or worse off financially?
Of the consumers who report feeling “worse off,” most (73%) attribute their financial situation’s decline to increased costs of living. Economic slowdown (39%) and job insecurity (30%) are the other major factors influencing this consumer sentiment. Consumers report feeling slight relief from all these pressures (vs. last year), but the number concerned about the impact of “geopolitical conflict” rose from 12% to 14%.
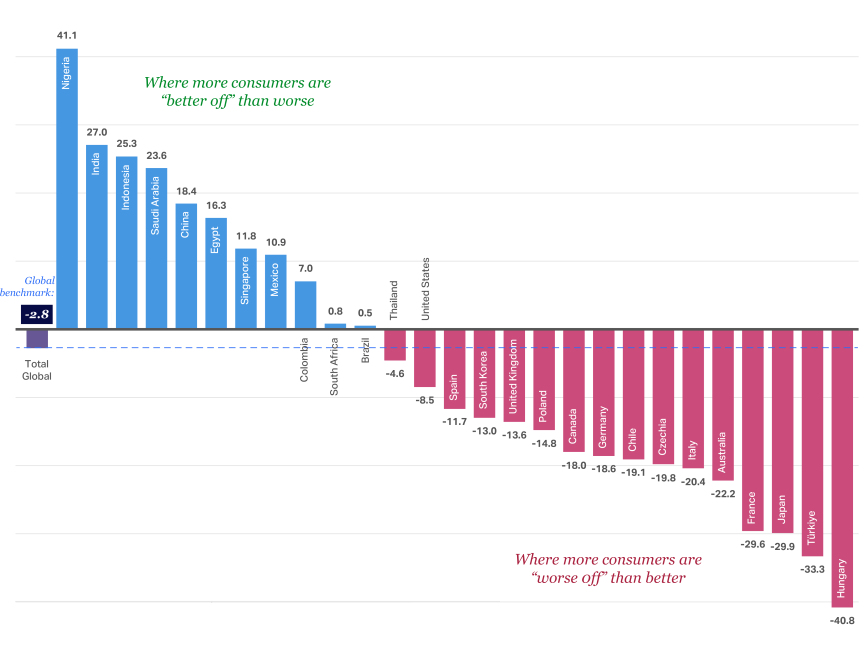
While optimism in many North American and European Union (EU) markets has risen over the past year, these markets still have more “worse off” consumers when compared with other large markets, such as India and China. Türkiye, Chile, and Australia also continue to struggle, with more consumers feeling “worse off” in 2025 (compared with 2024).
Optimism around financial situation varies widely by region and country
Top concerns setting the spending tone for 2026
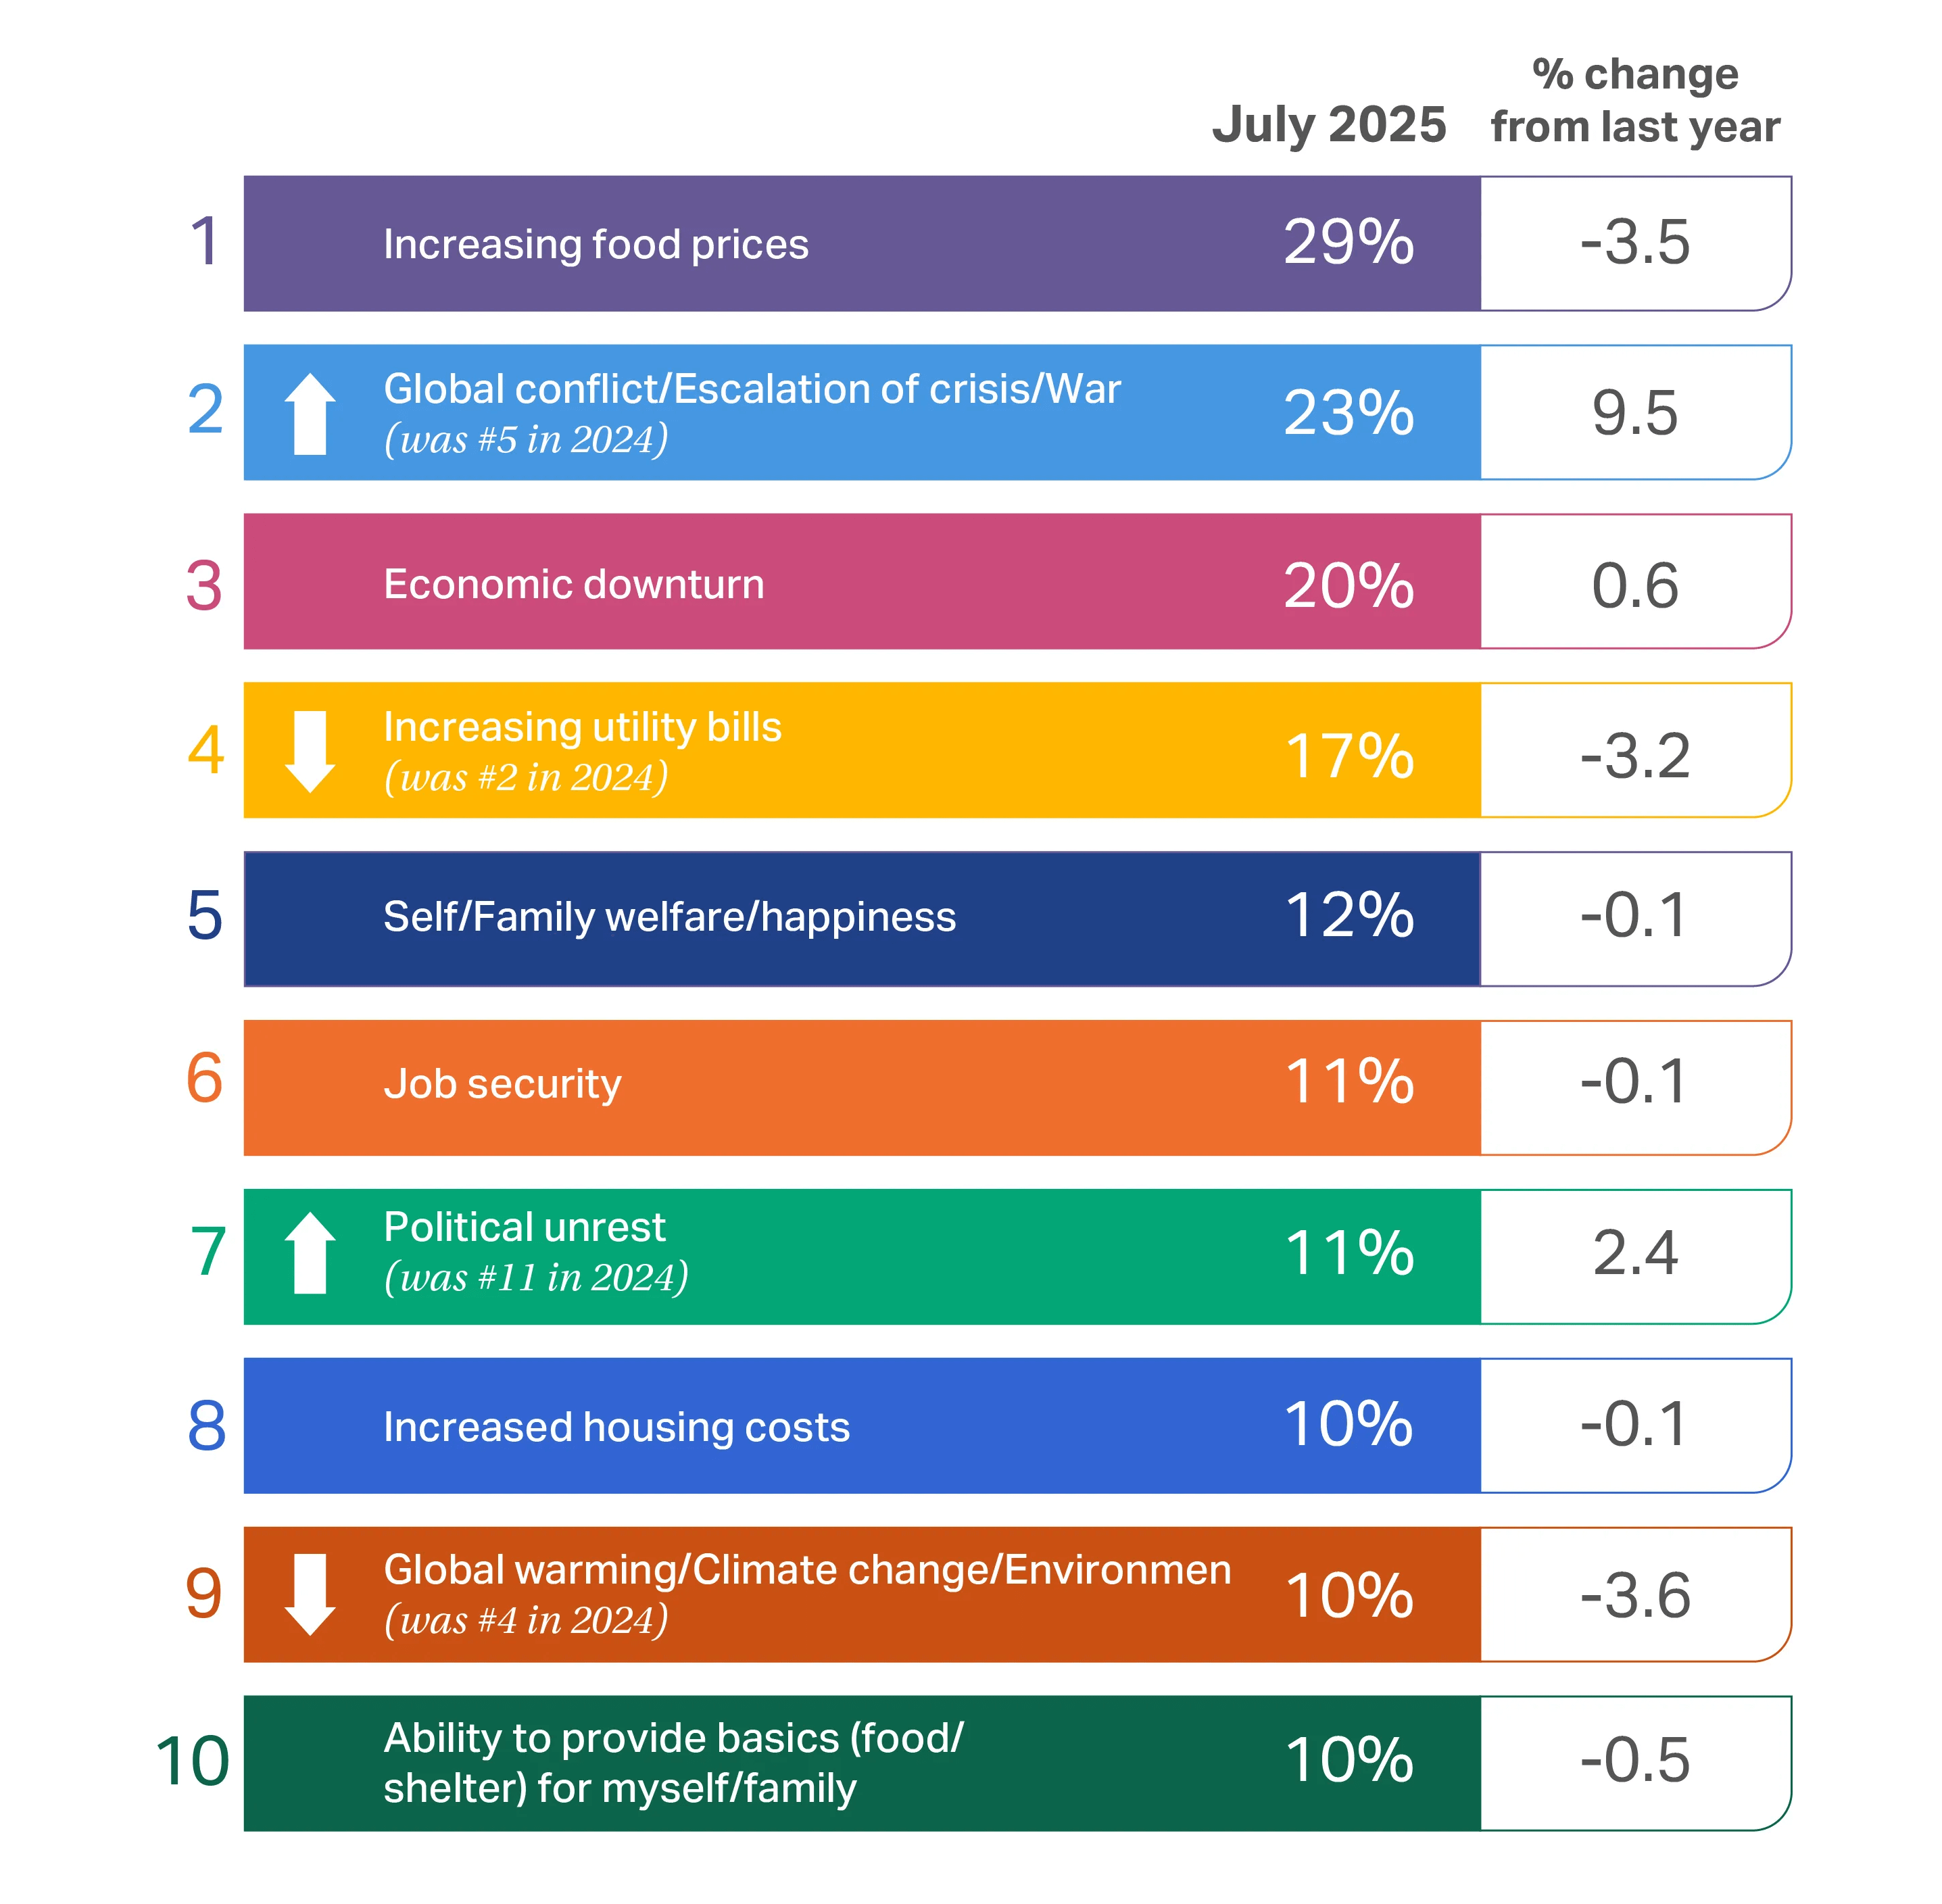
Inflation continues to be an issue for global consumers, who remain deeply concerned about rising food prices and a potential economic downturn.
As reported last year, consumers are worried about the cost of utilities, their welfare, and job security. Though they continue to spend, lingering high prices, tariffs, and elevated interest rates mean consumers must continue to make hard choices.
While many consumer concerns remained relatively consistent year over year, we do see some notable shifts in the overall consumer rankings going into 2026. Last year, consumers reported increasing concern over global warming and the environment—landing this concern at #4. This year, it barely made the top 10, coming in at #9.
Conversely, global conflict and war has risen from #5 to #2, up 9% from just a year ago. Political unrest has also joined the top 10, at #7—up 2.4% from last year. With persisting, escalating geopolitical conflicts, it’s no surprise that these issues are top of mind, especially when said conflicts have had severe economic impacts.
A noteworthy potential source of relief for the global consumer is an International Monetary Fund (IMF) prediction that global inflation will cool from 4.2% in 2025 to 3.6% in 2026. IMF also forecasts that global GDP will grow to 3% in 2025 and 3.1% in 2026. These numbers are far from guaranteed, however, given the uncertainty across global markets, but they do show that financial conditions appear to be easing despite consumer trepidation.
Consumption drivers
The compounding effect of inflation
Consumer packaged goods (CPG) inflation cooled each month from early 2023 into 2024 but remained higher than the global average in some regions. Notably, from May 2024 to May 2025, it has begun creeping upward again—by 0.3%.
Taking a Full View™ into the state of the CPG industry
After declining ~8% last year, the pace of CPG inflation has begun to creep upward year over year.
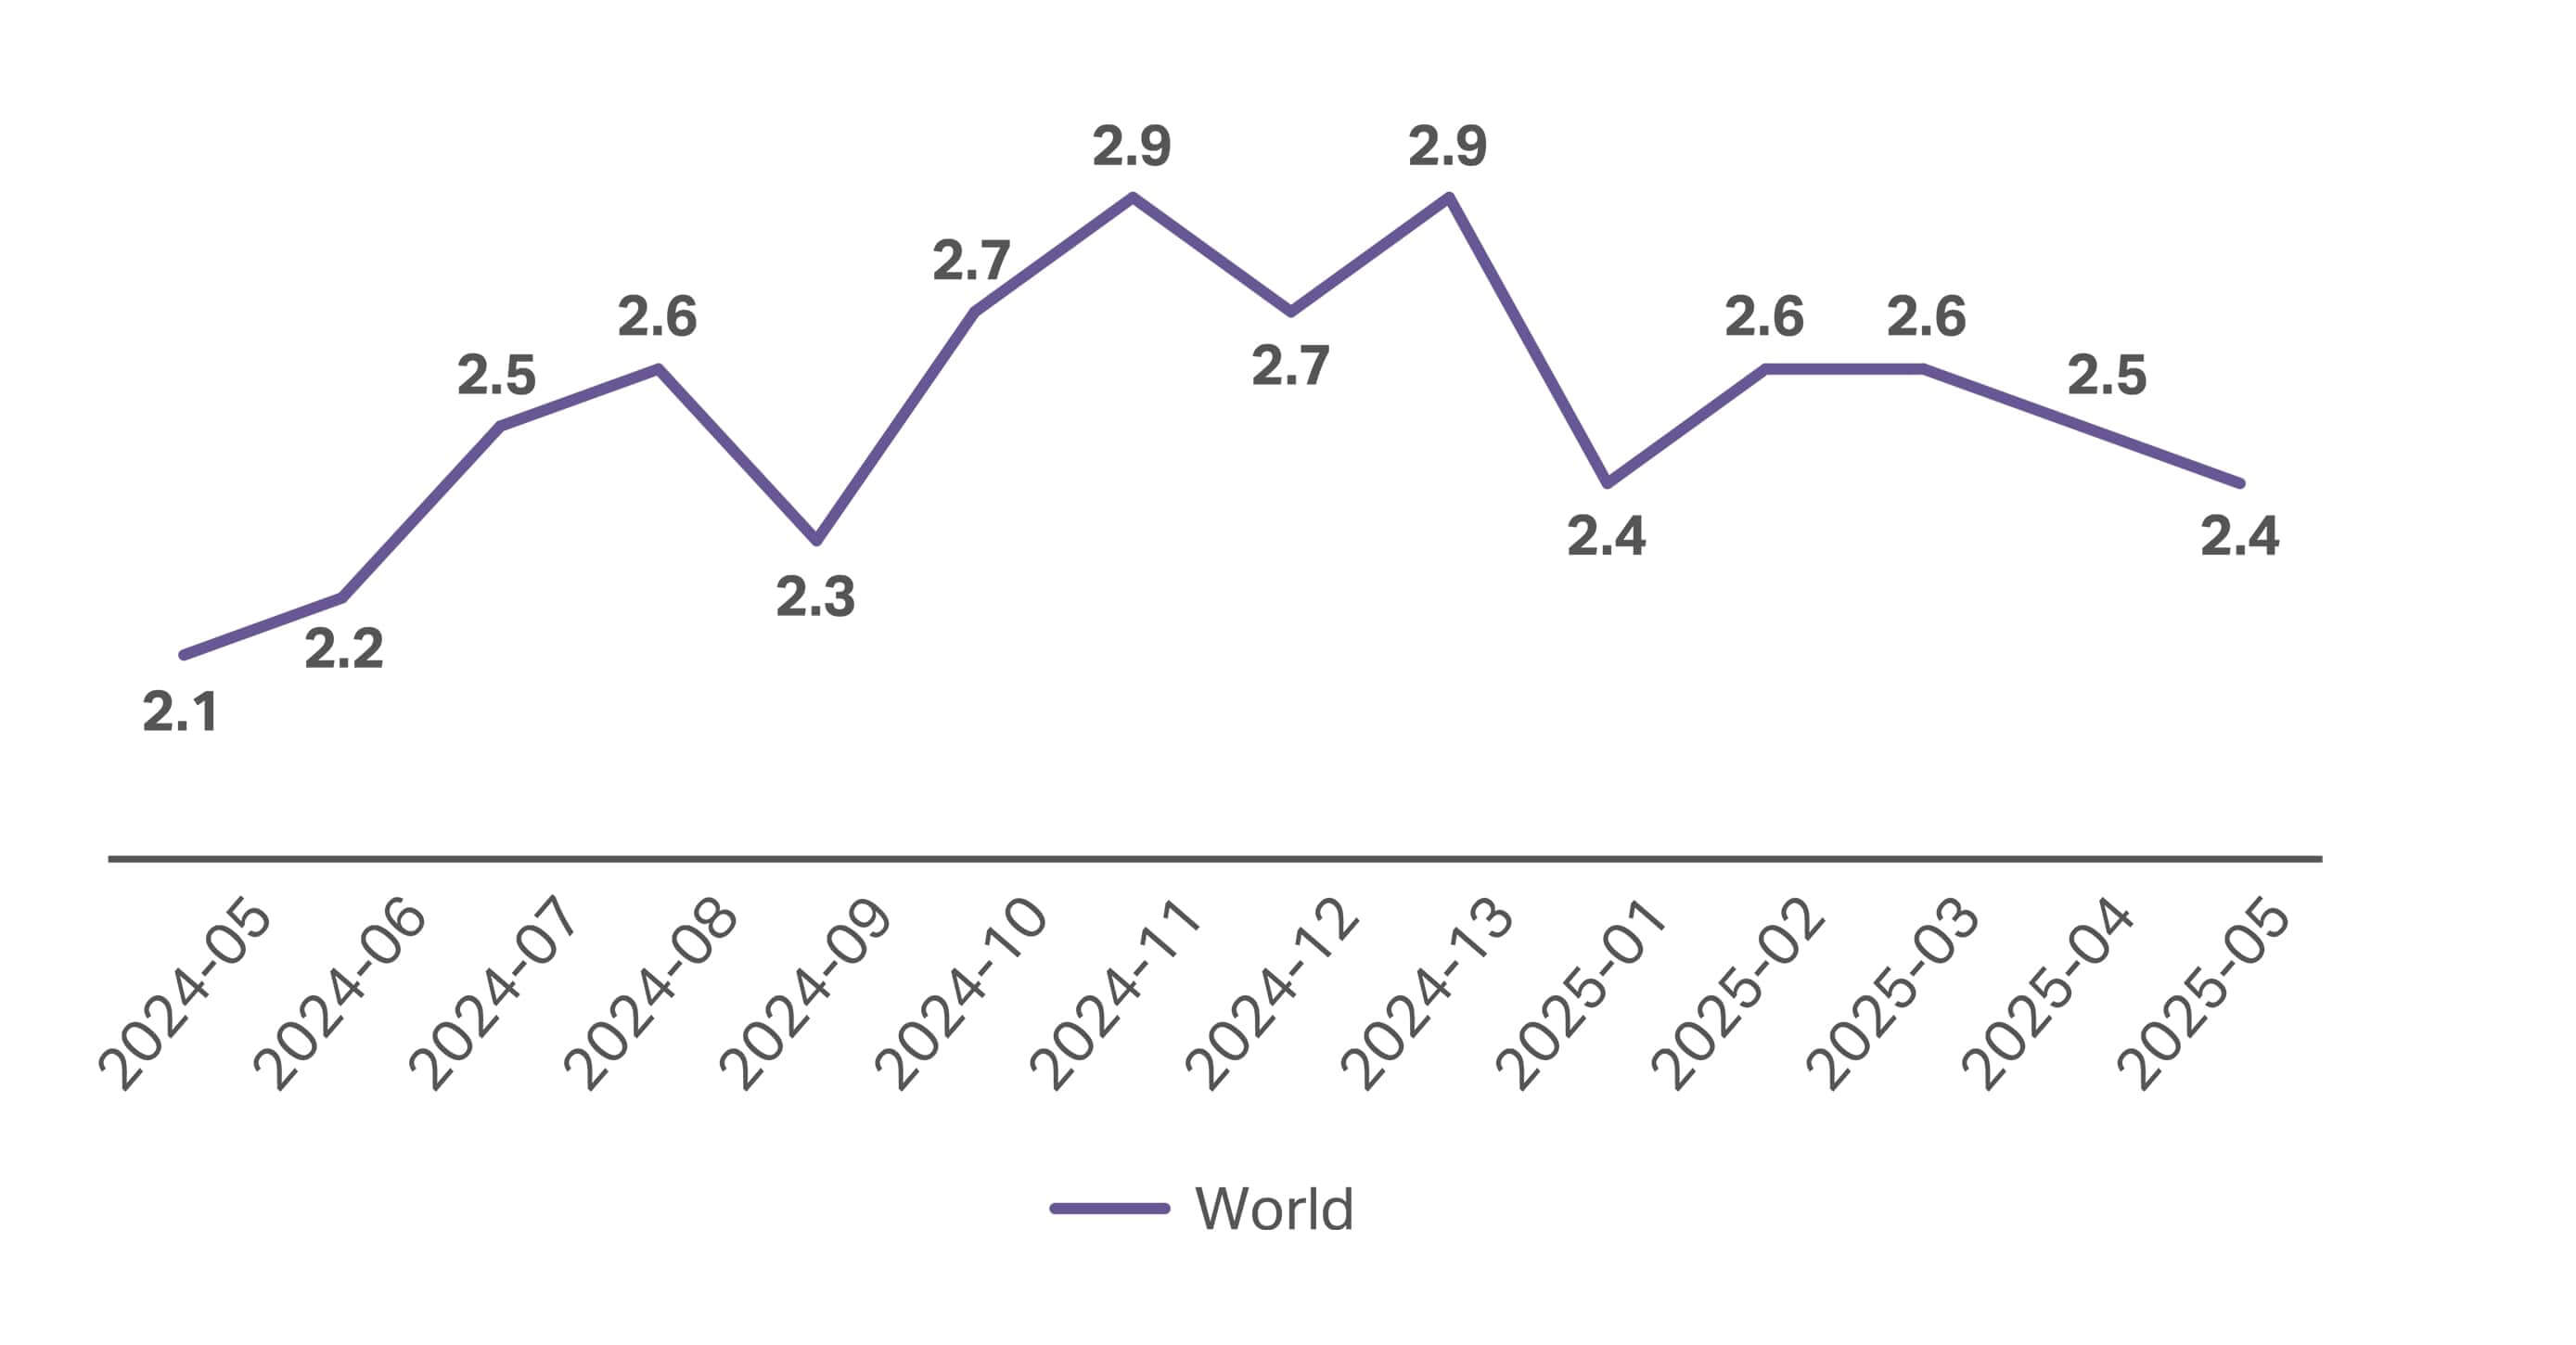
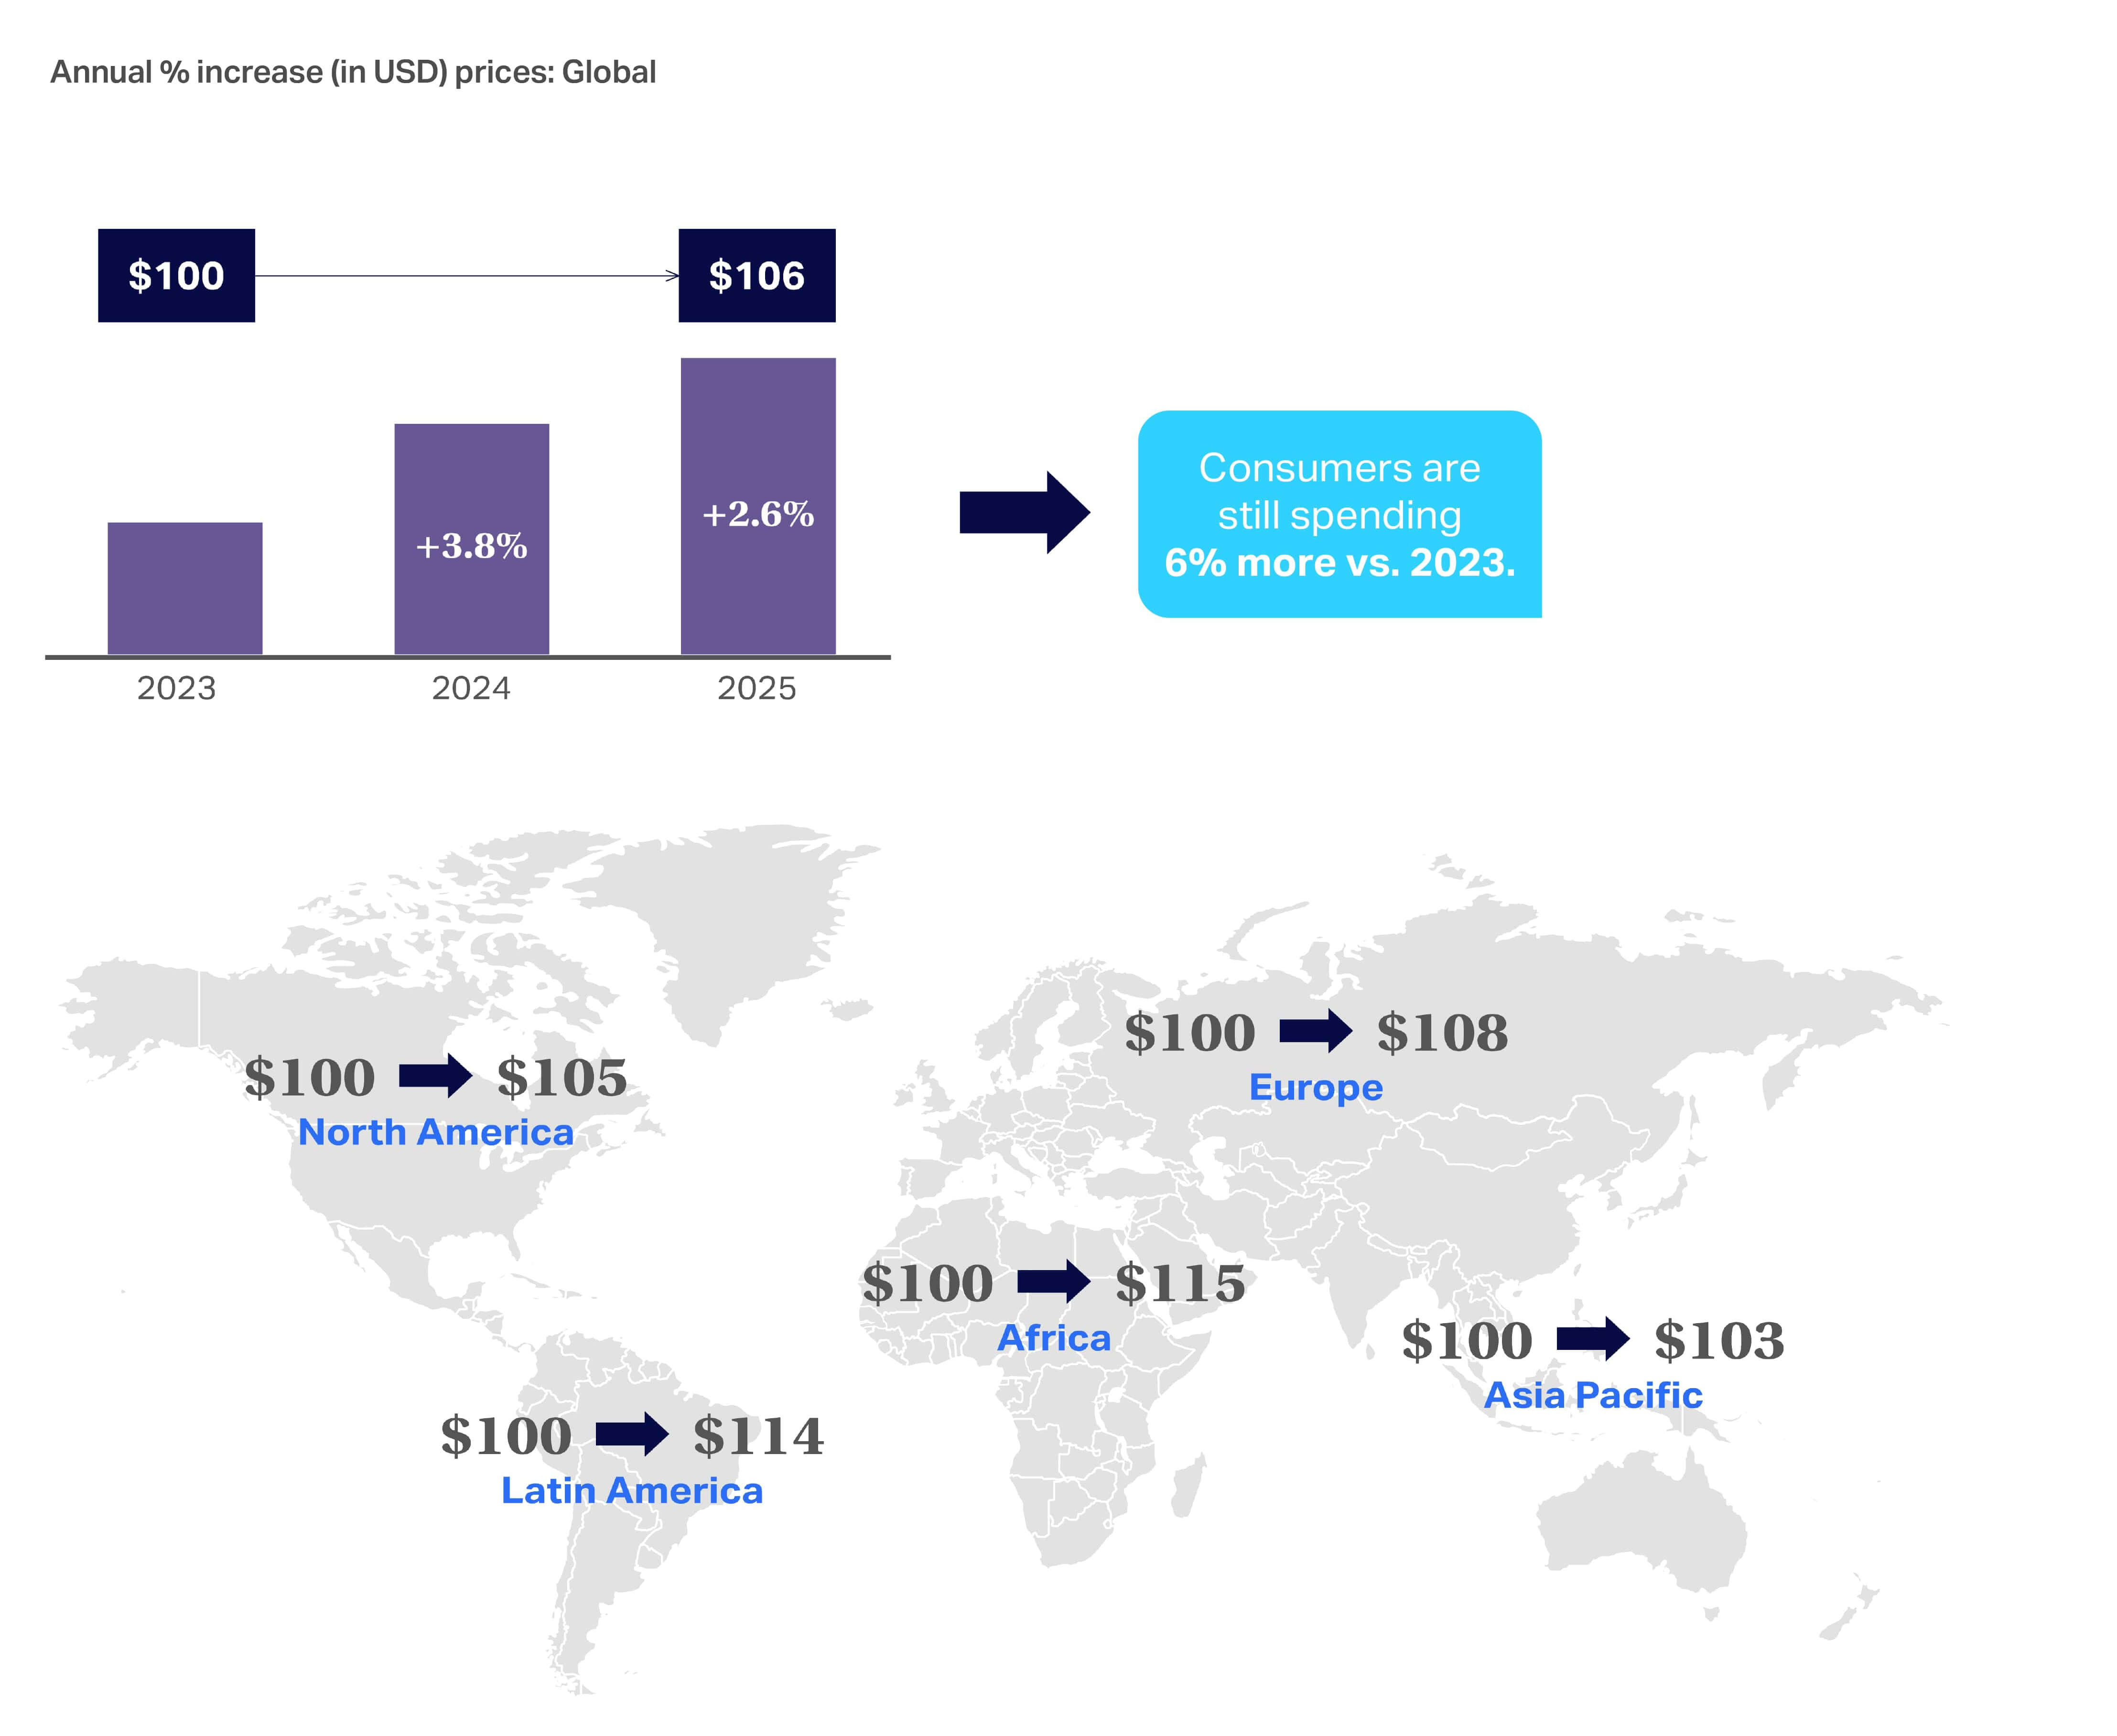
Consumers continue to feel the effects of inflation, spending $106 today for what would have cost them $100 in 2023. Although the rate of global inflation has dramatically declined since its 2022–2023 peak, in June 2025, regions such as Latin America were experiencing inflation of 6.6%—more than double the global average, which was below 3% at that time.
Elevated prices are squeezing consumer wallets and reinforcing that we are in a long-term recovery period
Though many indicators skew positive this year (vs. 2024), the lingering question of tariffs and their impacts on the cost of CPG items adds another level of uncertainty as we move into 2026.
Global growth persists, but shows signs of softening heading into 2026
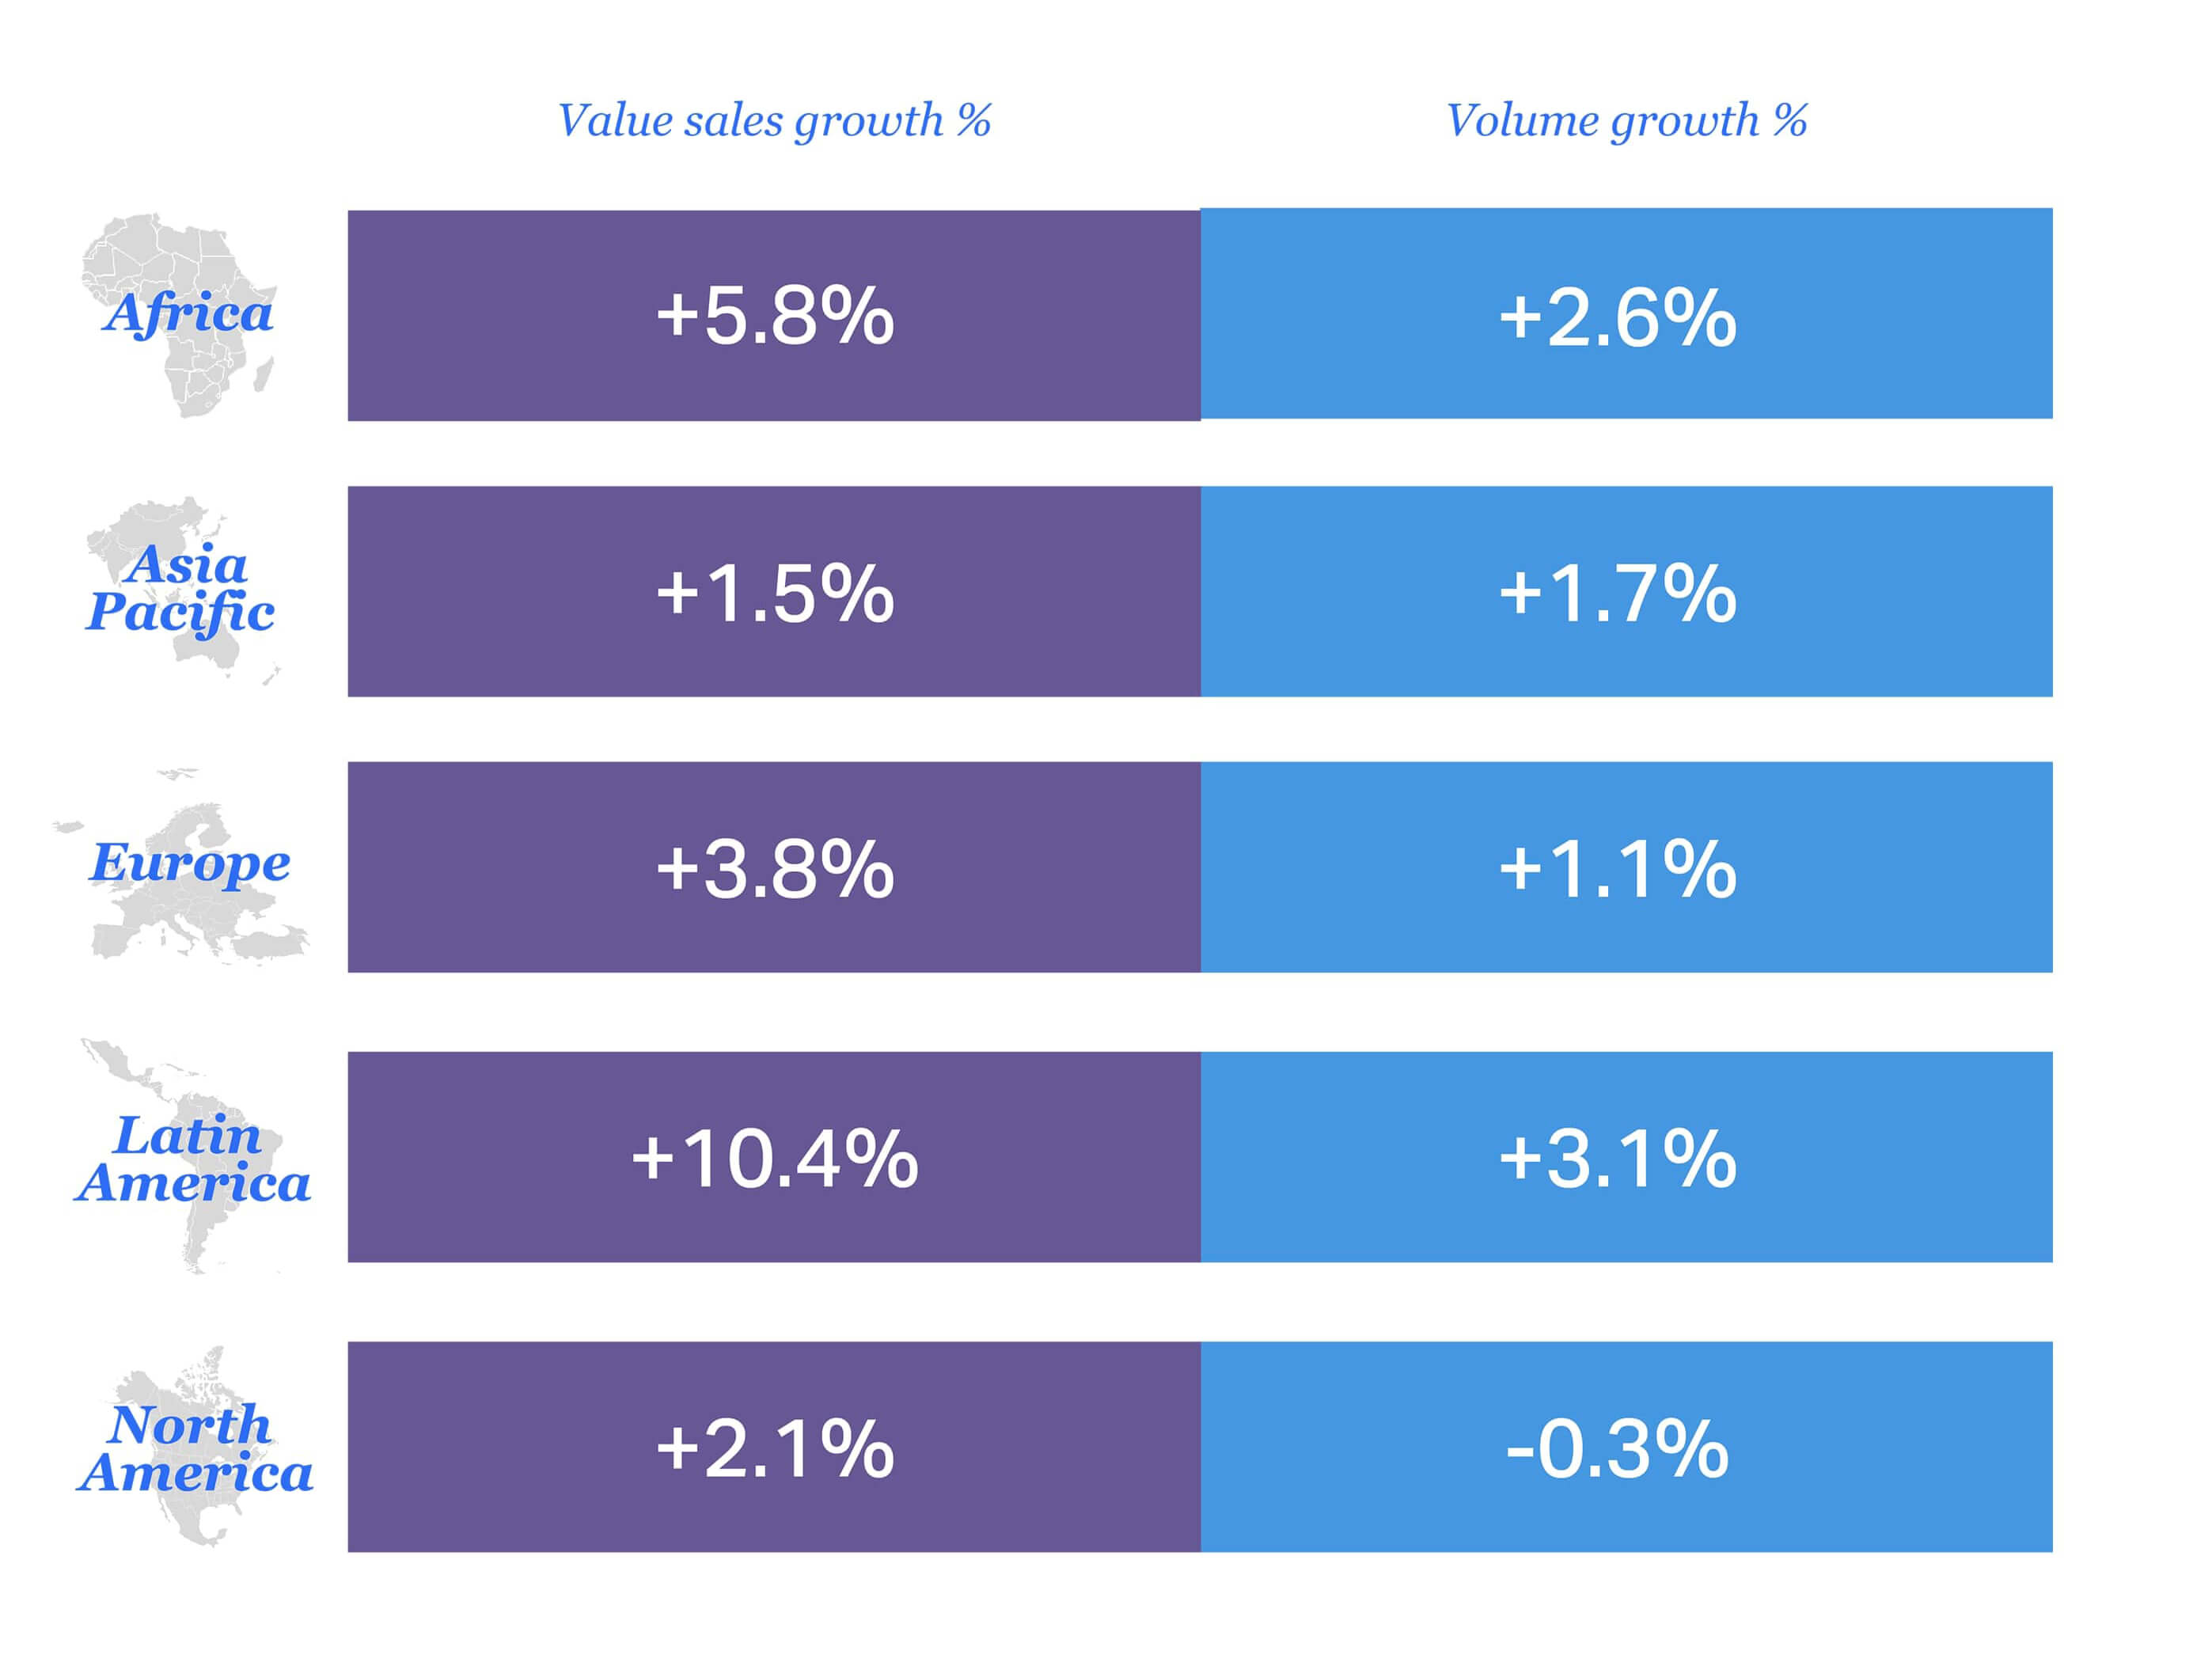
Global FMCG trends, 2024 vs. 2025:
- Value sales growth: +3.5%
- Volume growth: +0.9%
Looking across the global CPG landscape, value sales growth has slowed from 2024 to 2025 vs. the previous period. However, it still sits at 3.5%. Volume growth remains consistent with the previous 2023-to-2024 period.
Value growth in both Europe and Africa has slowed as inflationary pressures have eased, but high inflation in Latin America drives the market’s 10.4% value sales growth.
Global heat map of price growth by category
Prices remain elevated, but several categories saw inflation cool in 2025.
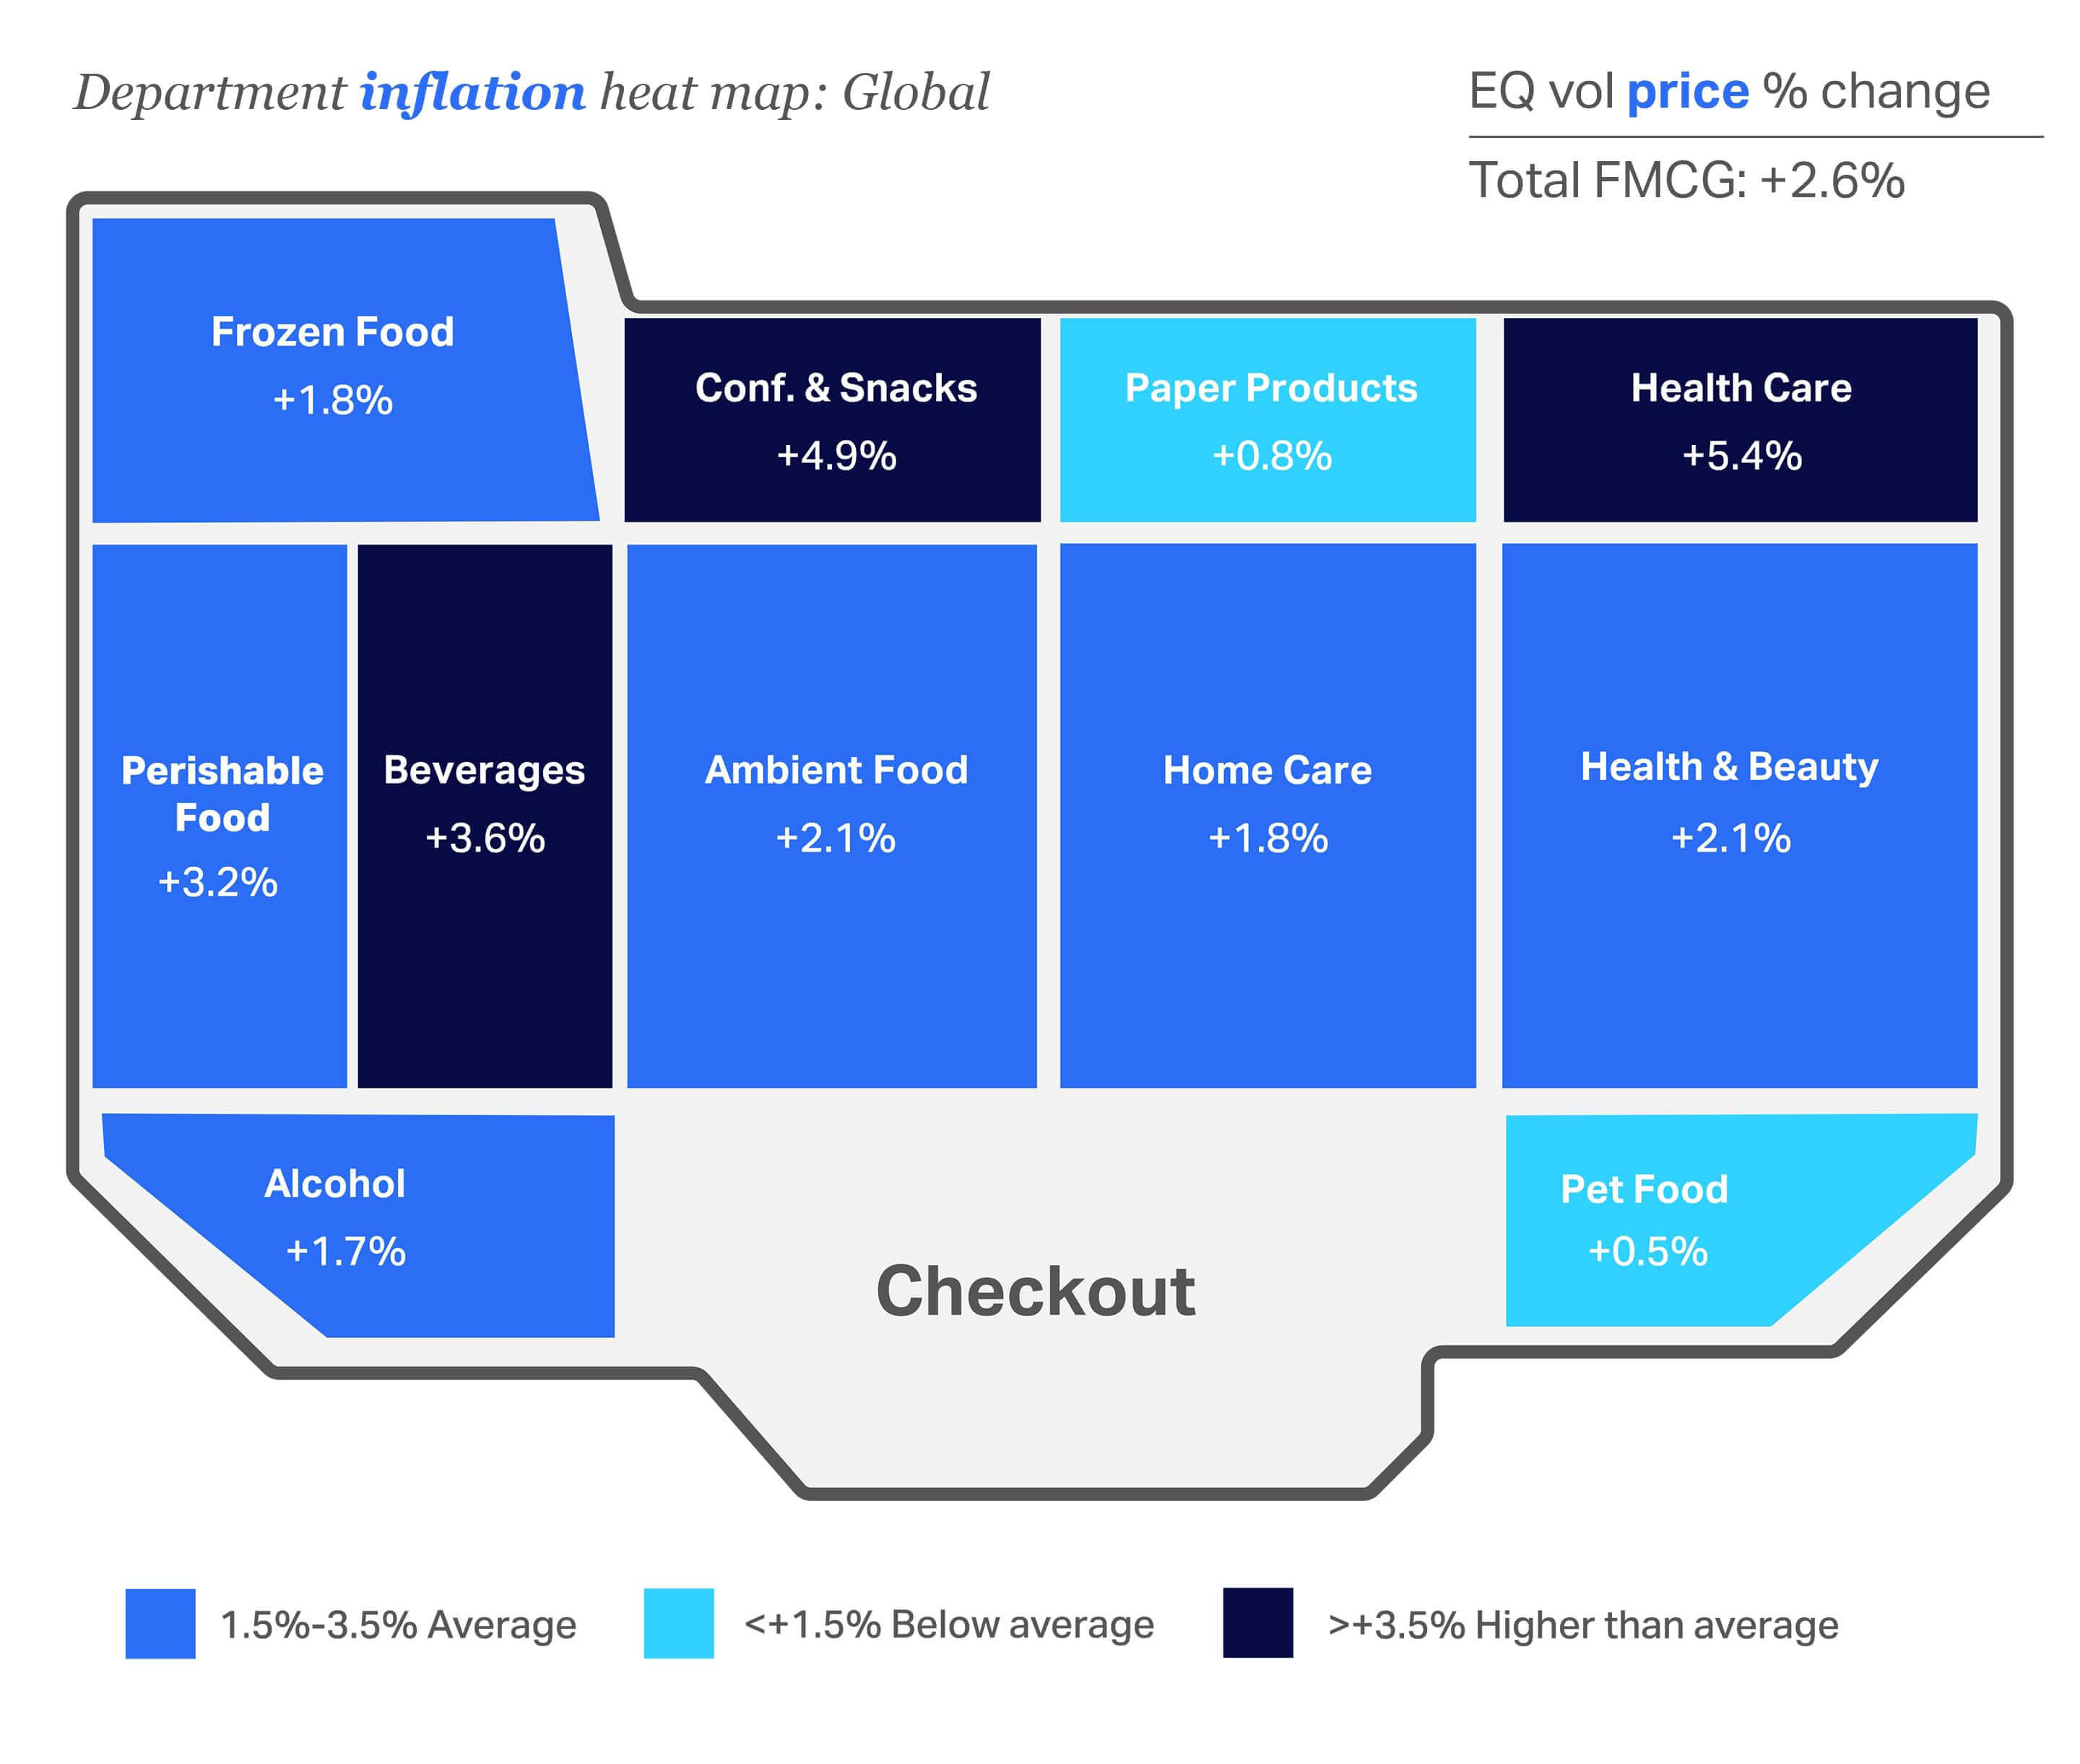
This global-level heat map of purchase categories confirms that inflation has cooled across the store for many categories but still lingers above this year’s total FMCG average of +2.6% in a few key areas of the store. Health Care (+5.4%), Confectionery & Snacks (+4.9%), and Non-alcoholic Beverages (+3.6%) saw the highest rates of inflation in 2025.
This year’s data only tells one part of the story, however, and it’s important to understand which categories saw the most relief from inflation over last year. Categories that saw the biggest positive impacts from cooling inflation in 2025 were Pet Food at 0.5% (down from 6.5% in 2024), Home Care at 1.8% (down from 7.6% in 2024), and Health & Beauty at 2.1% (down from 6.0% in 2024).
With average price growth for FMCG at 2.6% in 2025 (down from 4.1% in 2024), brands and retailers must execute strategically relative to selling higher volumes to offset declining value growth.
Global heat map of volume growth by category
Volume growth continues to favor Health & Beauty and Perishable Food
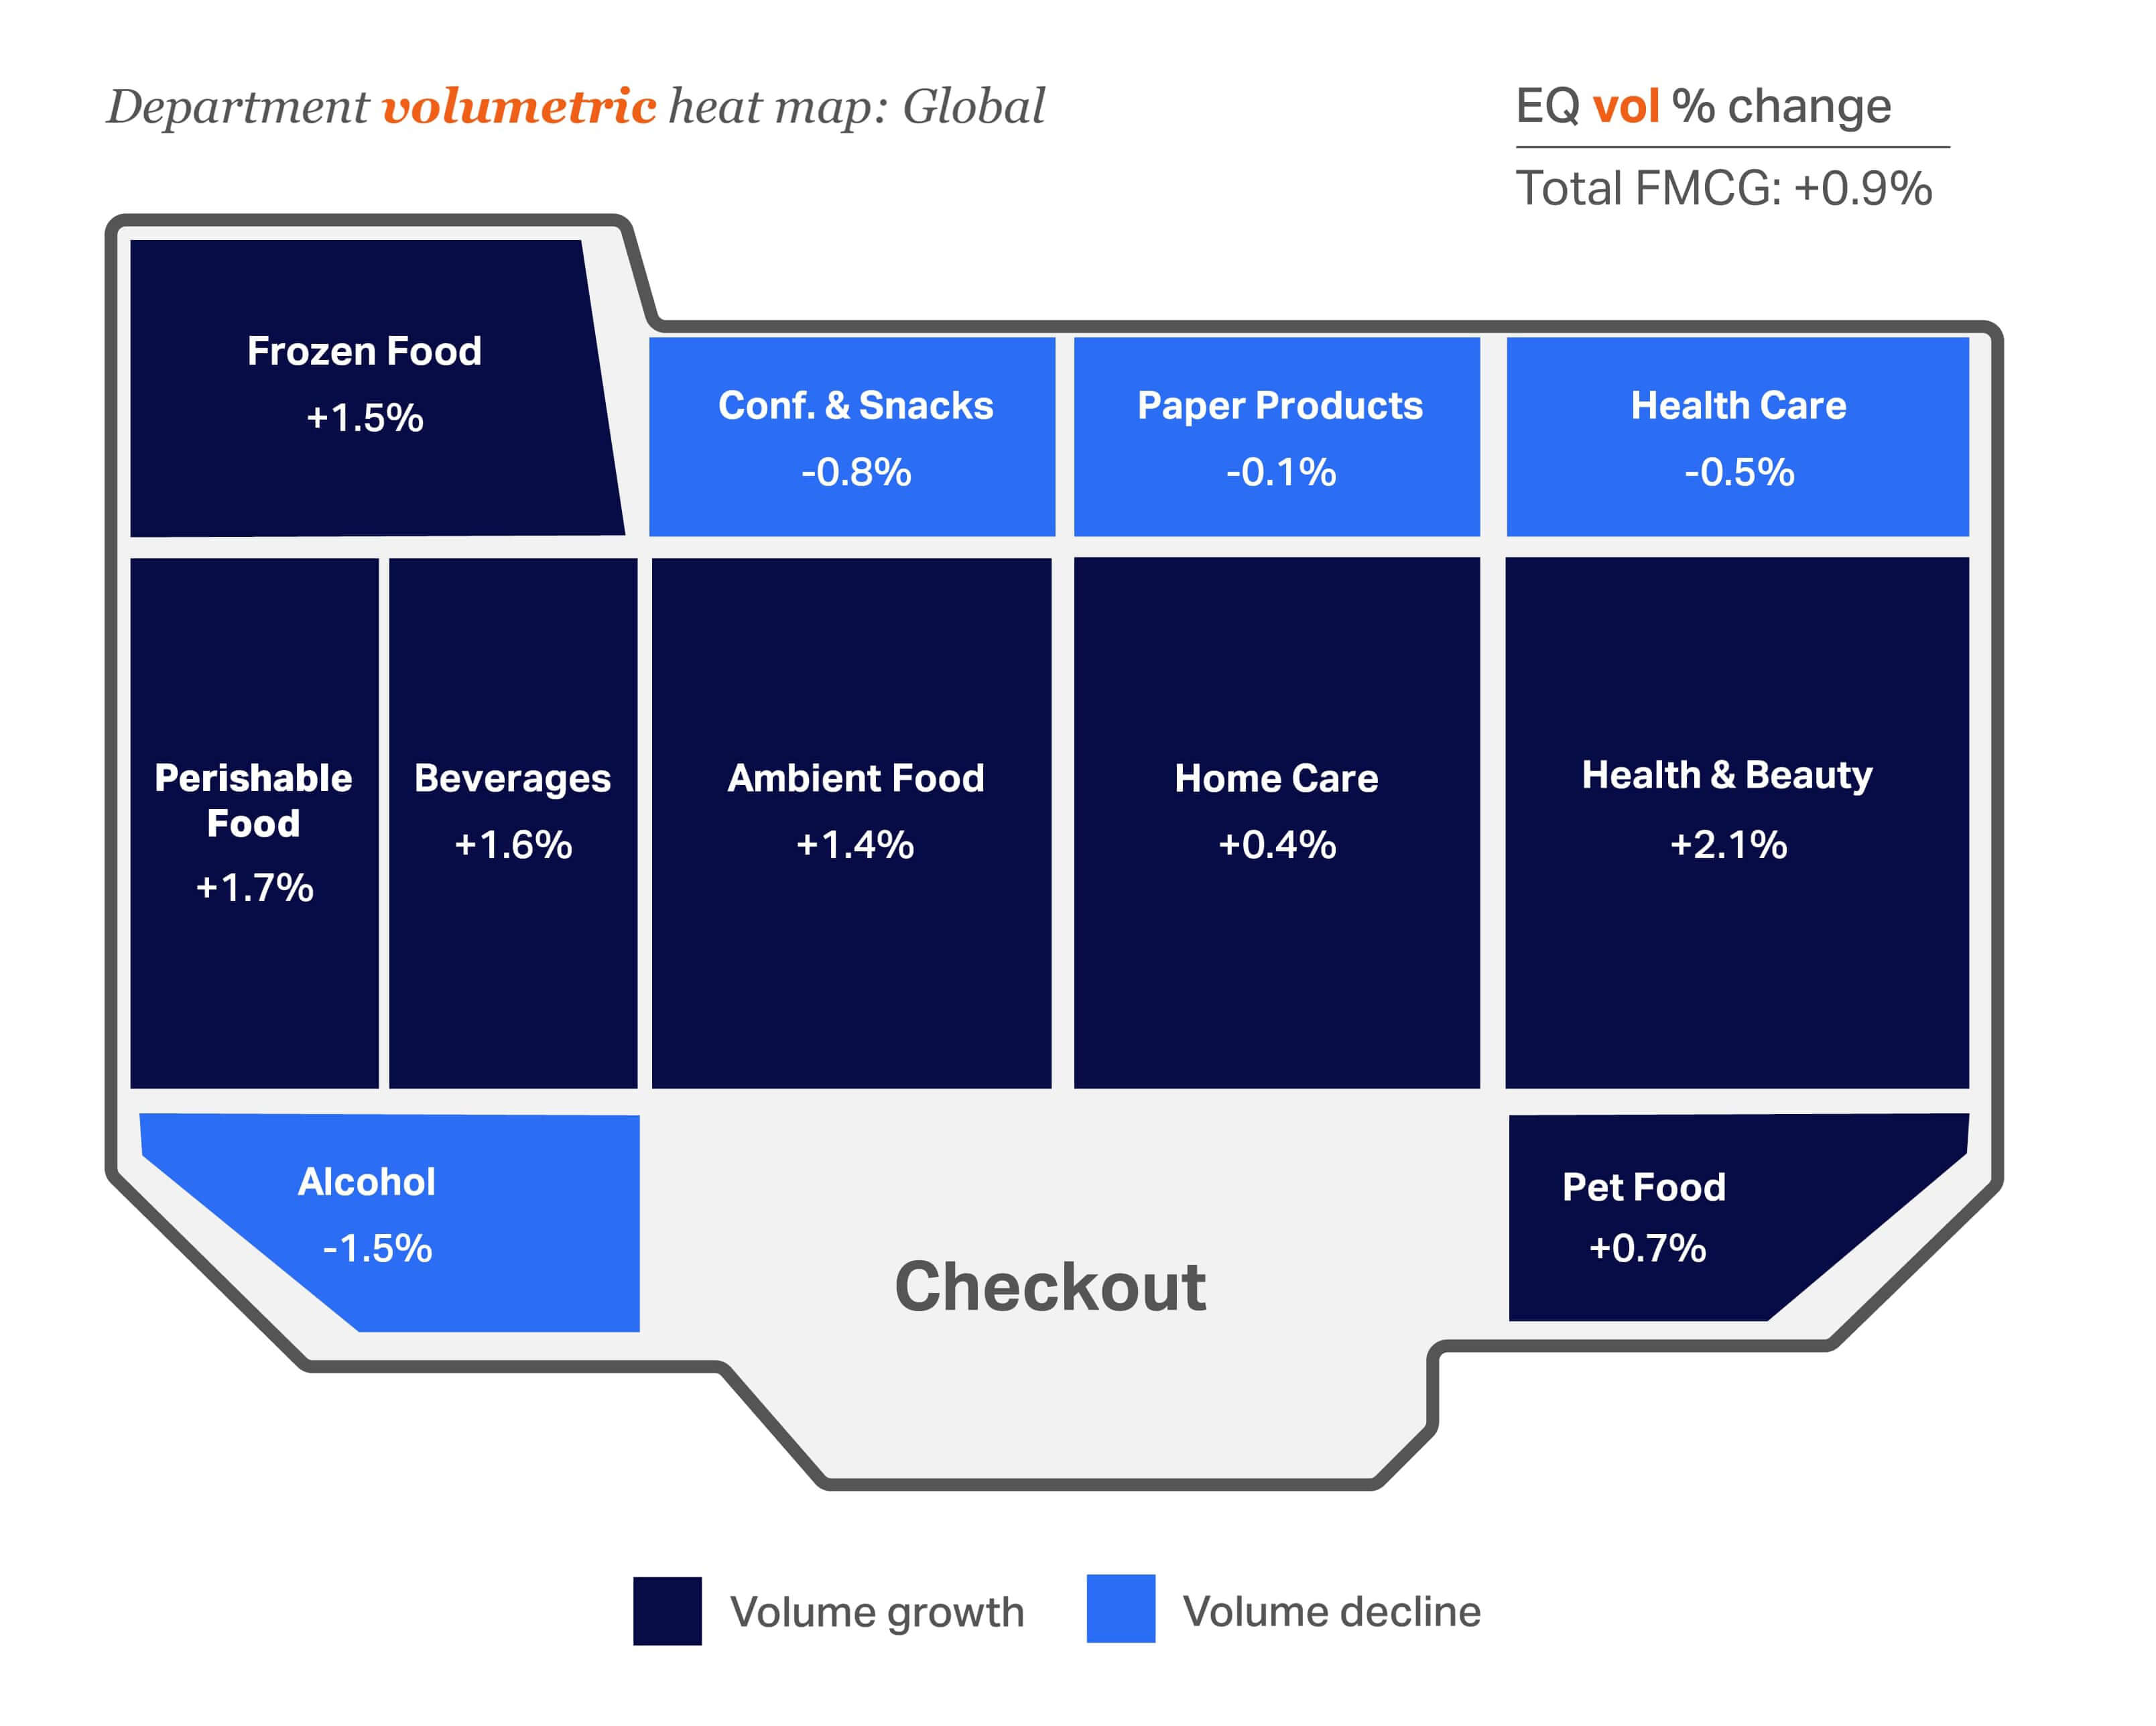
A look at volumetric growth compared with a year ago helps tell a fuller story. While total FMCG volume change (+0.9%) is consistent with last year (+0.8%), Paper Products and Alcohol continue to see negative growth. Health & Beauty (+2.1%) and Perishable Food (+1.7%) are the big winners with the largest volume growth in 2025.
Local nuances to inflation and volumetric updated highs and lows
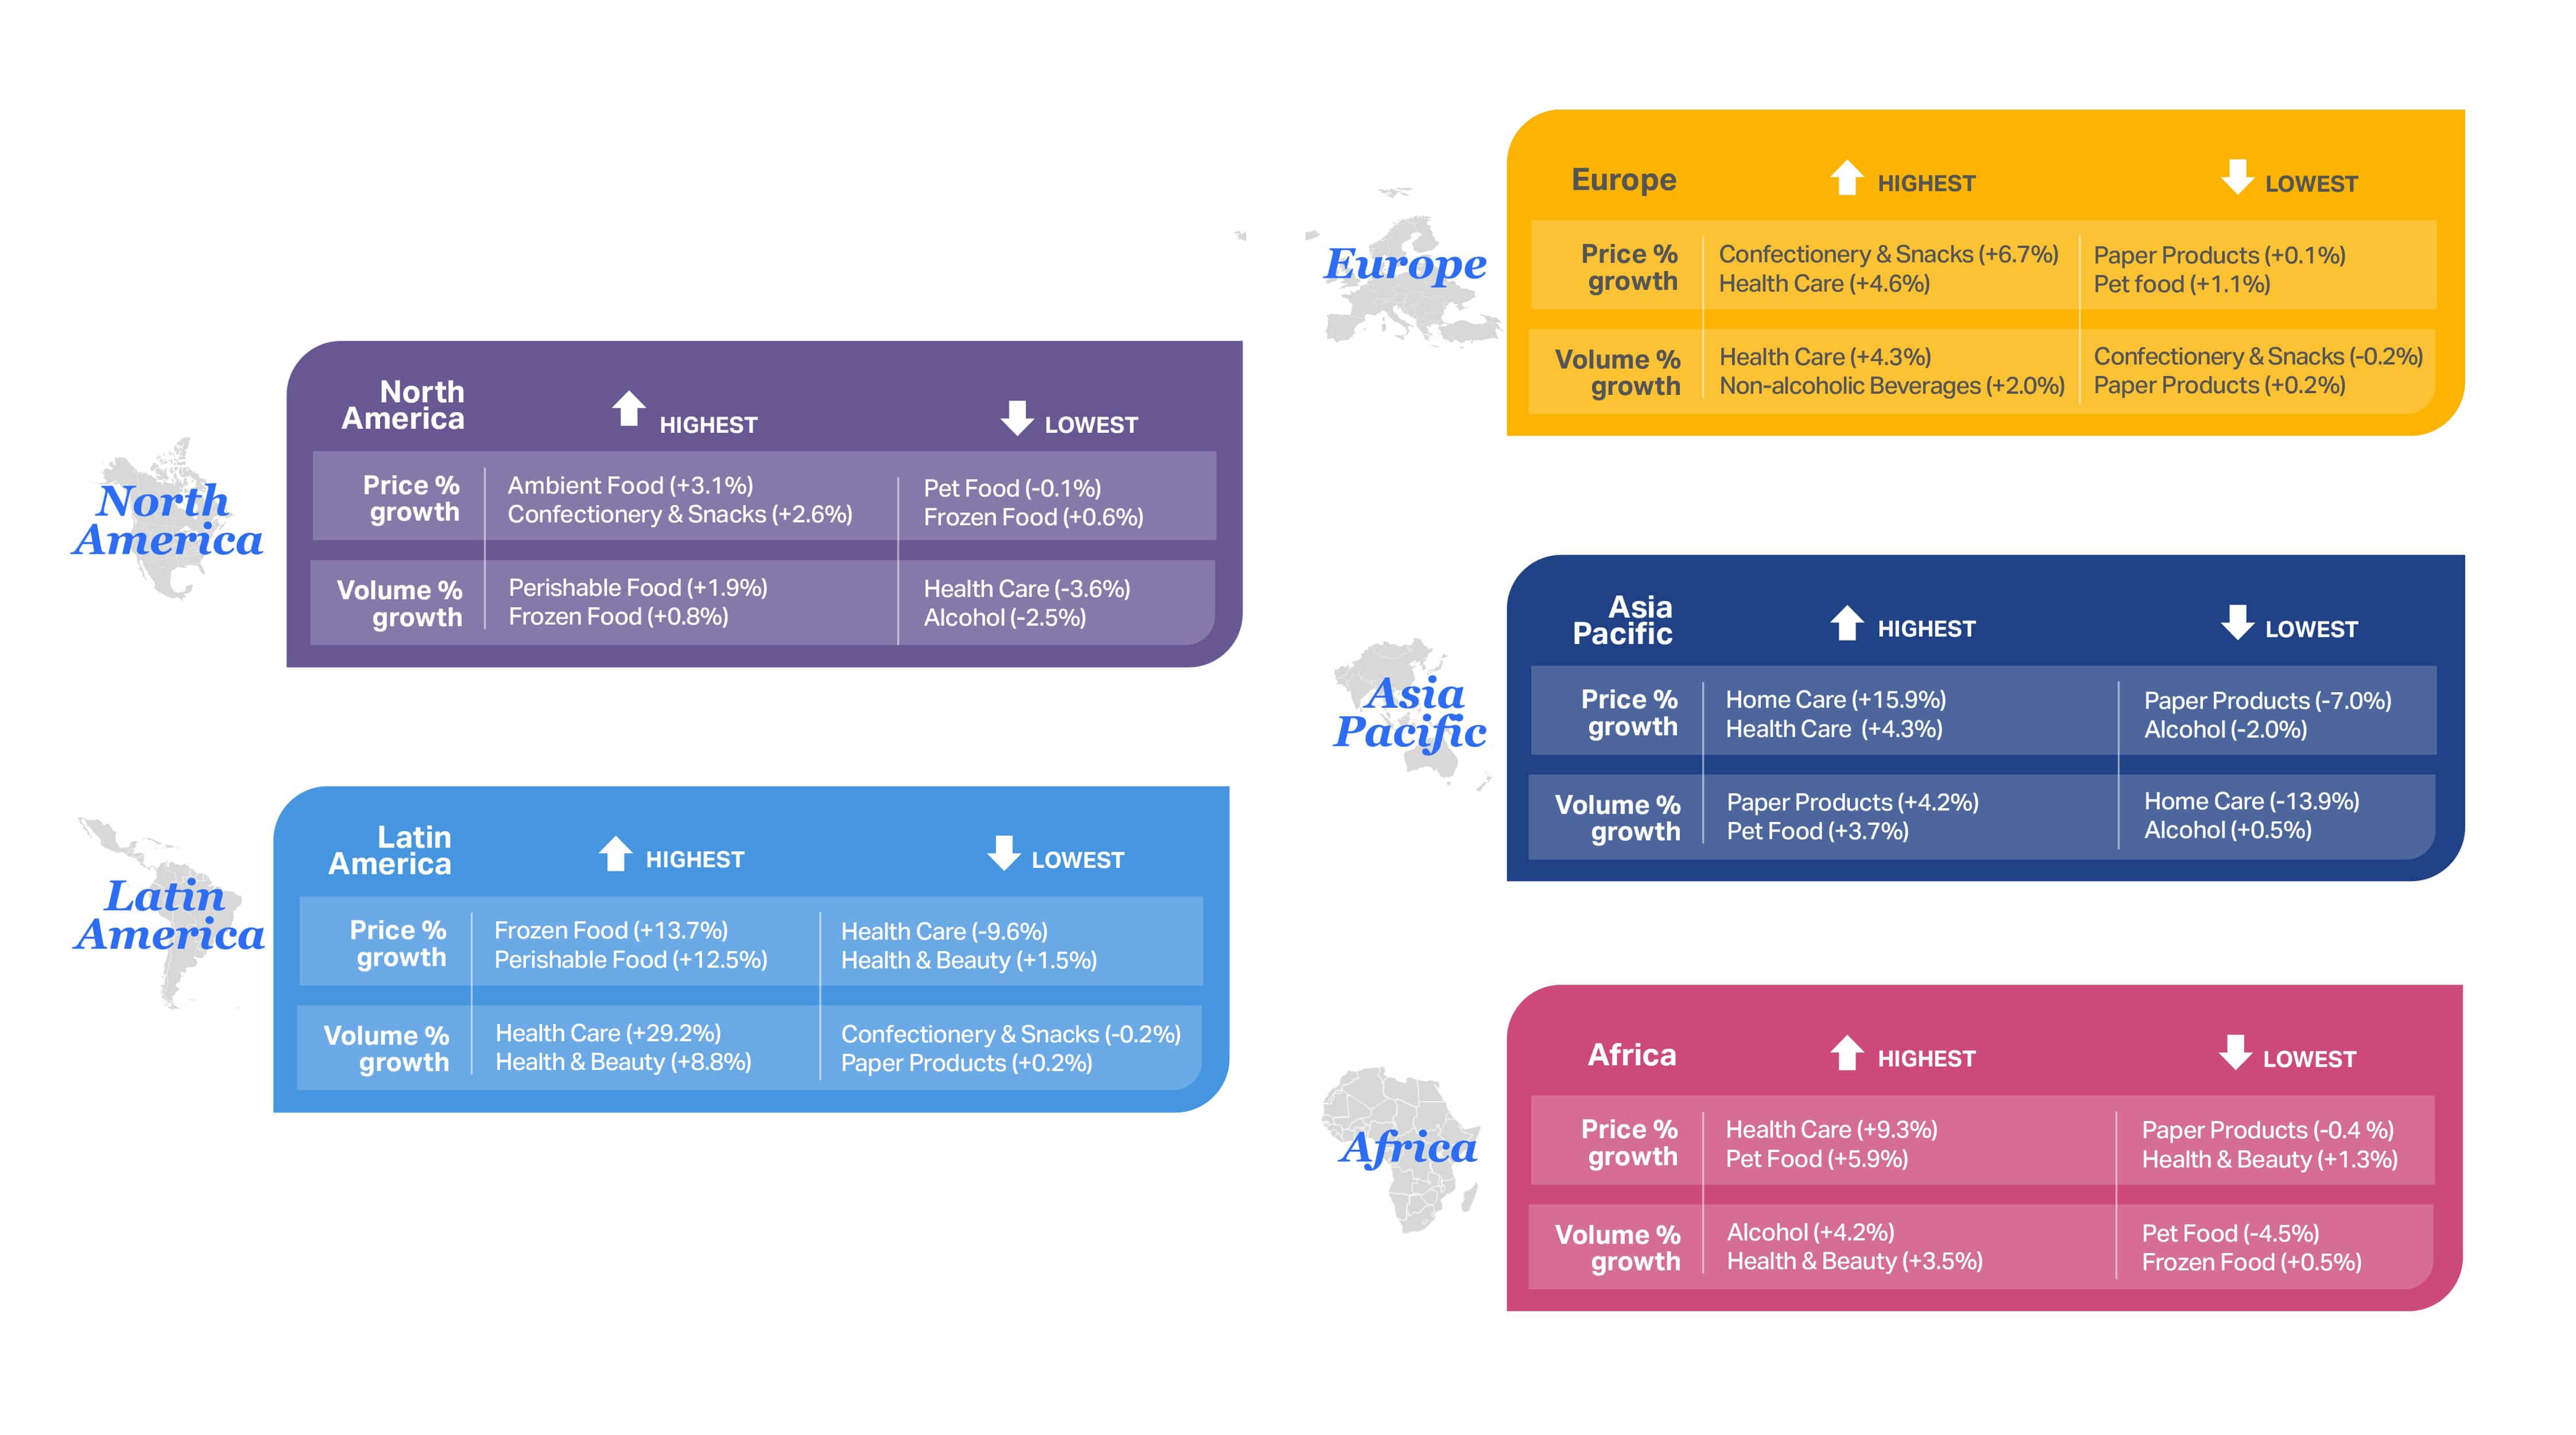
This market-level view uncovers local nuances that can lead to growth opportunities. NIQ’s global Retail Measurement Services can help identify market gaps and growth opportunities at the category level. For instance, Health Care is seeing inflation-driven growth across Europe, Asia Pacific, and Africa. The only market where volume has increased significantly for this category is Latin America, where Health Care prices are down nearly 10%.
The 2025 economic divide
Consumers continue to feel more financially secure.
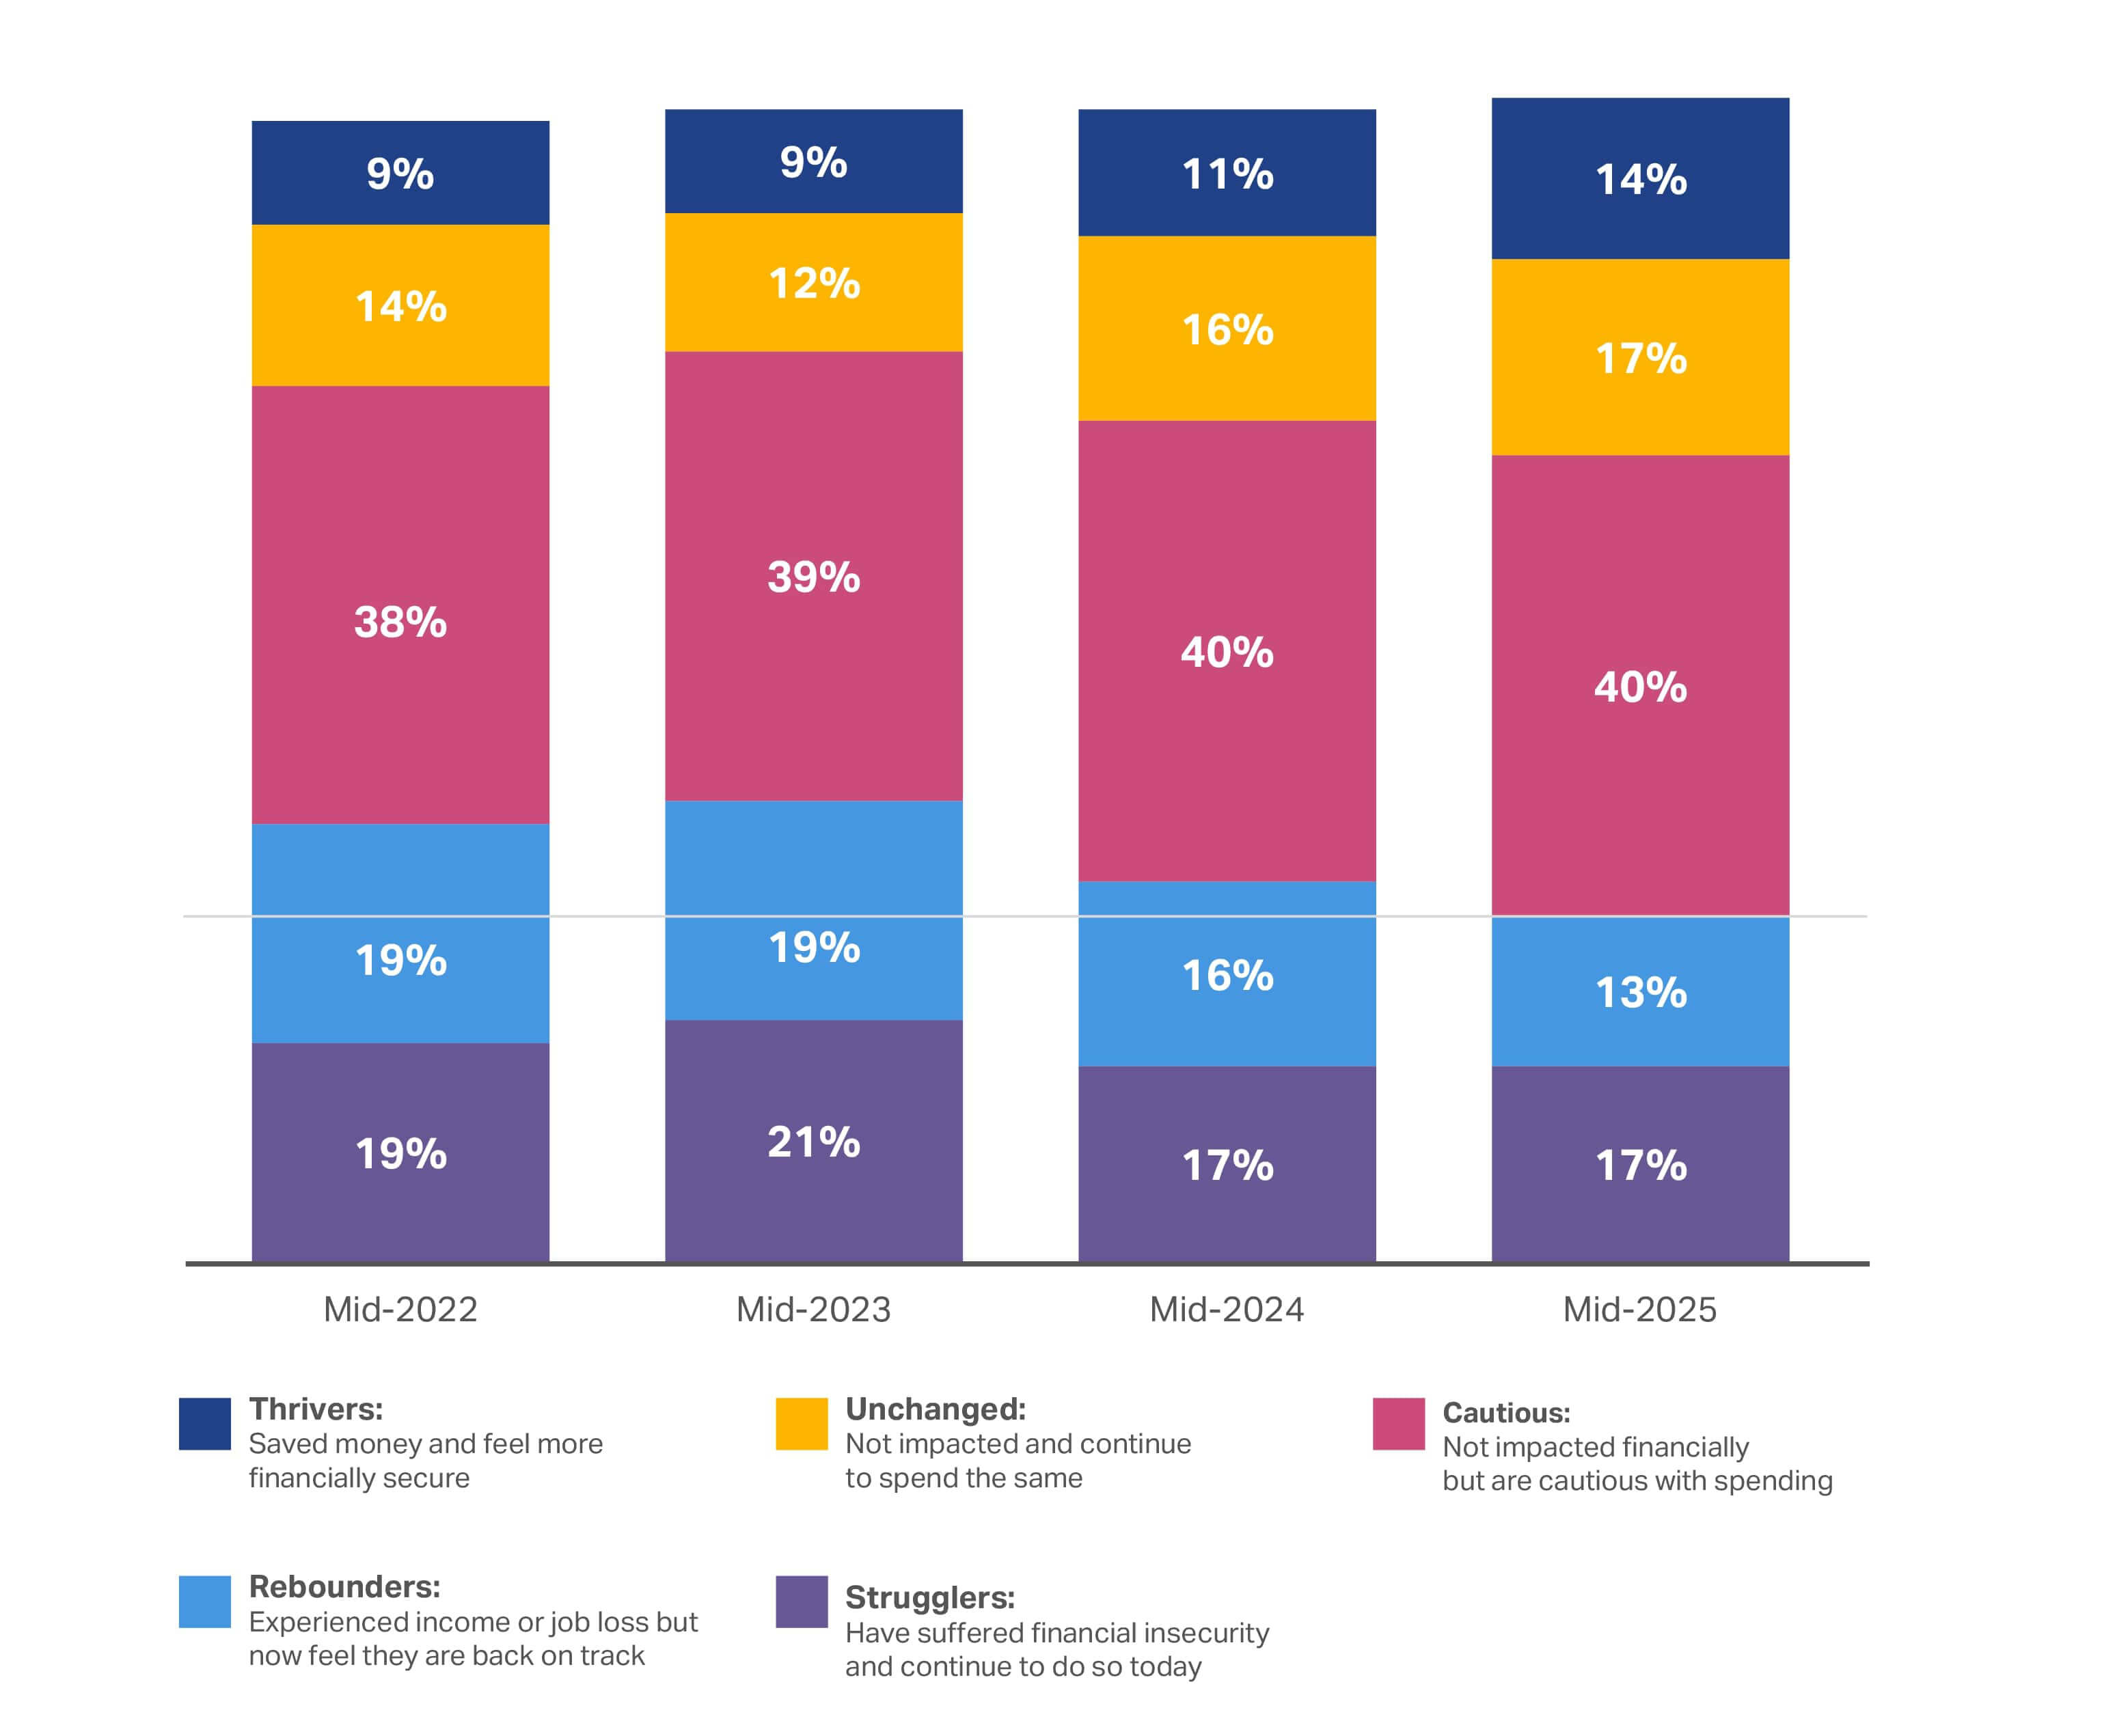
NIQ’s socioeconomic consumer segments continue to be a valuable tool for identifying how consumers perceive their financial security—including recent impacts to their income or ability to save money. Tracking changes in sentiment over time also offers a macro view for how global events are impacting the average consumer.
31%
of global consumers surveyed are either unimpacted financially or thriving in 2025 vs. 27% in 2024
The number of “confident” consumers continues to grow year over year, increasing 10% from 2023 to today. This shows that more consumers are feeling relatively financially secure and that they’re continuing to spend at consistent levels. However, the number of “cautious” consumers has stayed relatively steady—at around 40%.
Growing confidence is slowly changing behaviors
Consumers continue to hedge their bets with additional streams of income.
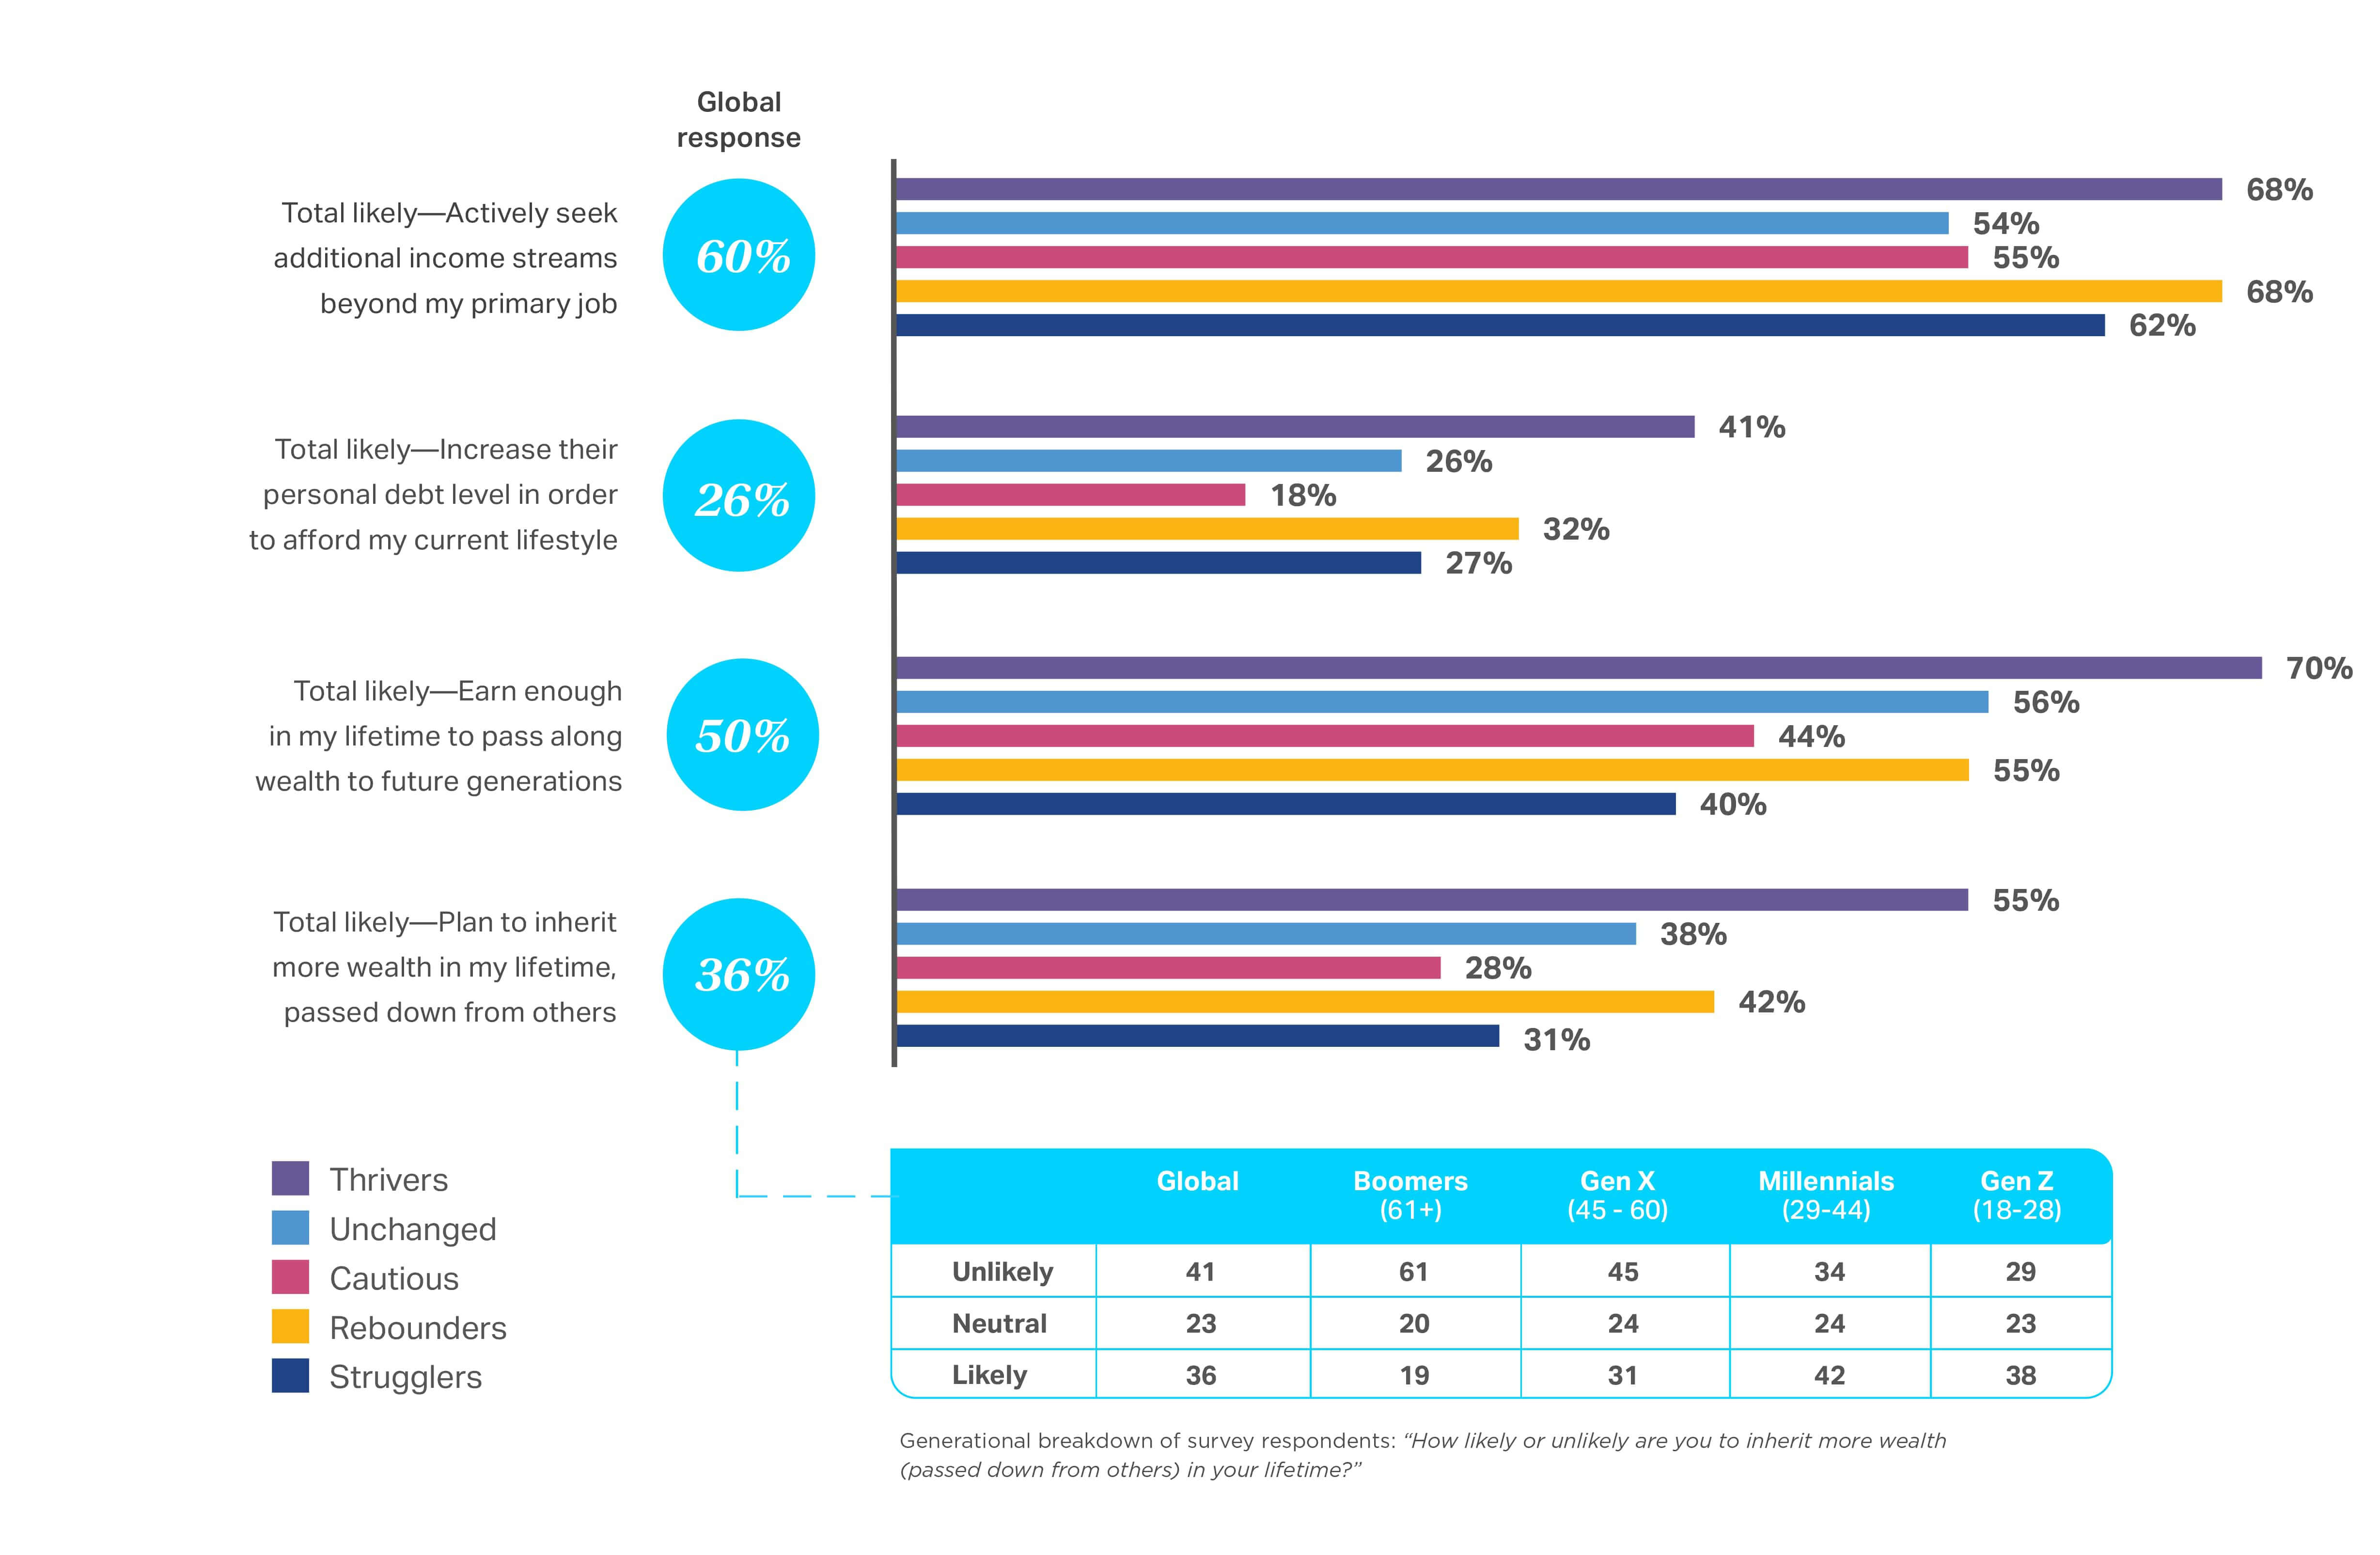
Cautious optimism continues across all the “economic divide” segments outlined above. Despite this optimism, consumers don’t feel secure yet: Wage growth remains flat, AI adoption is disrupting the job market, and prices are still elevated. Indeed, over half (60%) of respondents say they’re actively seeking additional income streams beyond their primary job. While this number is down 4% from last year, it reinforces the fact that a recovery in confidence is a slow-moving target. It’s also interesting that “Thrivers” are just as likely as “Rebounders” to look for other streams of income, signaling an underlying pessimism for even consumers who are “best off.”
Those likely to increase personal debt to afford their current lifestyle is down just 2%. The “Unchanged” and “Strugglers” groups saw the largest decrease in willingness to take on new debt. It’s possible many of these individuals, especially the “Strugglers,” feel wary of adding more debt while interest rates remain so high and/or they’ve exhausted their access to credit.
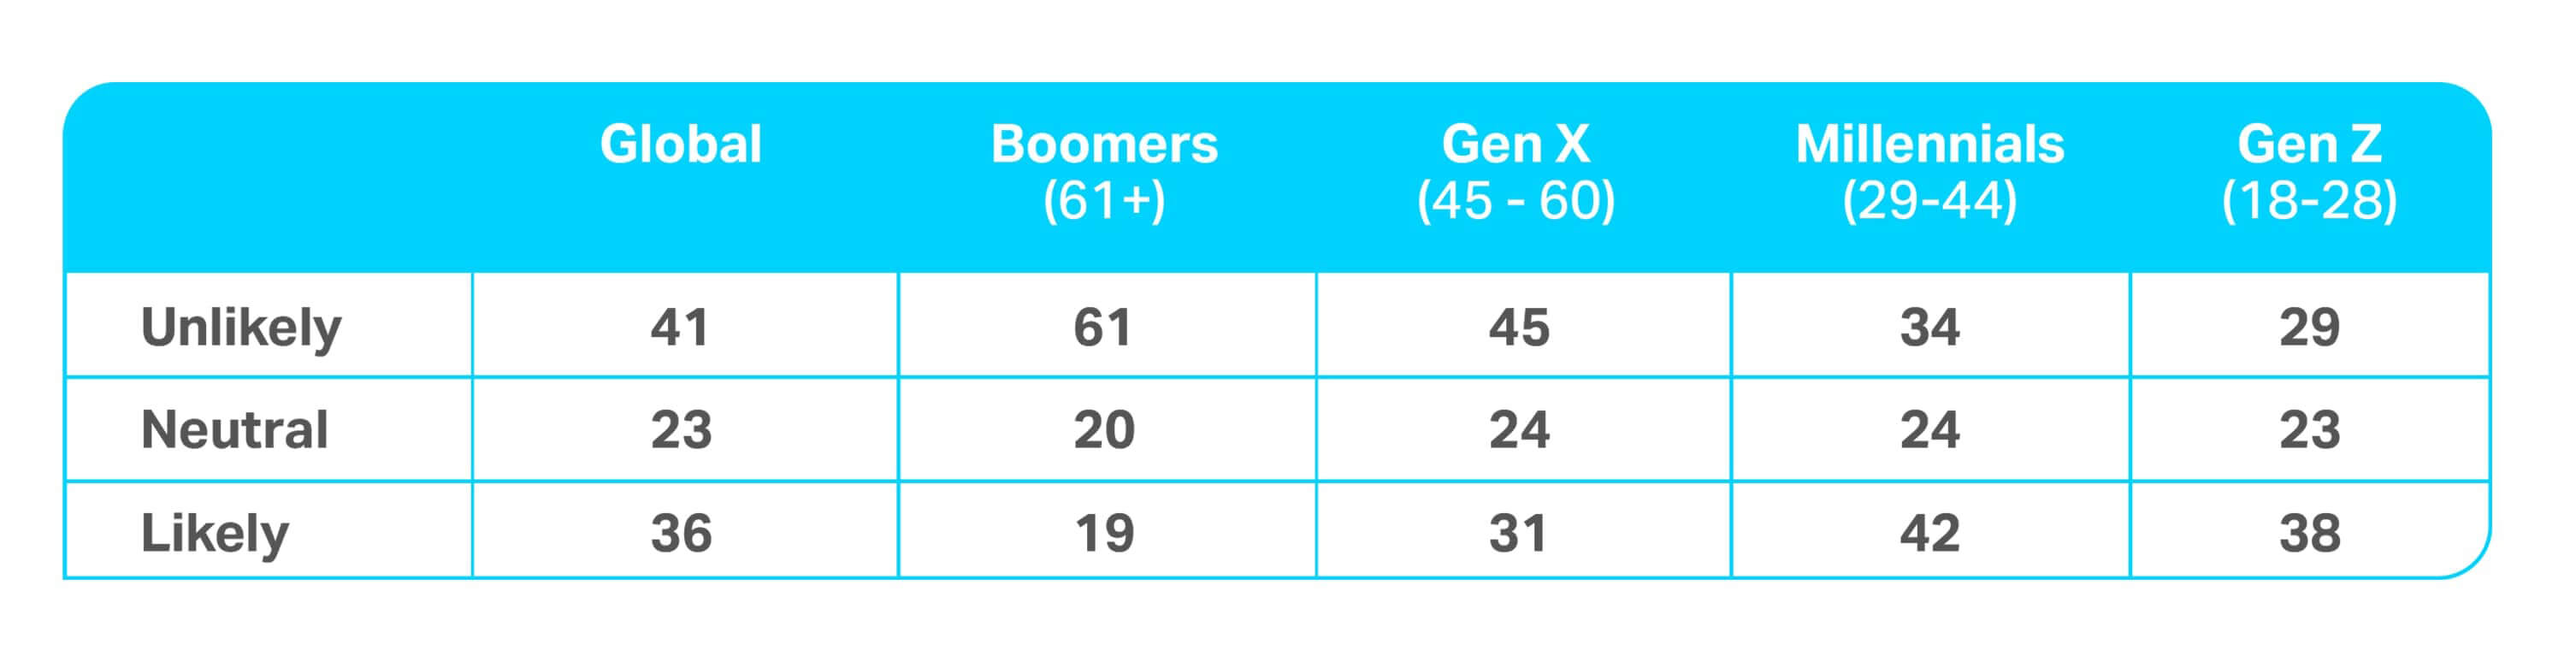
The same number of consumers (36%) as last year reported they’re likely to “inherit more wealth in their lifetime (passed down from others).” Perhaps not surprisingly, responses vary widely across generations: Older consumers think it’s unlikely they’ll inherit more wealth in their lifetimes (61% of Boomers, 45% of Gen Xers), while one-third of Millennials and 29% of Gen Zers feel that way.
How likely or unlikely are you to inherit more wealth (passed down from others) in your lifetime?
Looking for more generational insights?
Consumers to prioritize core expenses over many CPG items in 2026
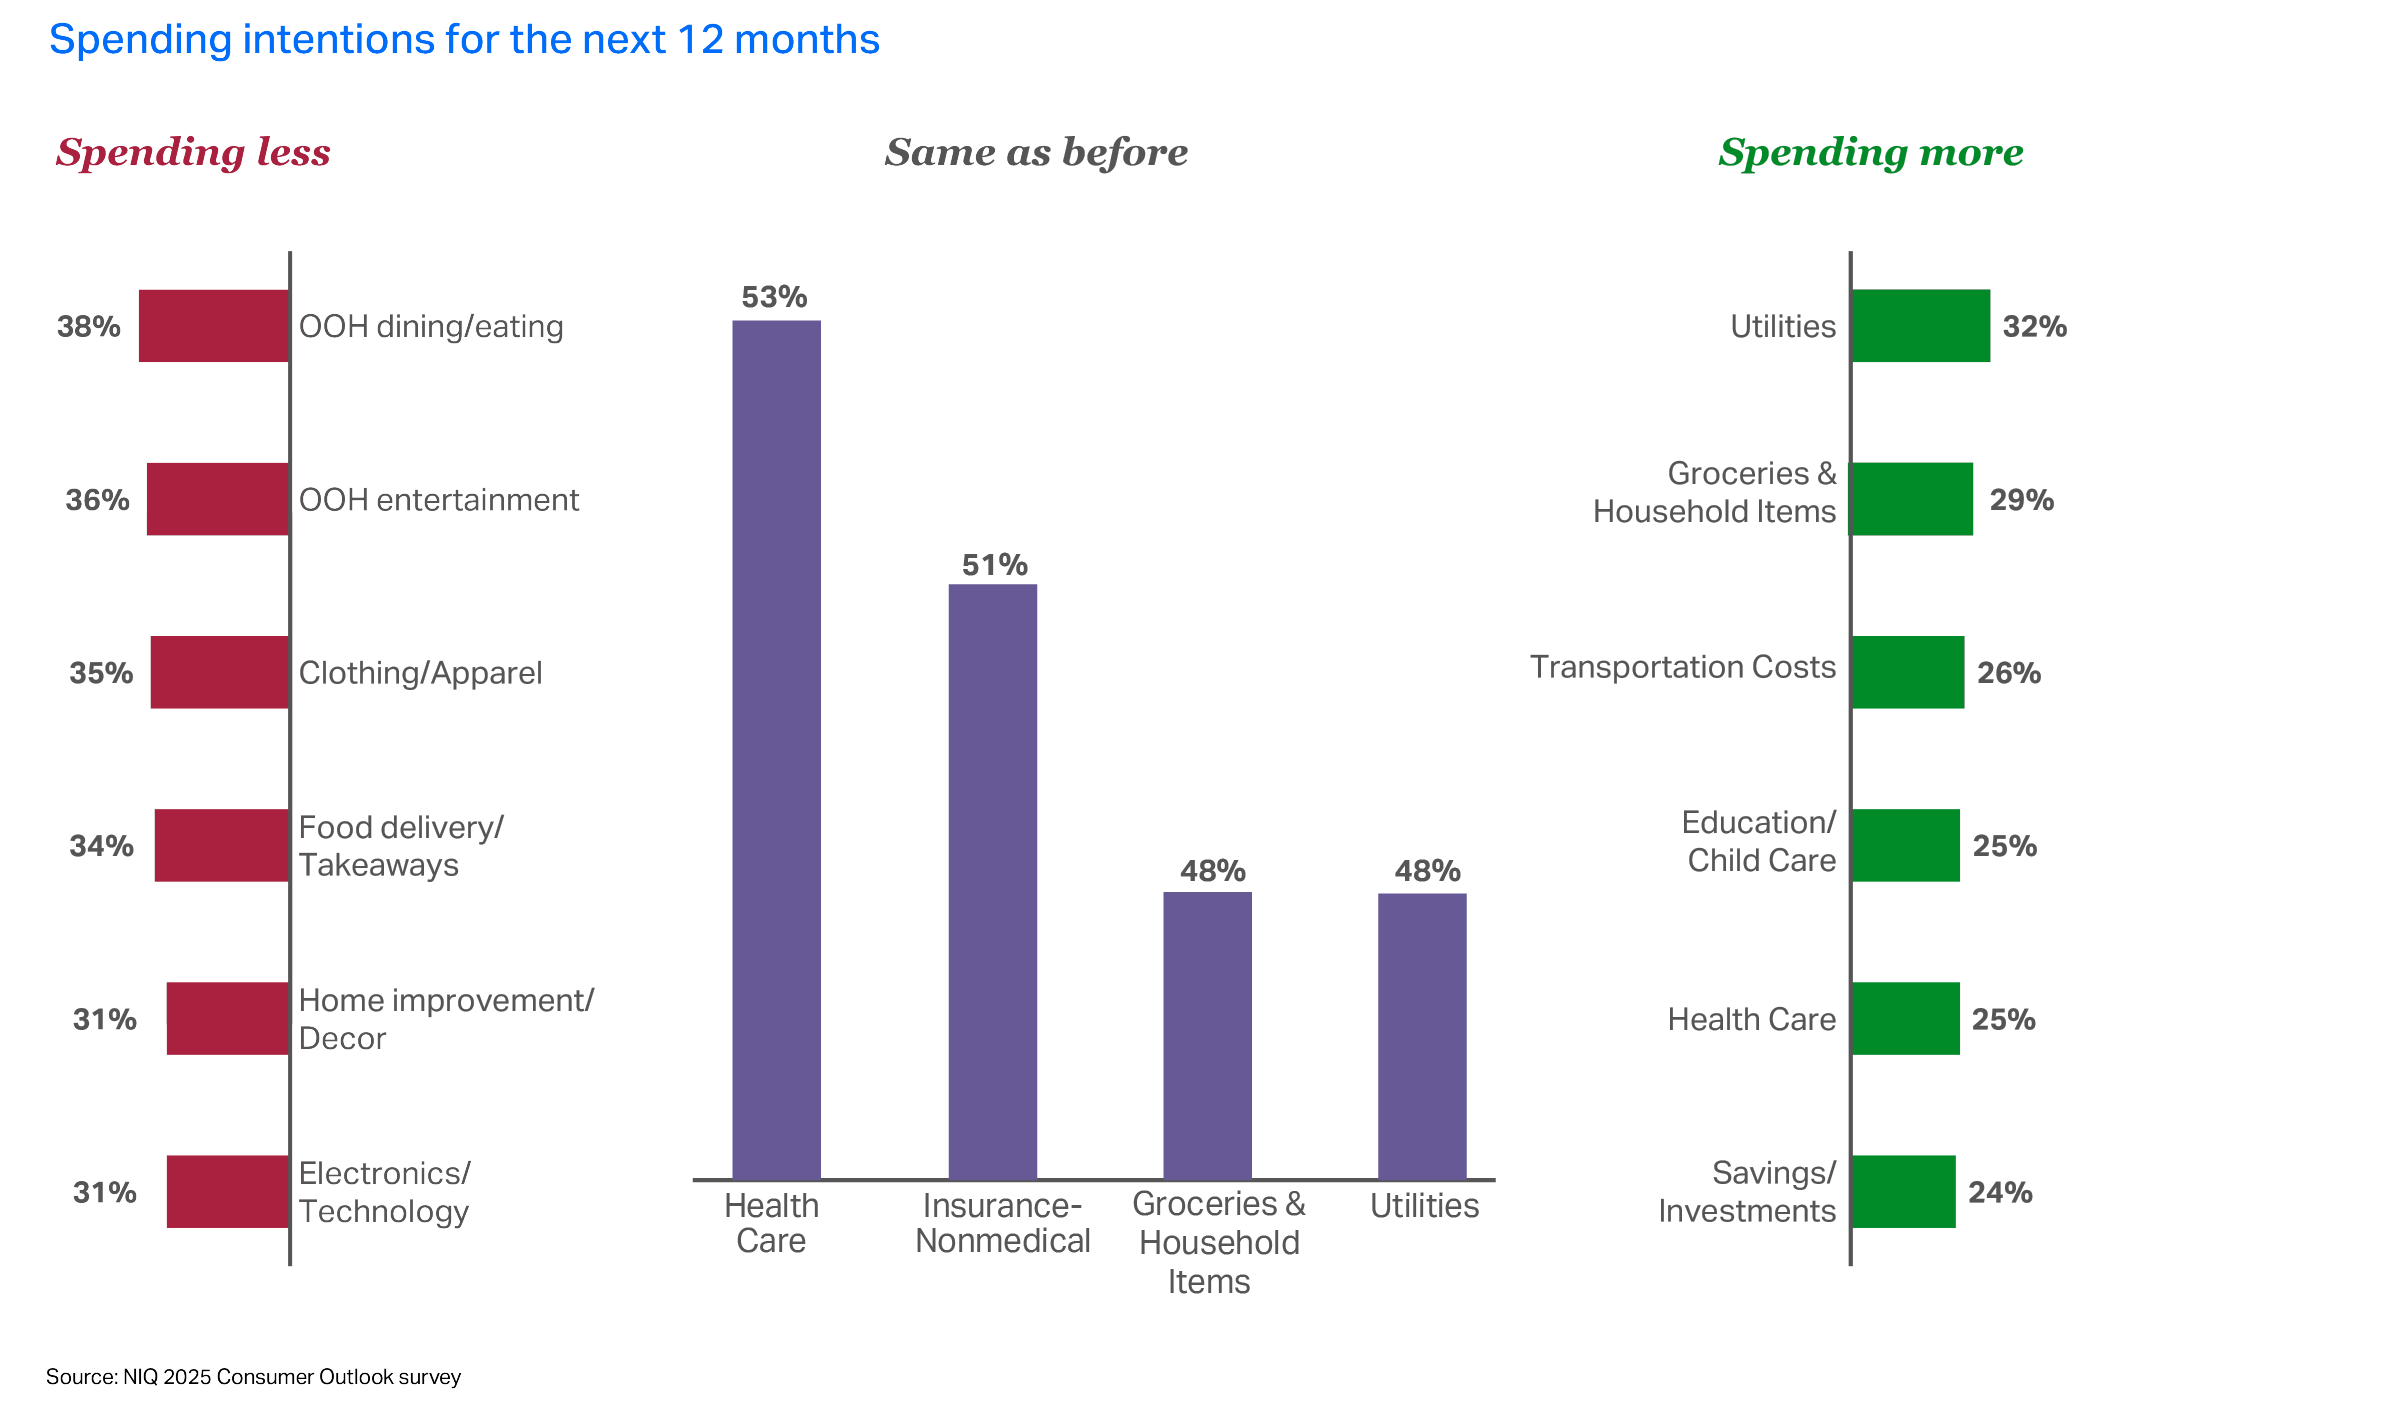
We also asked consumers to share their spending intentions going into 2026. The results are “share of wallet” data based on what (and where) consumers believe they’ll spend over the next 12 months.
We found, for example, that global consumers will continue to spend less on eating out, entertainment outside the home, and food delivery—mirroring their behavior going into 2025. However, they plan to maintain similar spending on insurance, health care, in-home entertainment, and housing, which sends a clear signal to manufacturers and retailers that they shouldn’t expect growth to come from discretionary funds previously spent on essential (i.e., core life) expenses.
A notable change this year is the decrease in the number of consumers anticipating spending increases in categories like Utilities or Groceries & Household Items. This could be due to consumers believing that prices in these key areas are stabilizing or that organizations have exhausted the potential for near-term increases.
Spending intentions for the next 12 months
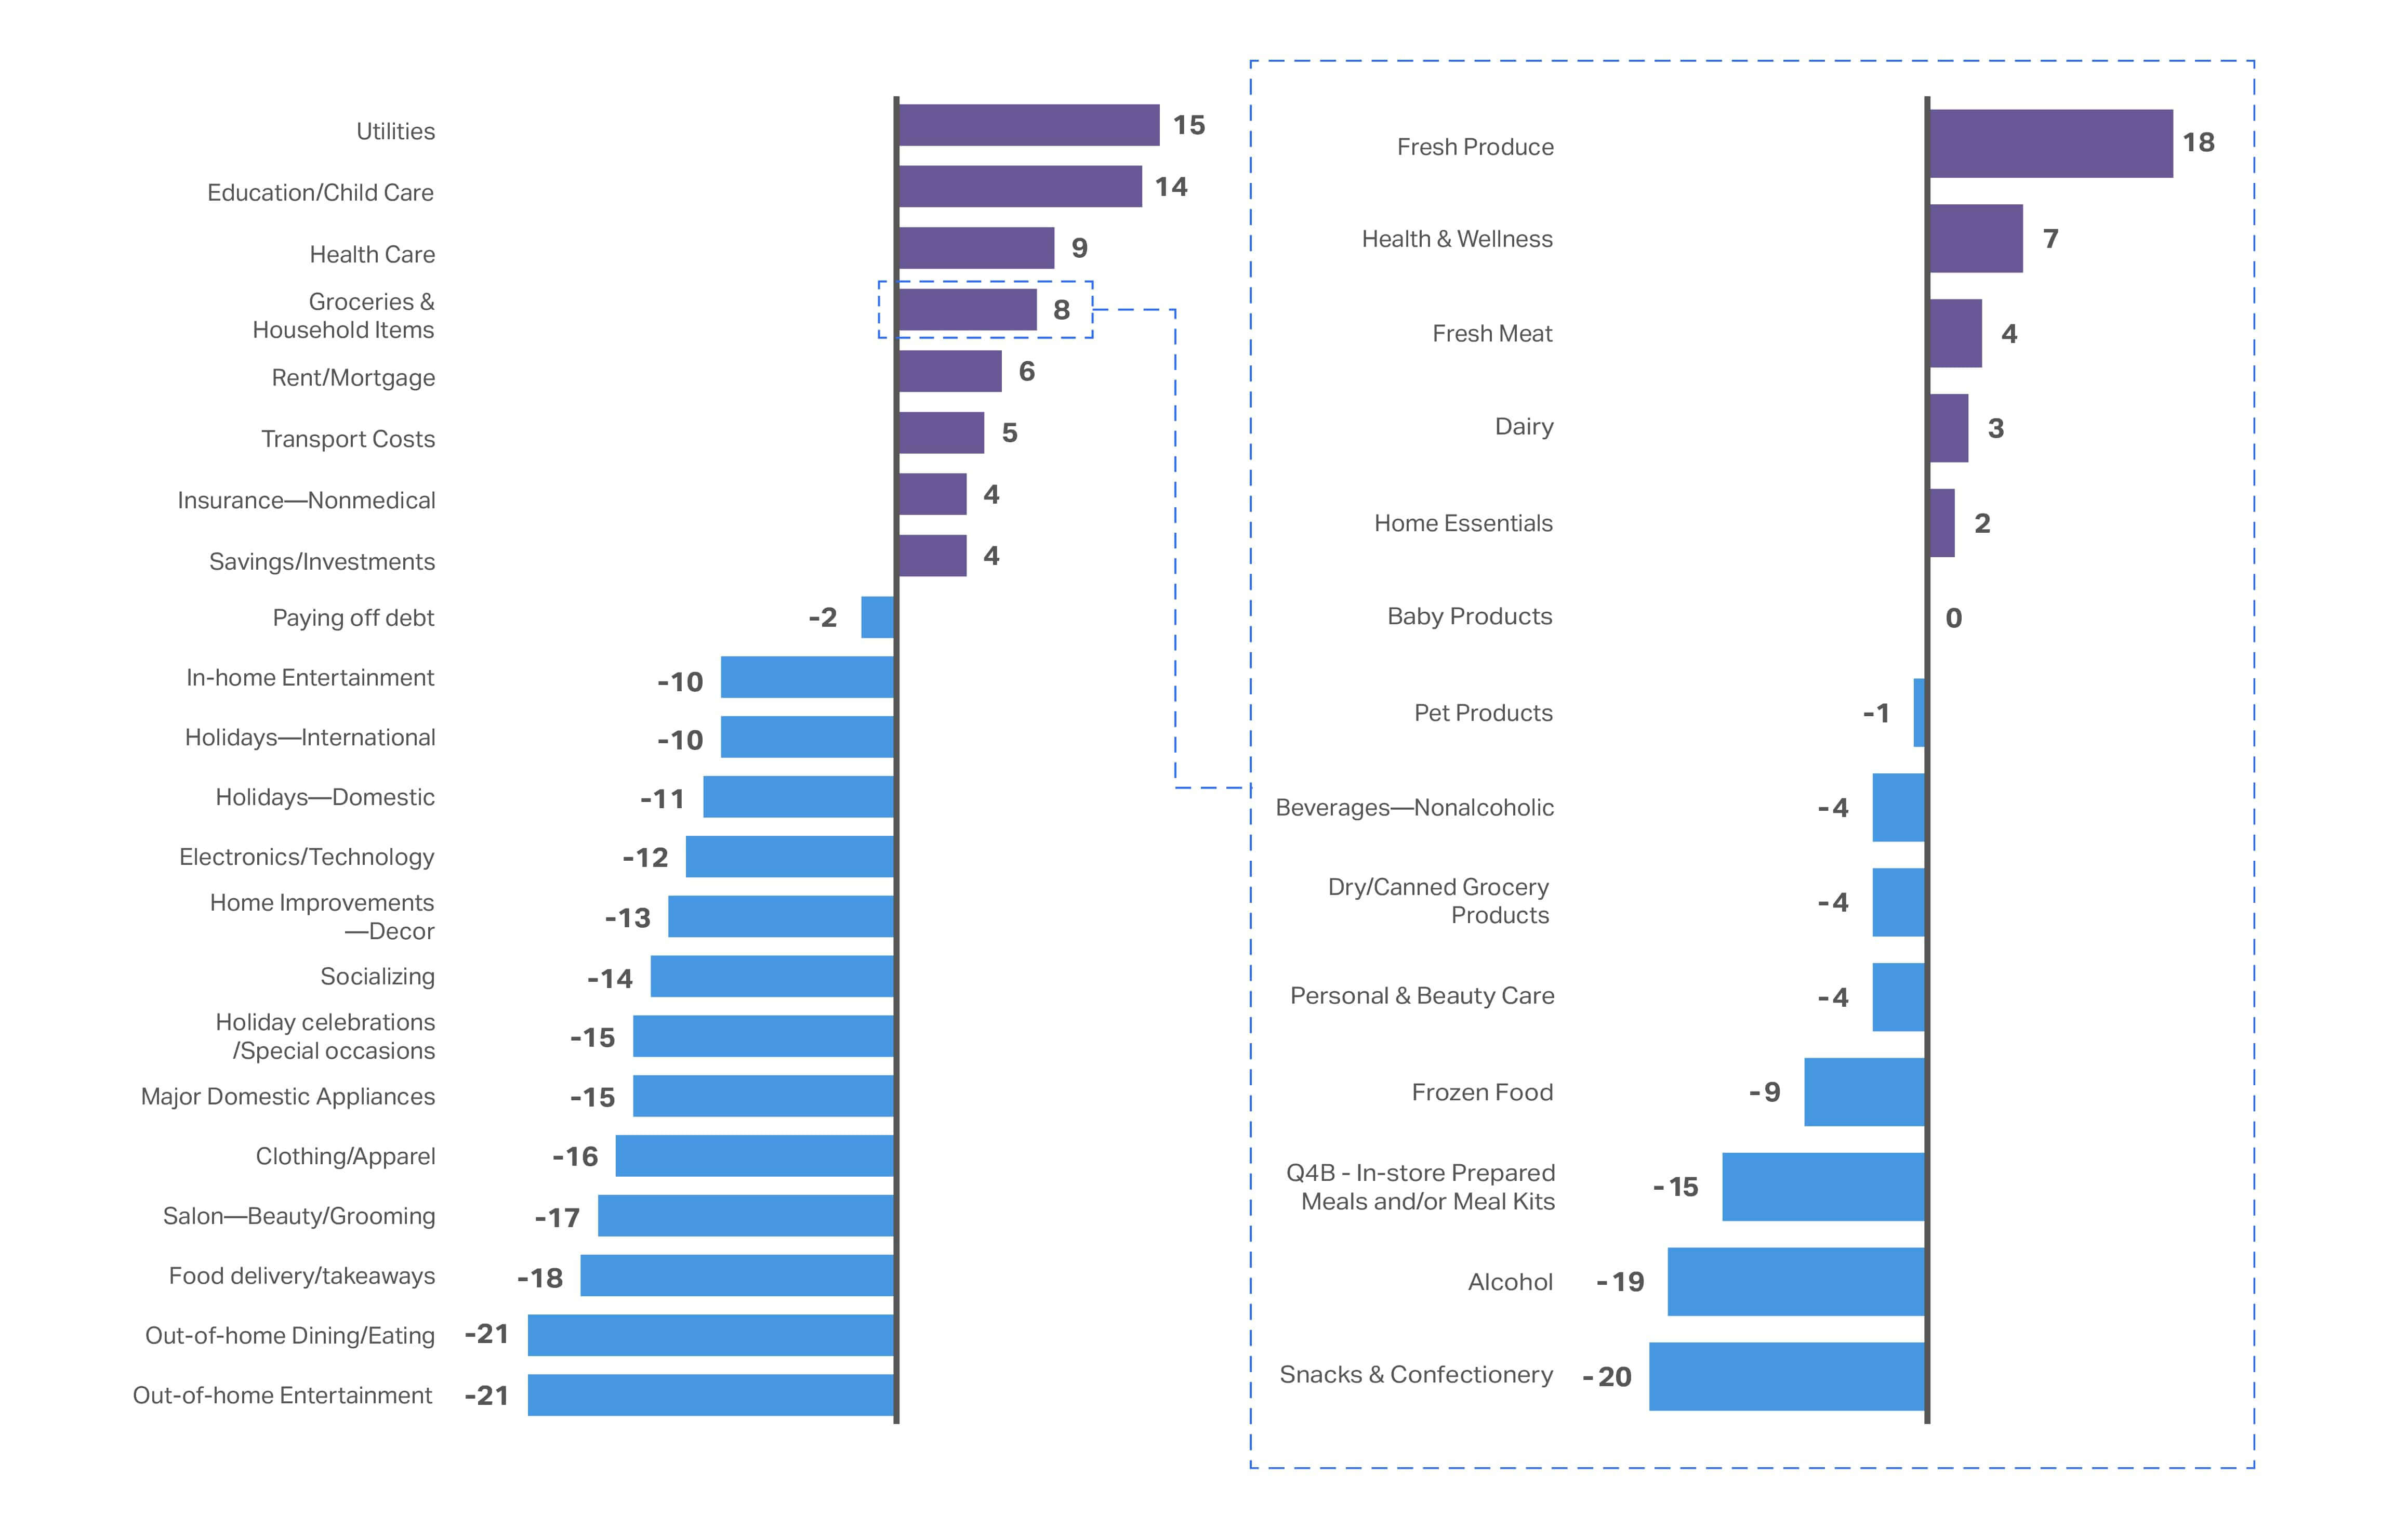
We also examined the net change in those who plan to spend more, compared with those who intend to cut back on each category of spending. This helps us uncover critical mindset shifts that may impact the CPG space.
For 2026, the spending intentions for many of the “negatively impacted” categories like Out-of-home Entertainment and Clothing/Apparel remain unchanged. Where we see some shifts is in the “positively impacted” categories like Utilities and Groceries & Household Items. Utilities, for example, has a net change in spending intention of 15% (vs. 18.9% in 2024). Similarly, Groceries & Household Items is down to 8% (from 12.2% last year). Meanwhile, more consumers are planning to spend less on Fresh Produce, Health & Wellness, Fresh Meat, and Dairy.
In 2026, consumers plan to continue prioritizing “non-negotiable” essential expenses
These essentials include Utilities, Education, Health Care, and Rent/Mortgage.
Omnishopper data insights reveal areas of growth
In leading markets like the United States, NIQ’s Expanded Omnishopper data proves that this positive consumer sentiment is clearly impacting spending. The dollar spend per US household per year is up across major departments, most notably with Health & Beauty products (+8%), Baby Care (+7%), Food (+4%), Pet Care (+4%), and Household Care products (+3%).
Health & Beauty products are being purchased more frequently, with shopping occasions per buyer up 4.9% vs. last year. Baby Care shopping occasions per buyer are up 5.6%, and Pet Care shopping occasions are up 3.6%.
Meanwhile, Food & Beverage occasions per buyer remain flat. However, absolute dollar buy rate on Food & Beverage products remains considerably higher than every other major department, sitting at $7,127 per household per year. This is fueled by a much higher purchase frequency, with Food & Beverage products being purchased throughout 227 trips, on average, during a 12-month period. For context, the next highest absolute dollar buy rate is Health & Beauty products at $1,784 per household per year, with around 83 purchase occasions per year.
When it comes to spend per trip, Household Care comes in the lowest (at around $16 per trip), while Food & Beverage is the highest (about $31 per trip).
Simplicity is the new premium
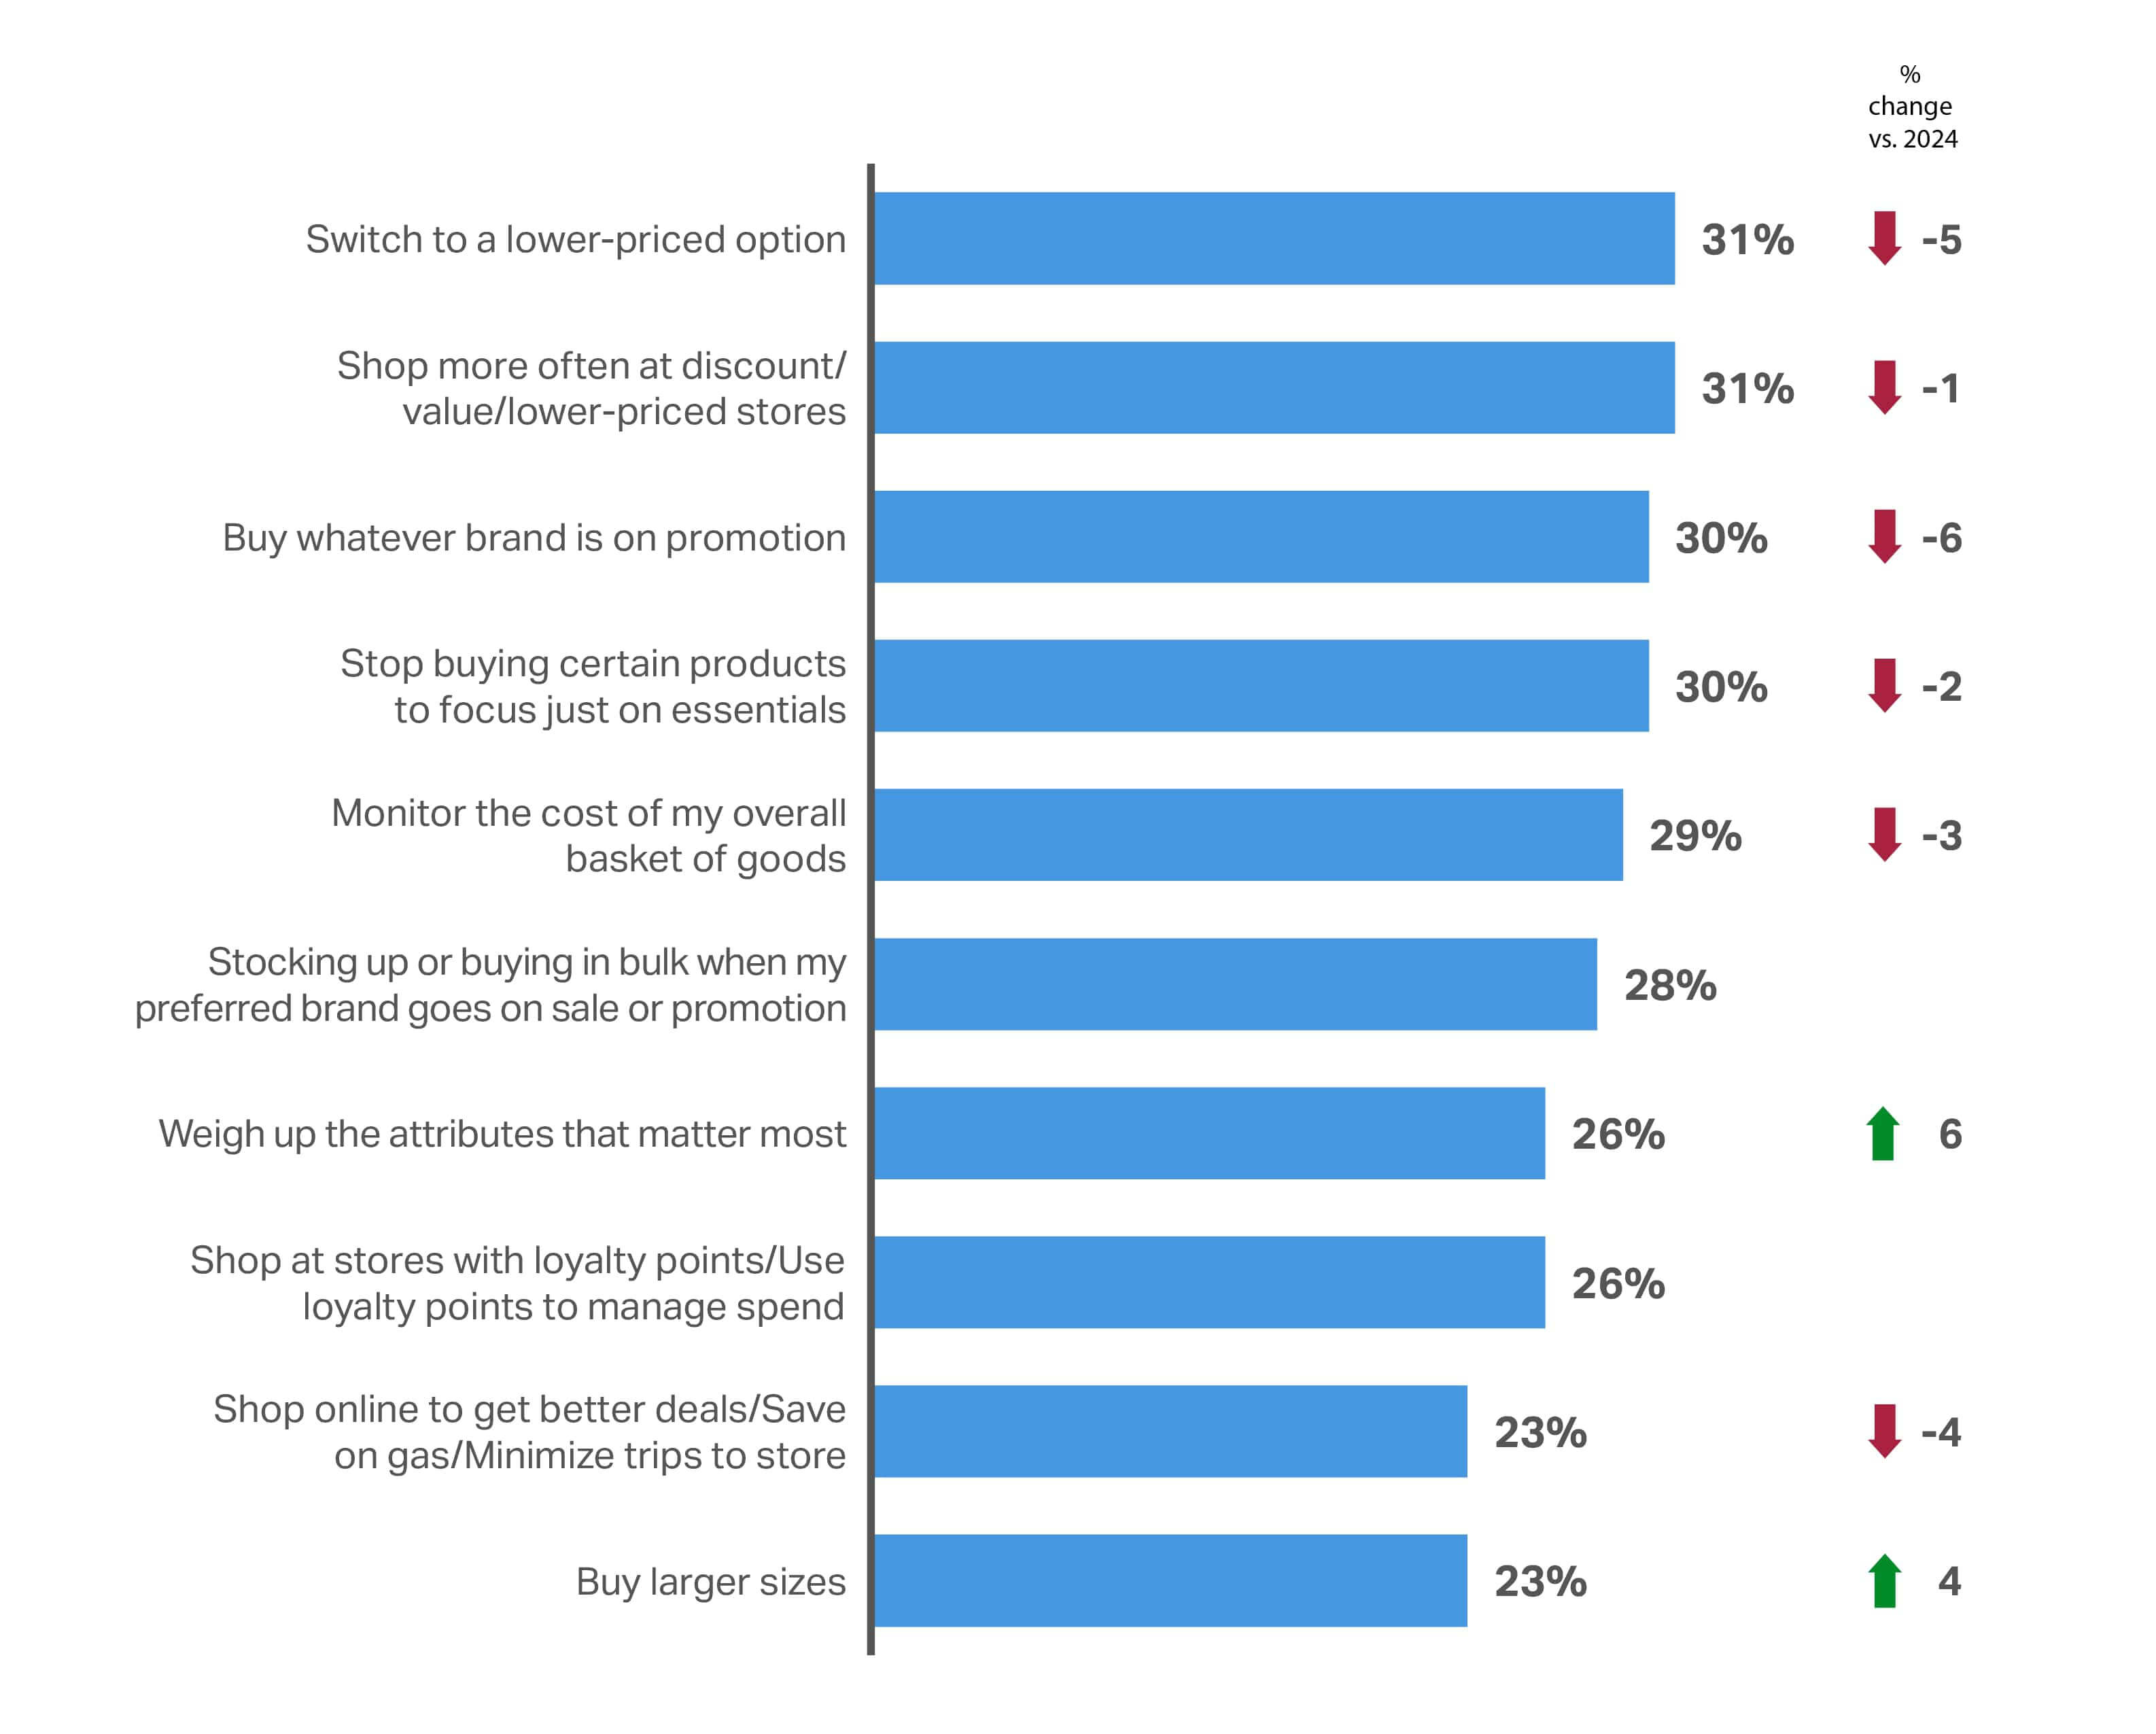
We asked consumers, “Which of the following strategies have you taken to manage expenses?”—and almost every strategy is down from last year, indicating that consumers aren’t scrutinizing their purchases as vigilantly as they were going into 2025. The only concerted effort is to “buy larger sizes” (up 4% from 2024). Otherwise, they’re employing a general strategy to “weigh up the attributes that matter most” (up 6% from 2024).
Purely focusing on the lowest-priced brand (e.g., “Switch to a lower-priced brand”, “Buy whatever brand is on promotion”) has become less popular than last year. More thoughtful approaches have become more popular (e.g., “Evaluate and prioritize attributes that matter most”, “Buy larger sizes to get a better price per amount of product”). This may suggest there’s hope for brand loyalty—if a brand offers the right holistic value proposition.
That said, price will always remain an important factor as part of the entire value proposition offered by a brand. This is evidenced by the fact that only 12% of respondents were willing to “Stick to my regular brands, regardless of price.”
With rising cognitive fatigue, simplicity is critical. Consumers are valuing fewer, clearer choices that offer price, quality, and values in one aligned proposition. Streamlined formats, low-friction experiences, and bundle-based value will outperform feature-rich complexity.
Top 10 consumer saving strategies for CPG/FMCG: Global
Last year, we saw consumers switching brands more often, looking for the best promotion. When it comes to national brands vs. private label products in 2026, NIQ’s Expanded Omnishopper US data reveals that both are growing at similar rates compared with last year (+6% and +5.5%, respectively).
Value per buyer is also growing at a similar rate to total FMCG households. Where they diverge is in the value per occasion. National brands continue to command twice the value ($31.60/occasion) of private labels ($14.90/occasion).
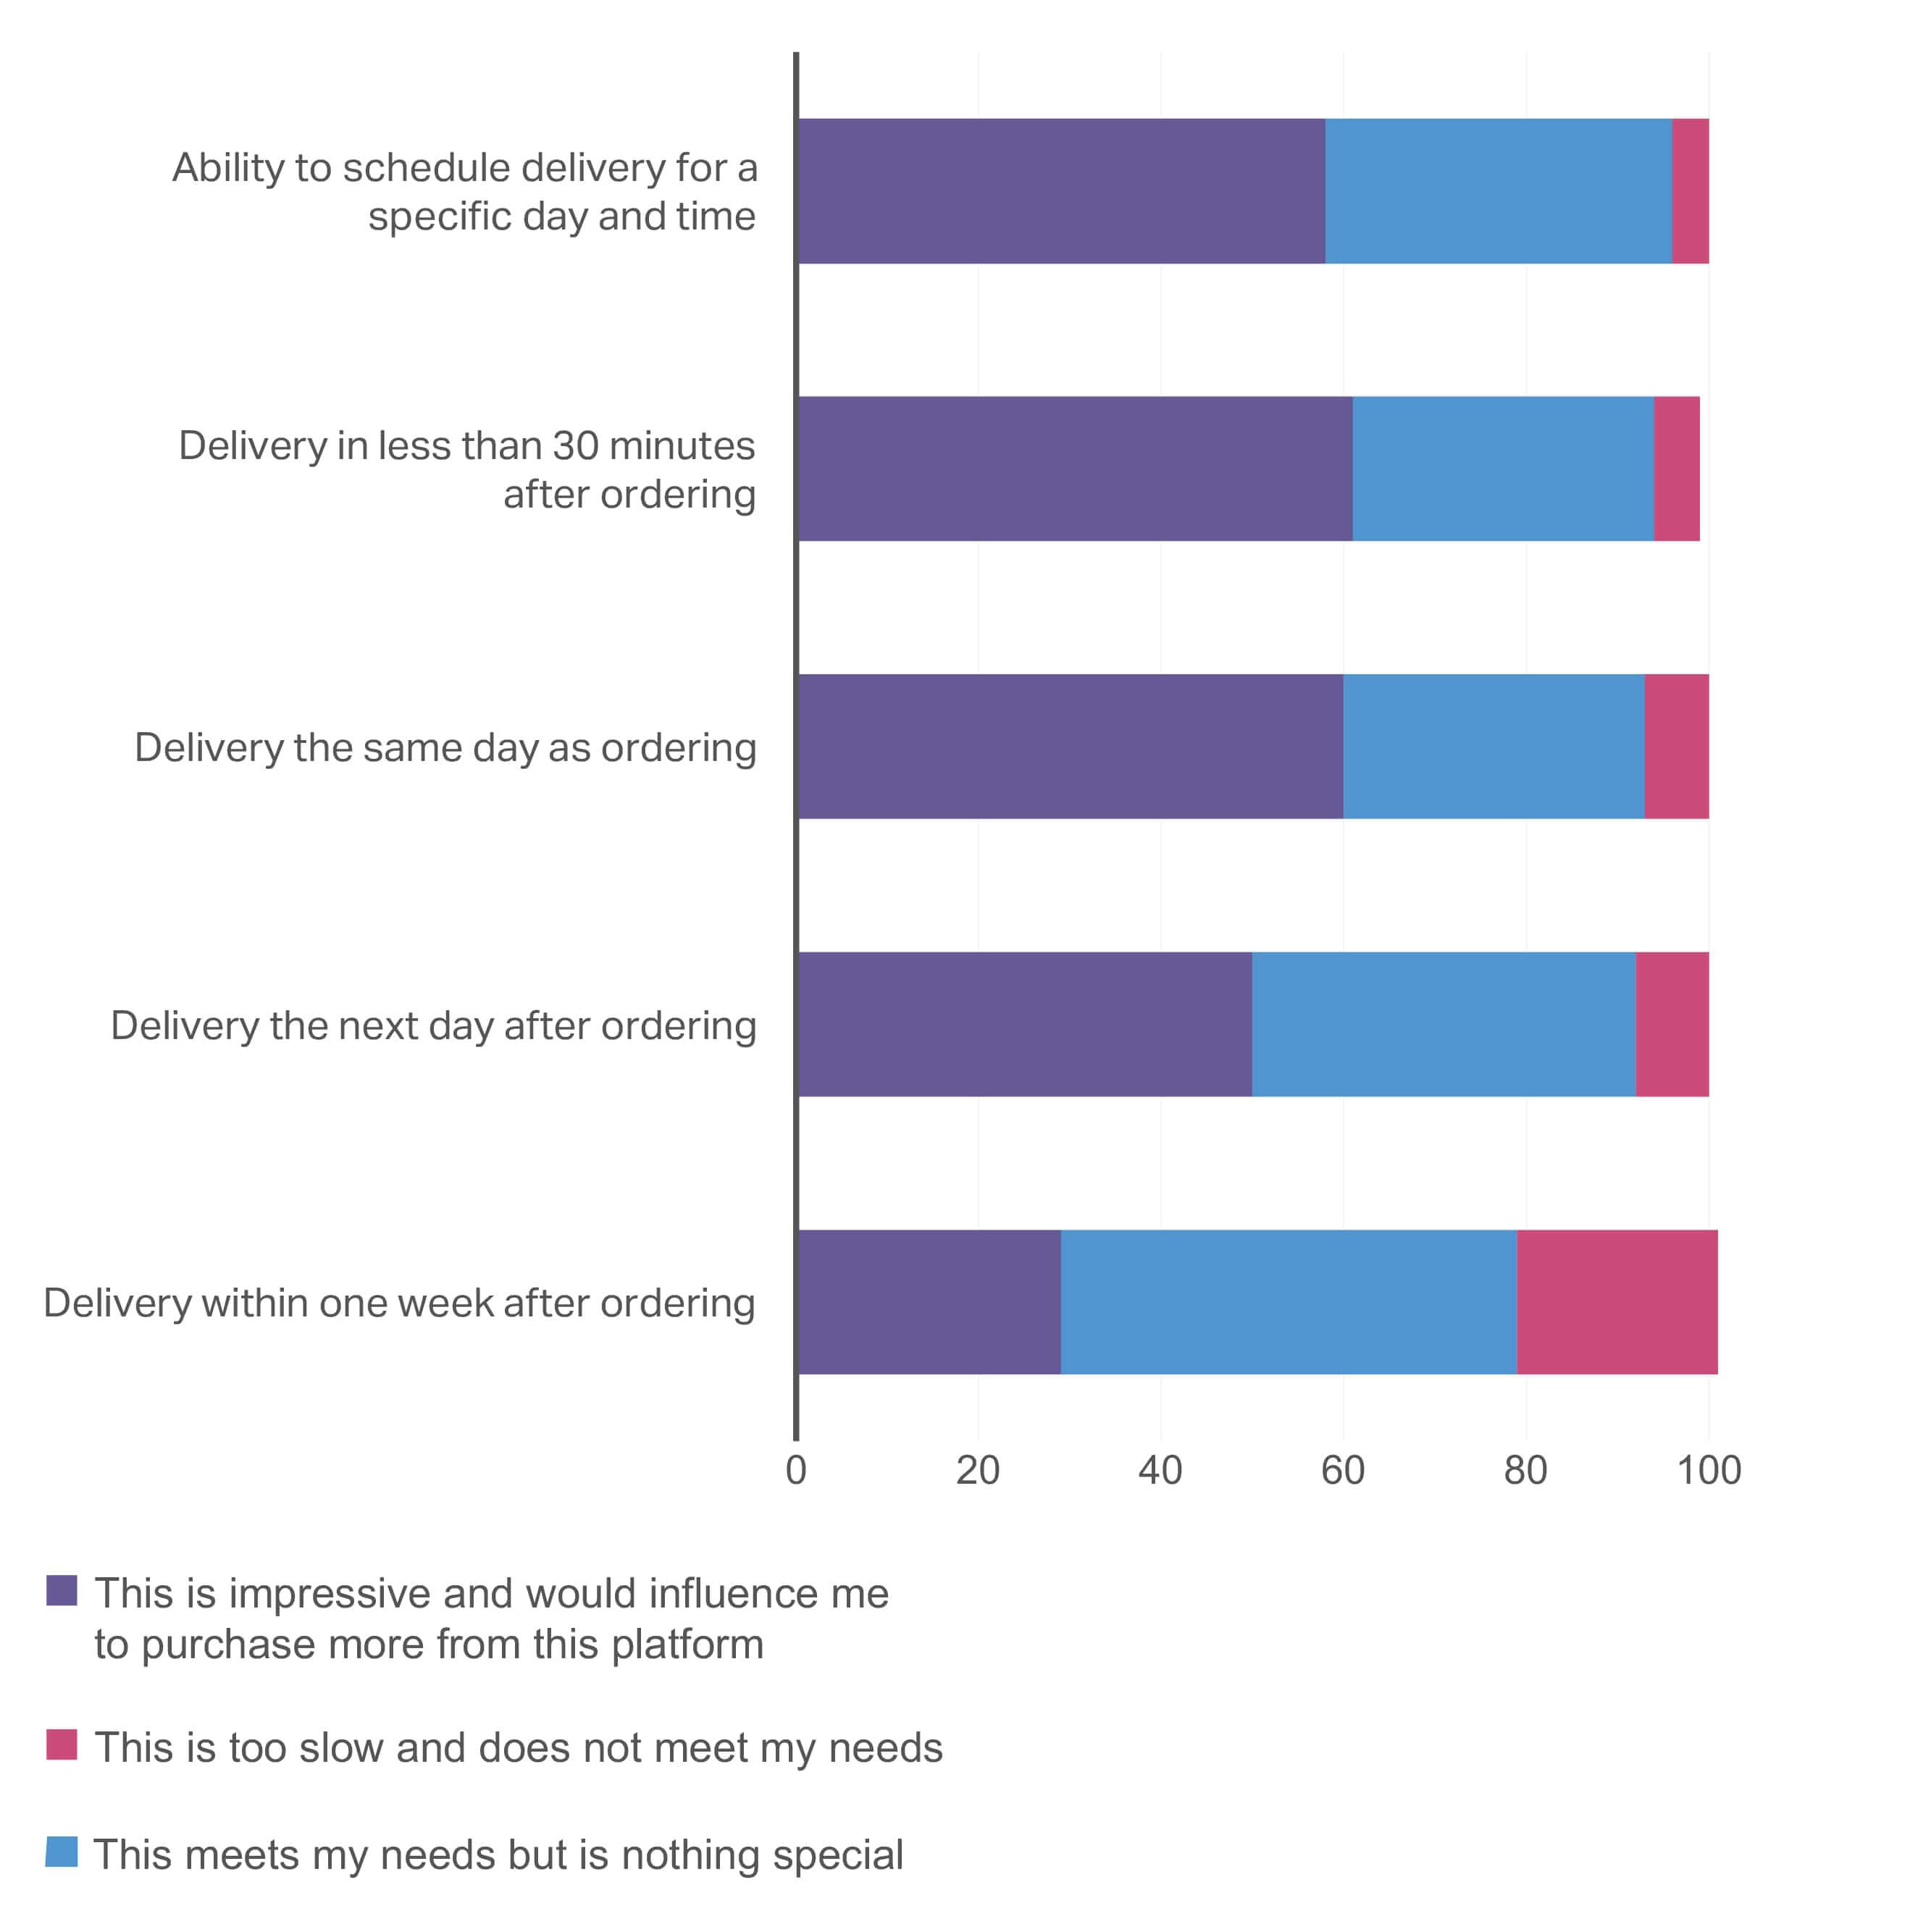
Delivery time is the new global luxury
Consumer expectations for delivery times are rapidly evolving. Our global survey shows that anything slower than “next day” delivery would not motivate consumers to purchase. Interestingly, there’s not much difference in purchase influence between “next day,” “same day,” or even “30-minute” delivery options.
When purchasing on a digital platform, what are your expectations regarding delivery timing?
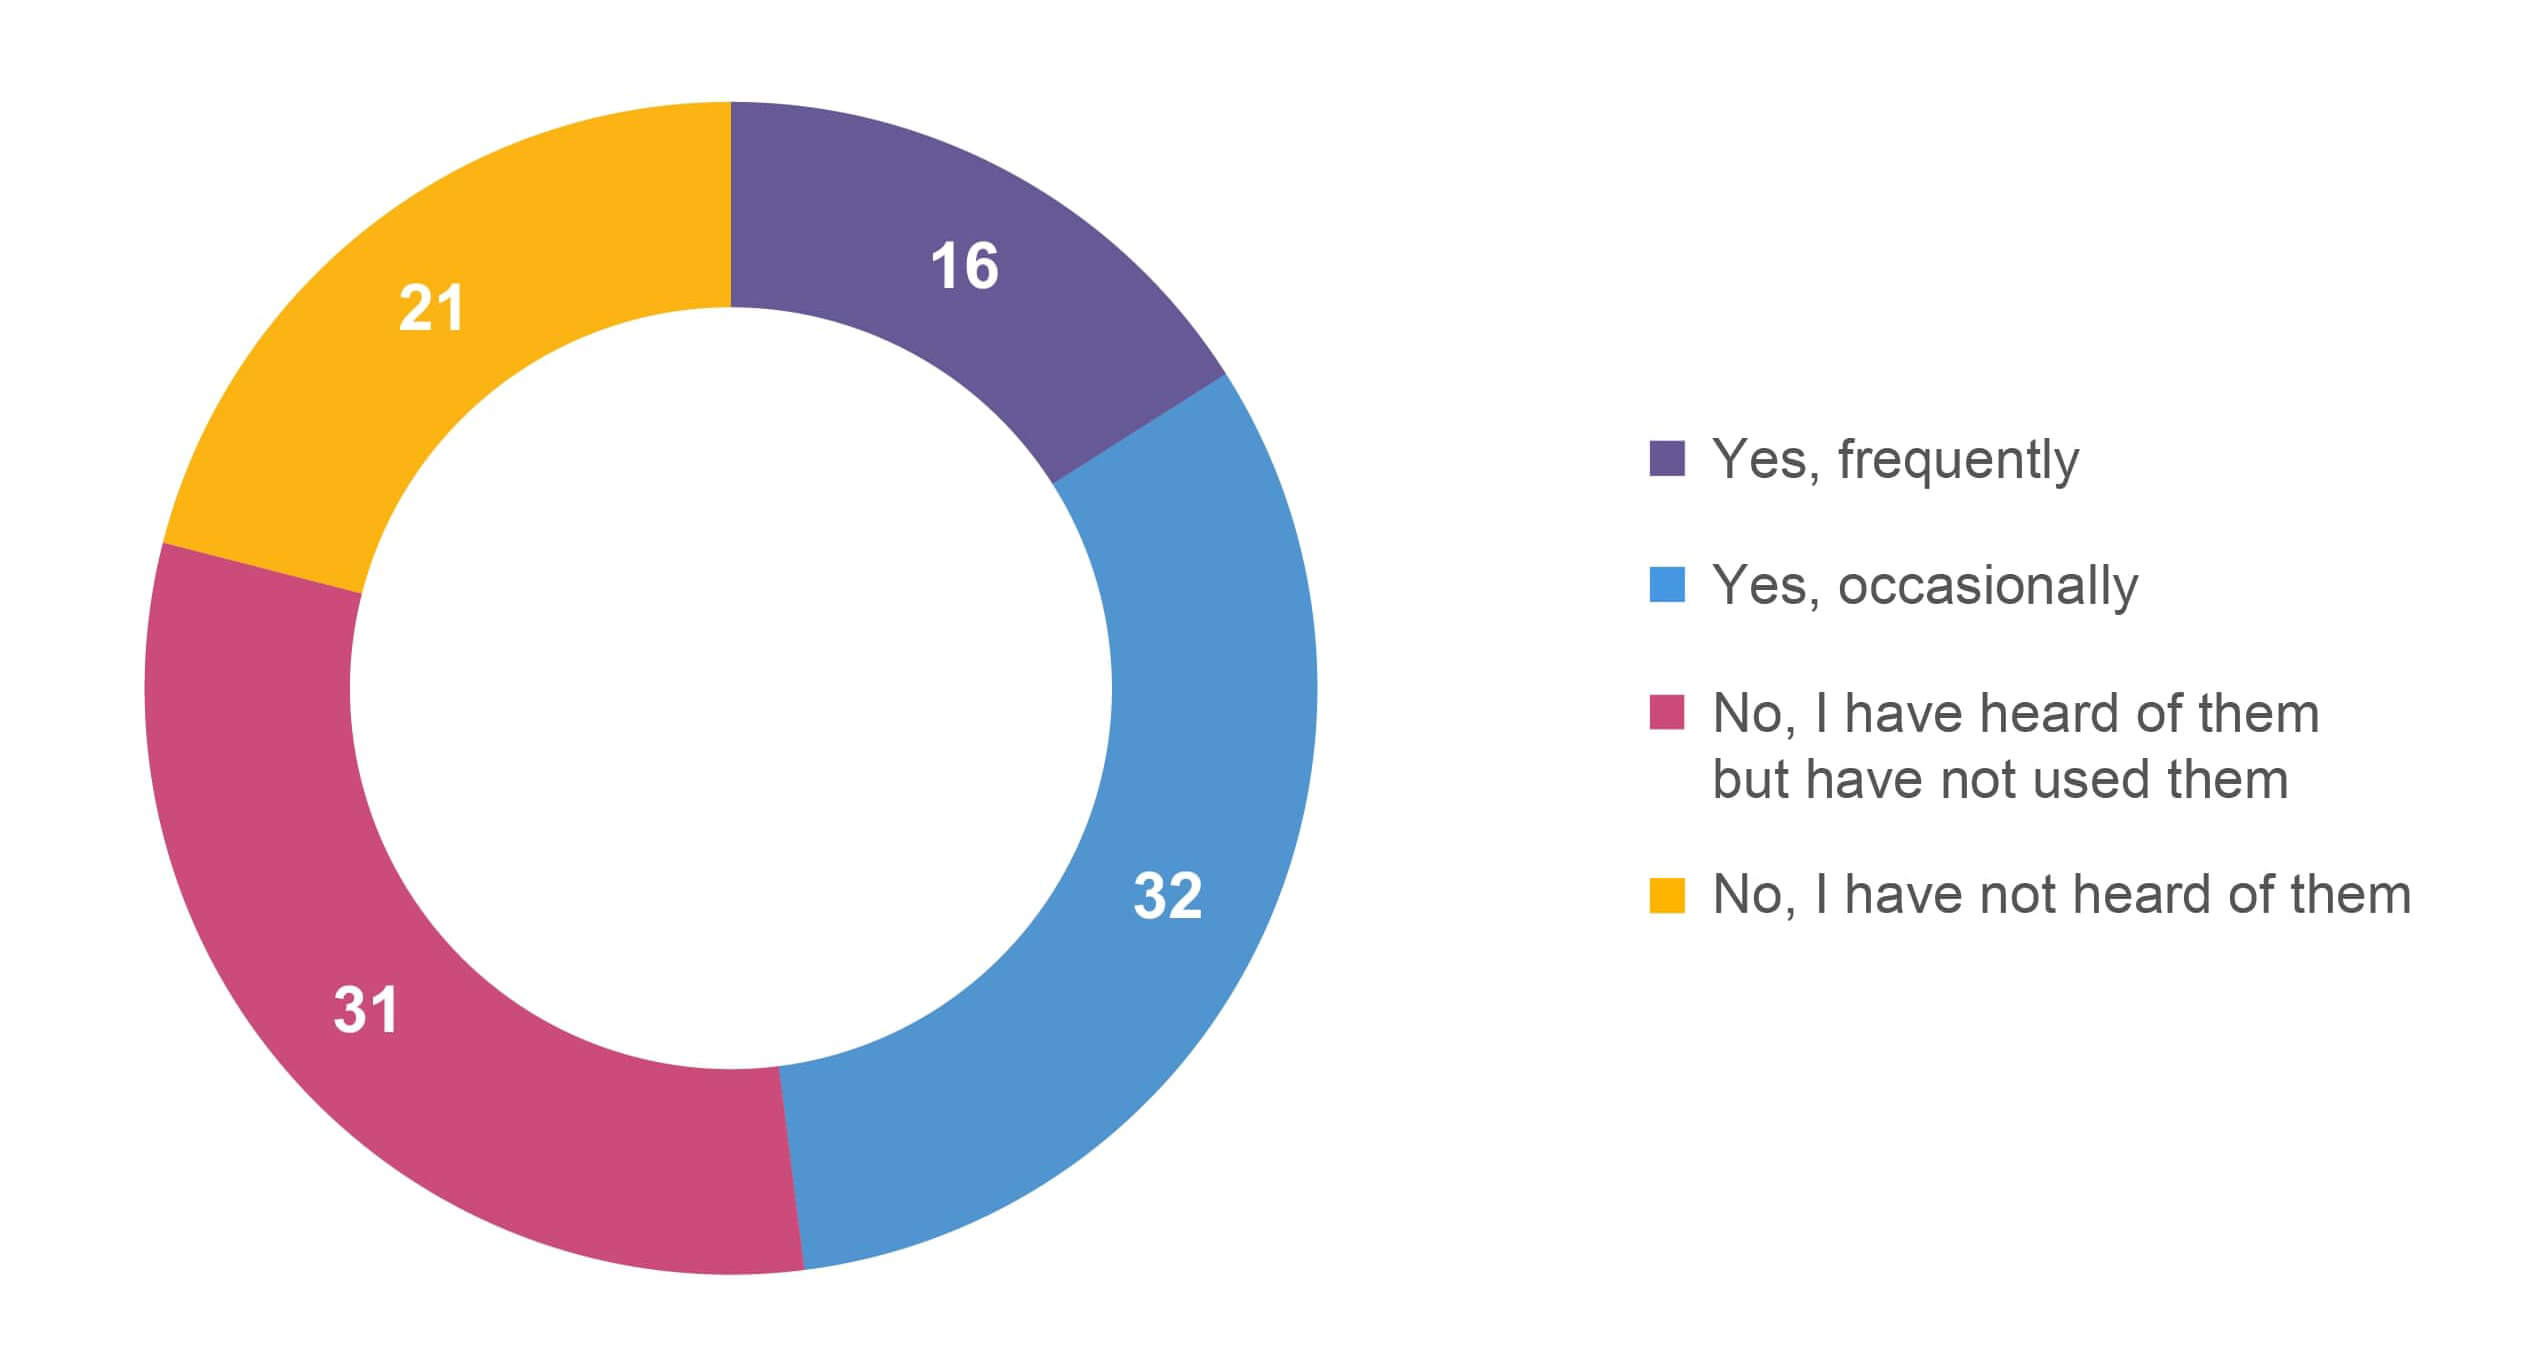
Have you used quick delivery (30 minutes or less) apps?
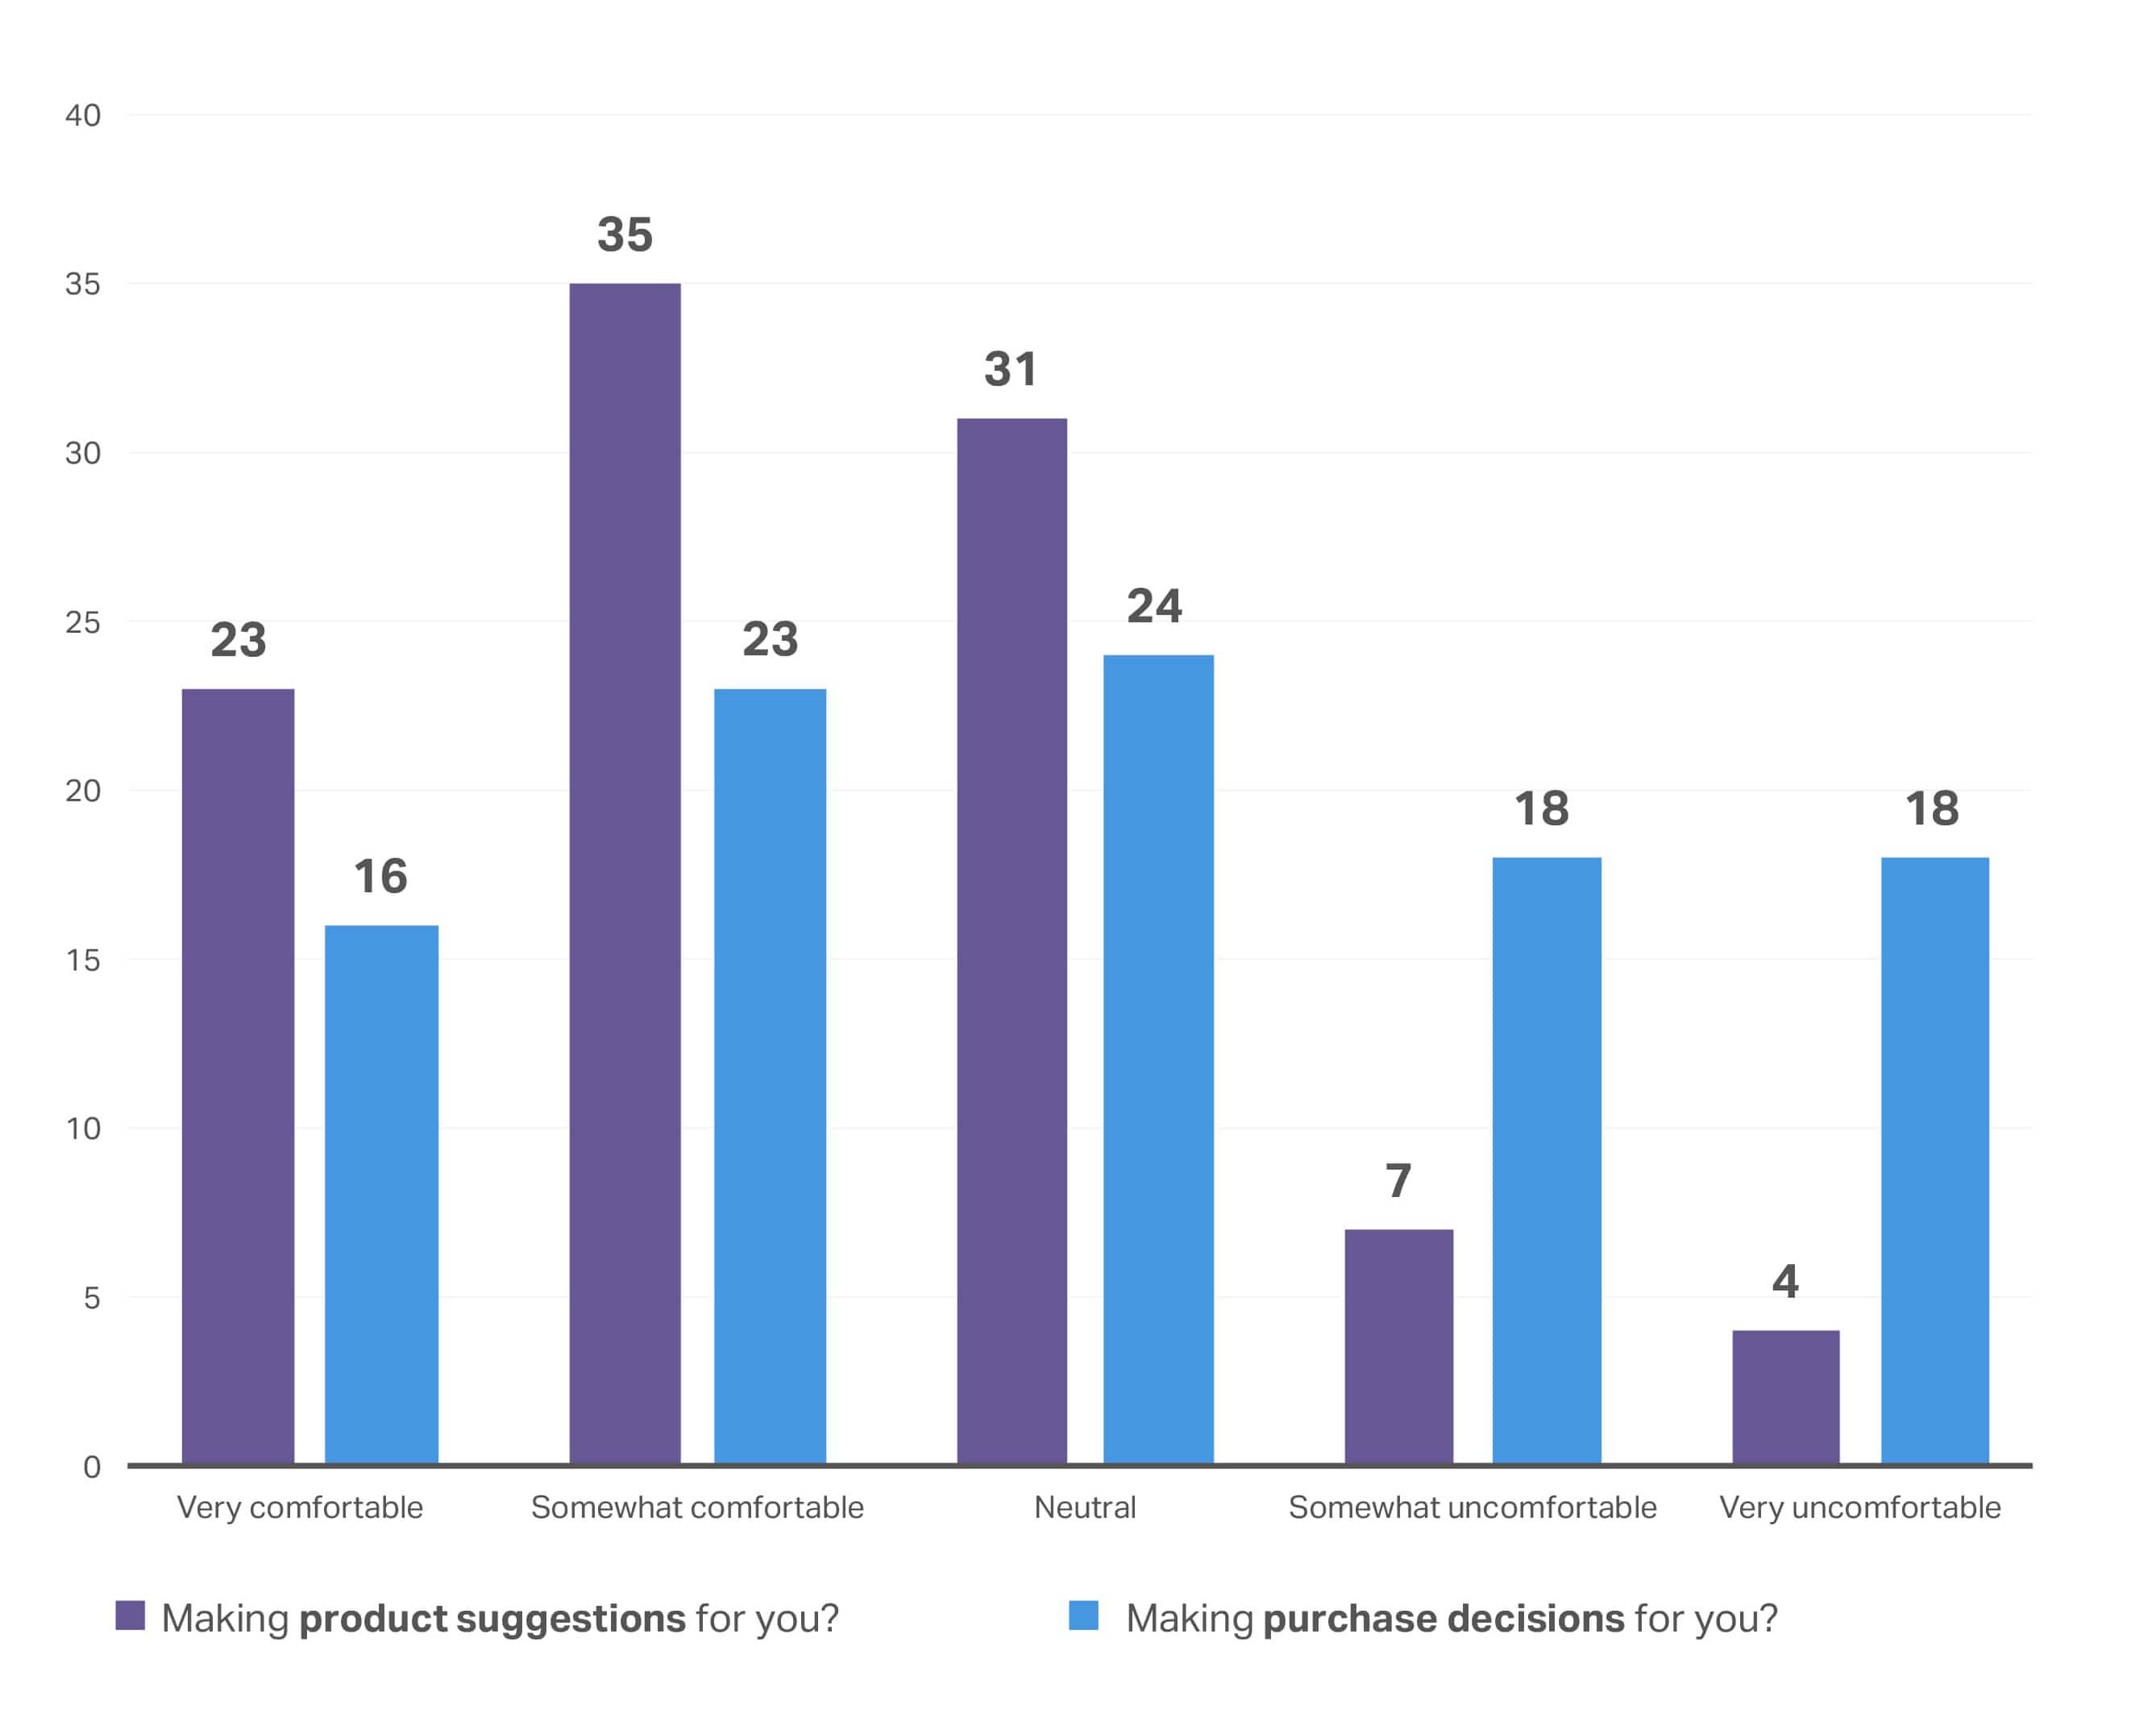
Time-saving features are “nice to haves”
Consumers are actively seeking ways to simplify the buying process. They identified product suggestions based on past purchase as a helpful feature, but most still want to make purchasing decisions autonomously. The ability to compare product attributes is also viewed as a “nice to have” but not necessarily a decision-driver.
I find it helpful when a retailer suggests products to me based on my previous purchases/preferences

How comfortable are you with a digital shopping platform doing the following?
How much more likely would you be to purchase a product if the retailer made it easy to compare key product attributes?

Key takeaways
In spite of cooling global inflation, consumers remain cautious. Even households that are financially thriving are seeking “insurance” through secondary income streams, reflecting lingering uncertainty about future stability. While mandatory expenses like utilities are no longer expected to keep rising sharply, this is more a sign of consumer fatigue than true relief. Core expenses remain protected and prioritized.
Within CPG, the mood has turned constructive. NIQ’s Expanded Omnishopper US data proves that this positive sentiment is lifting household spend across major categories, most notably Health & Beauty (+8%), Baby Care (+7%), Food (+4%), Pet Care (+4%), and Household Care (+3%). Health & Beauty, Baby Care, and Pet Care are seeing stronger engagement with more frequent trips, while Food & Beverage continues to command the lion’s share of household budgets, driven by exceptionally high purchase frequency (227 trips per year vs. 83 for Health & Beauty).
Looking forward, the opportunity shifts from price-led growth to volume and occasion-led growth. Retailers and manufacturers will need to focus on increasing shopping occasions and unit volumes while giving consumers a greater sense of autonomy and control. Simplicity remains critical: Consumers want to feel firmly in the driver’s seat of their spending decisions.
Premium content below

Chapter 2: Brand trust
Relevance is valued above rhetoric
95%
of consumers say trusting the brand they are buying from is very or somewhat important
In recent years, consumers demanded brands share their values when it comes to attributes like ethical sourcing and sustainable packaging. For 2026, these values are table stakes—baseline expectations brands must fulfill to compete—but they won’t win the game.
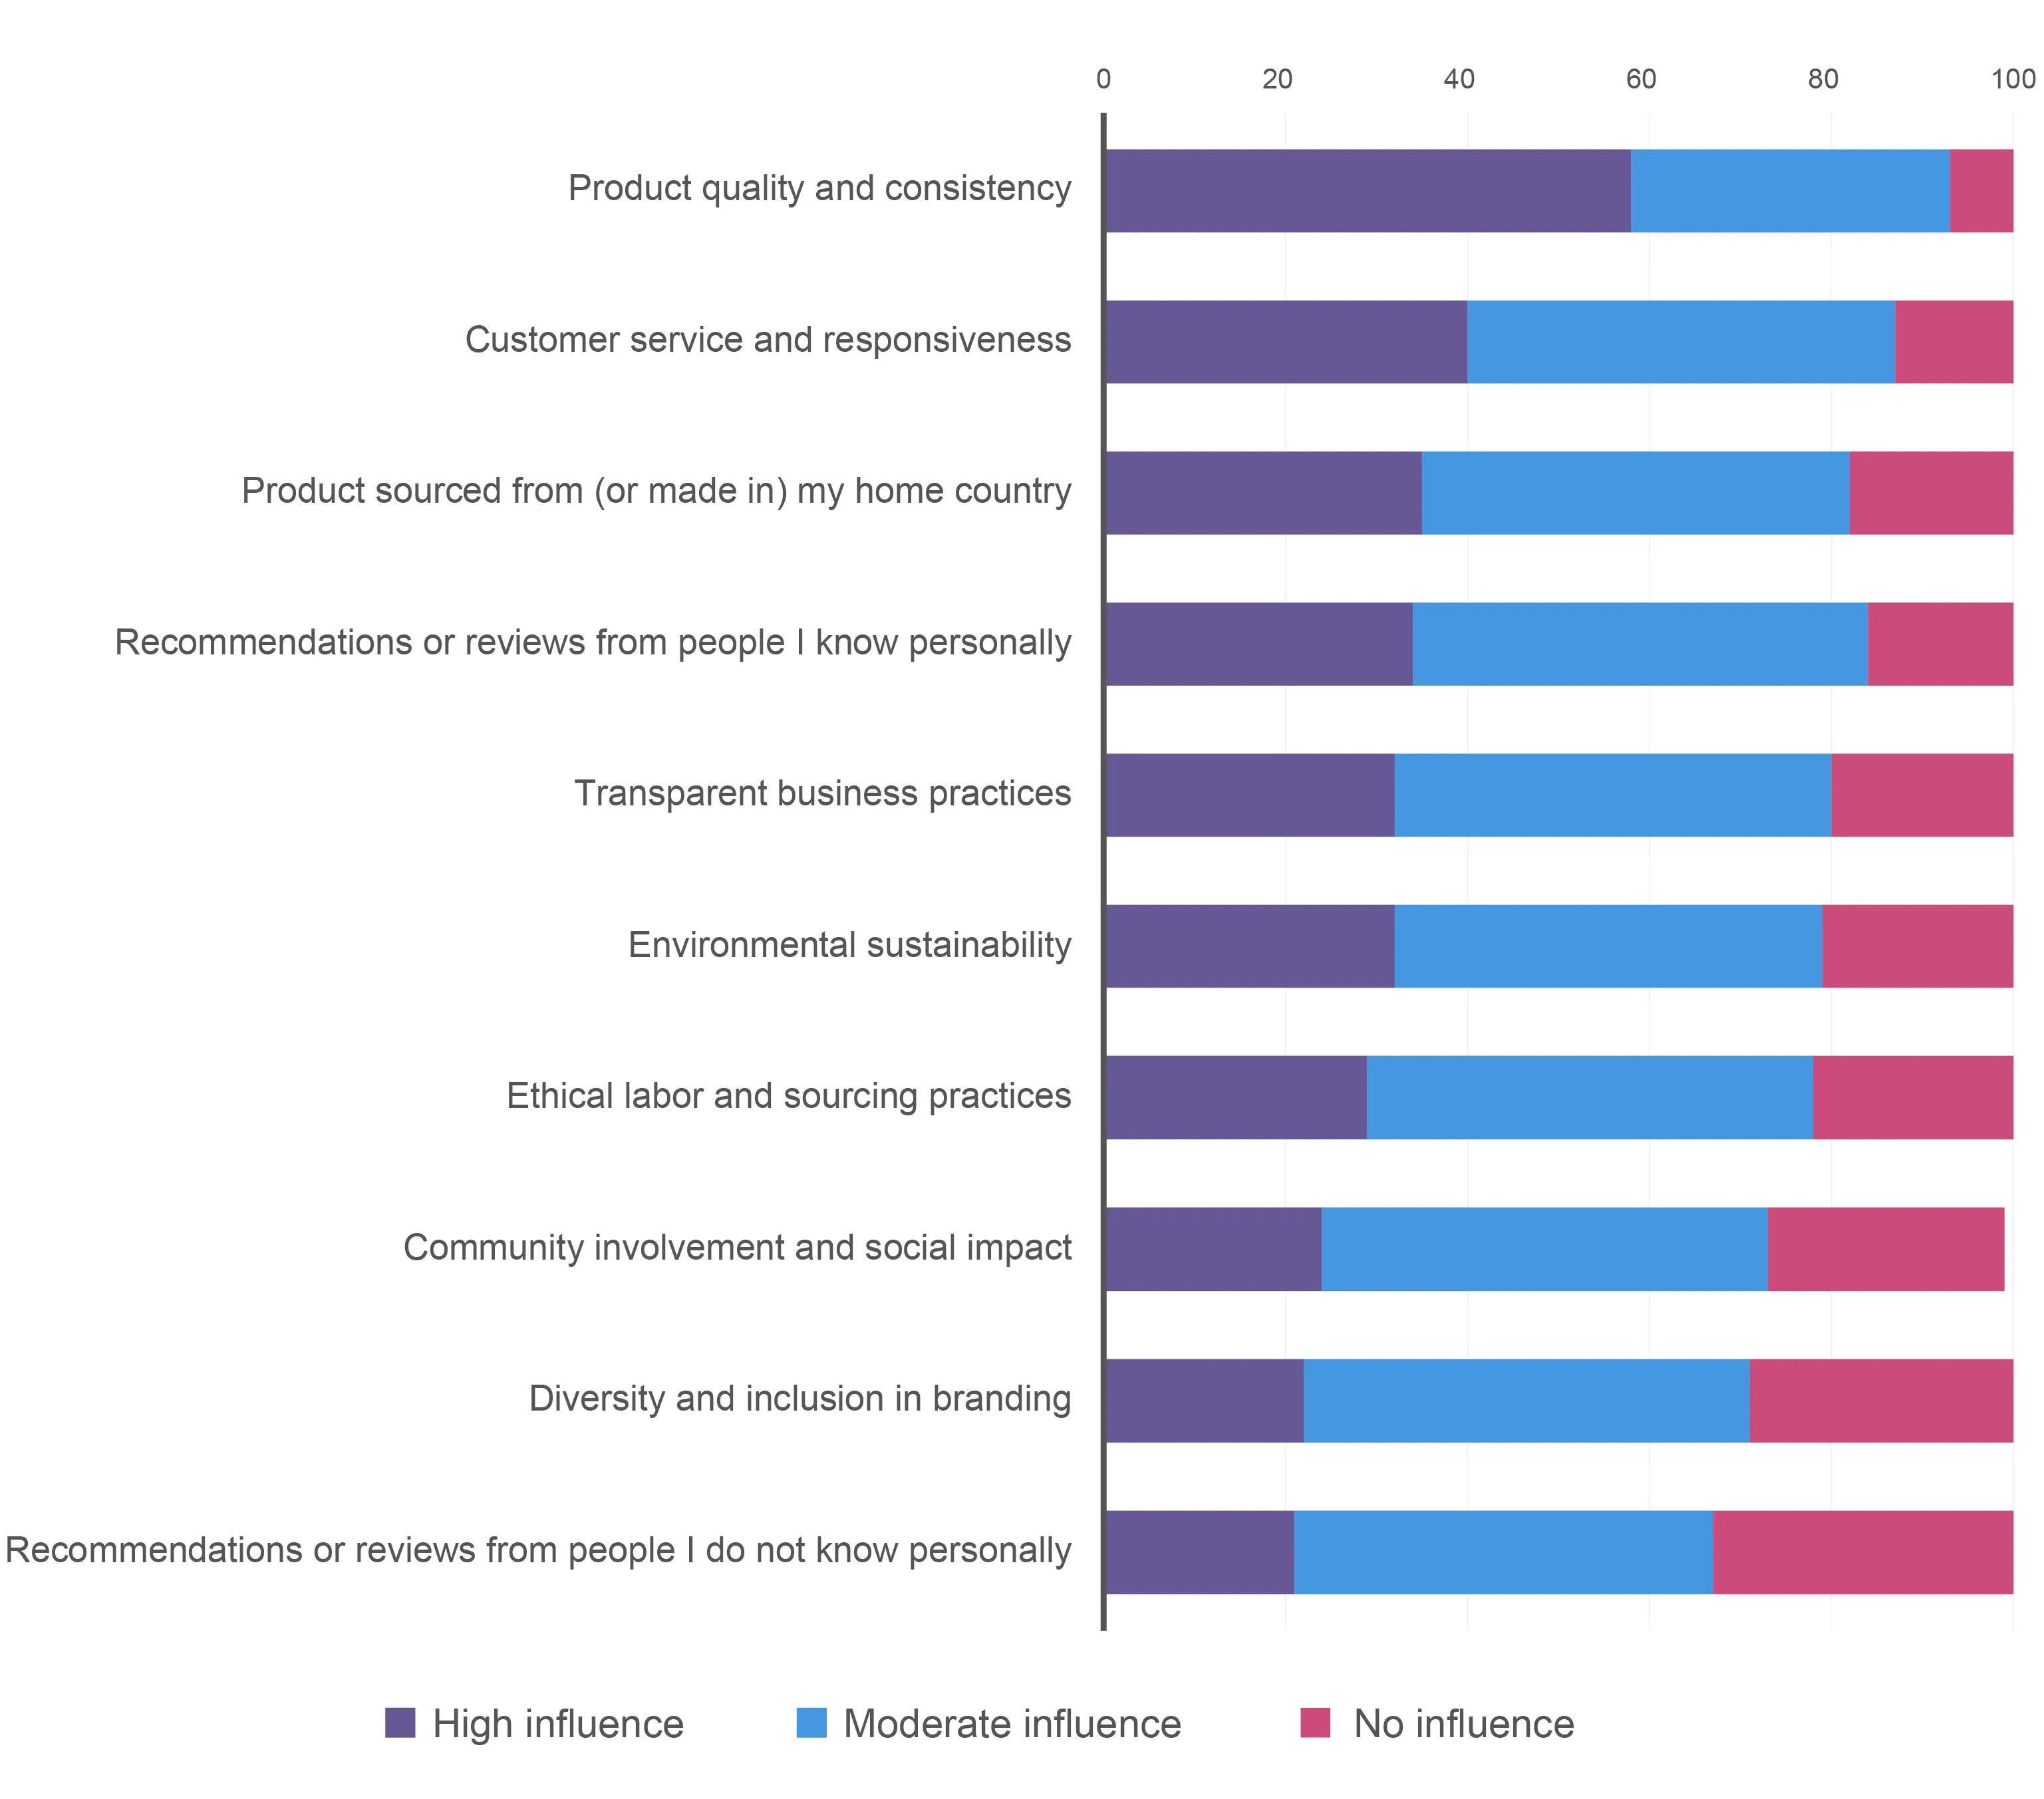
Today’s consumers are seeking lived alignment where performance earns trust. Functional quality is the biggest factor influencing trust in both high-growth and mature markets. Better-for-you claims, ingredient simplicity, and clean formulations are important, but the product must also meet consumer expectations for quality and consistency.
For the global consumer, customer service and responsiveness is the second most influential factor for building trust, trumping diversity, social impact, and sustainability, each of which skewed toward “nice to haves” in our survey.
To what degree do the following factors influence your trust in a brand?
Brands must align with consumer values
While quality and consistency are the foundation of consumer trust, brands have to dig deeper to connect with the unique shopper values and traits that define that trust from person to person. After the past few years of disruption, there are a few common lifestyle factors, shopping habits, and consumption patterns that can help retailers and manufacturers deliver on what matters most to their consumers.
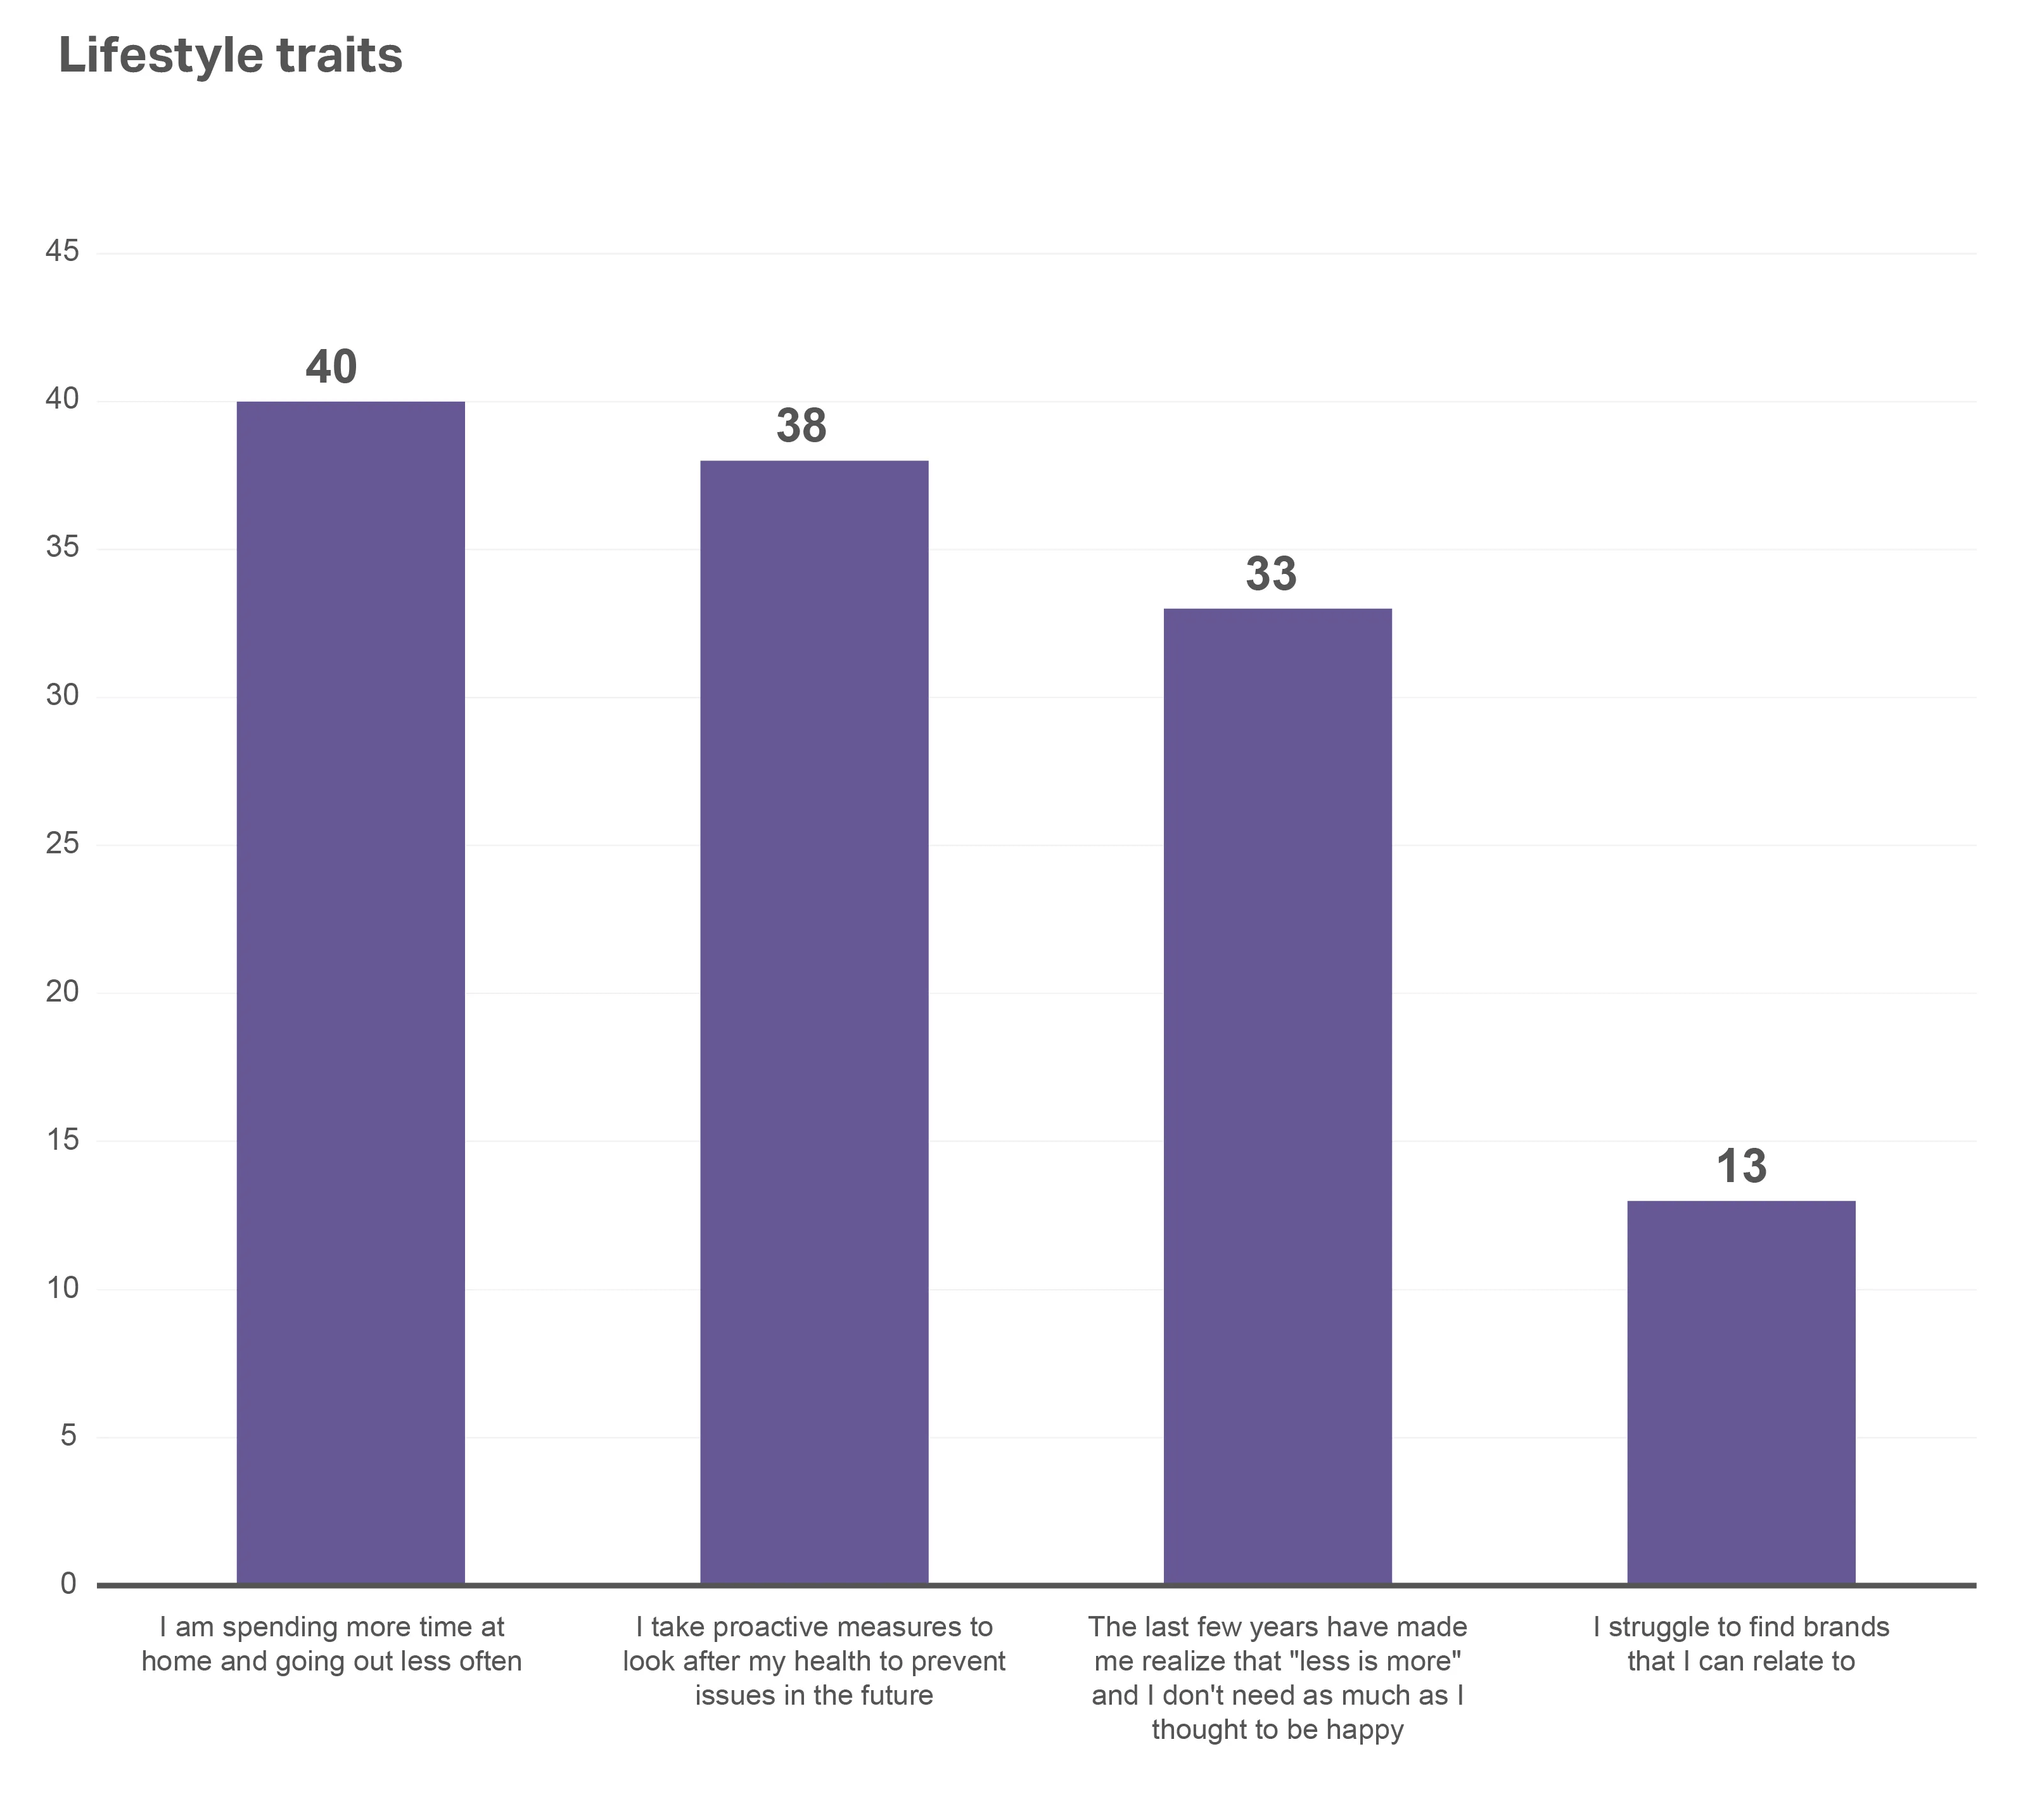
33%
of global consumers feel that the last few years have made them realize that “less is more”—and that they don’t need as much as they thought to be happy
Our survey revealed that global respondents say their lifestyles and priorities have shifted after the events of the last few years, and their mindsets are focused on spending more time at home/going out less (40%) and taking proactive measures to prevent health issues (38%). In addition to feeling like less is more, today’s consumer values simplicity, as only 13% of those surveyed said they struggle to find brands that they can relate to. Differentiating your brand from the abundance of options on the shelf will be determined by those who find ways to align their products to this new thoughtful outlook.
When it comes to AI advances in retail, the lion’s share of attention has been attributed to finding operational efficiencies and boosting productivity. The direct advantages to consumers, however, shouldn’t be overlooked. These benefits often take the shape of simplicity, convenience, and reliability—values that build trust.
Take the moment of purchase, for example. A slow payment field, integration glitch, or failed promotion code can cause shoppers to abandon a product despite a positive experience up to that point. AI-driven checkout optimization platforms help alleviate these issues by leveraging real-time signals—such as cart total, shopper location, and past behavior—to dynamically adjust shipping options, upsells, and delivery promises.
A recent US-based survey from Bain & Co. surfaced three core benefits of AI to shoppers (and the retailers they’re purchasing from) as it pertains to building loyalty and trust:
- Customers value passive generative AI features, such as review summarization, when these are embedded in their journeys—sometimes even more than standalone generative AI tools.
- Online shoppers recognize the potential for personalization with generative AI and appear more willing to share personal data in this context.
- Generative AI can deliver more efficient customer service, especially in parts of the journey that are typically harder to reach.
With the proliferation of generative AI tools, consumers are becoming increasingly comfortable sharing data and engaging with AI-enabled experiences. As these tools continue to create hyper-personalized and conversational journeys, they have the potential to transform shopping end-to-end—from early acquisition through post-purchase care. In a consumer-driven environment where values are paramount, generative AI is enabling brands and retailers to build more authentic and enduring customer relationships.
Consumers’ spending intentions are being shaped by shifting lifestyle traits
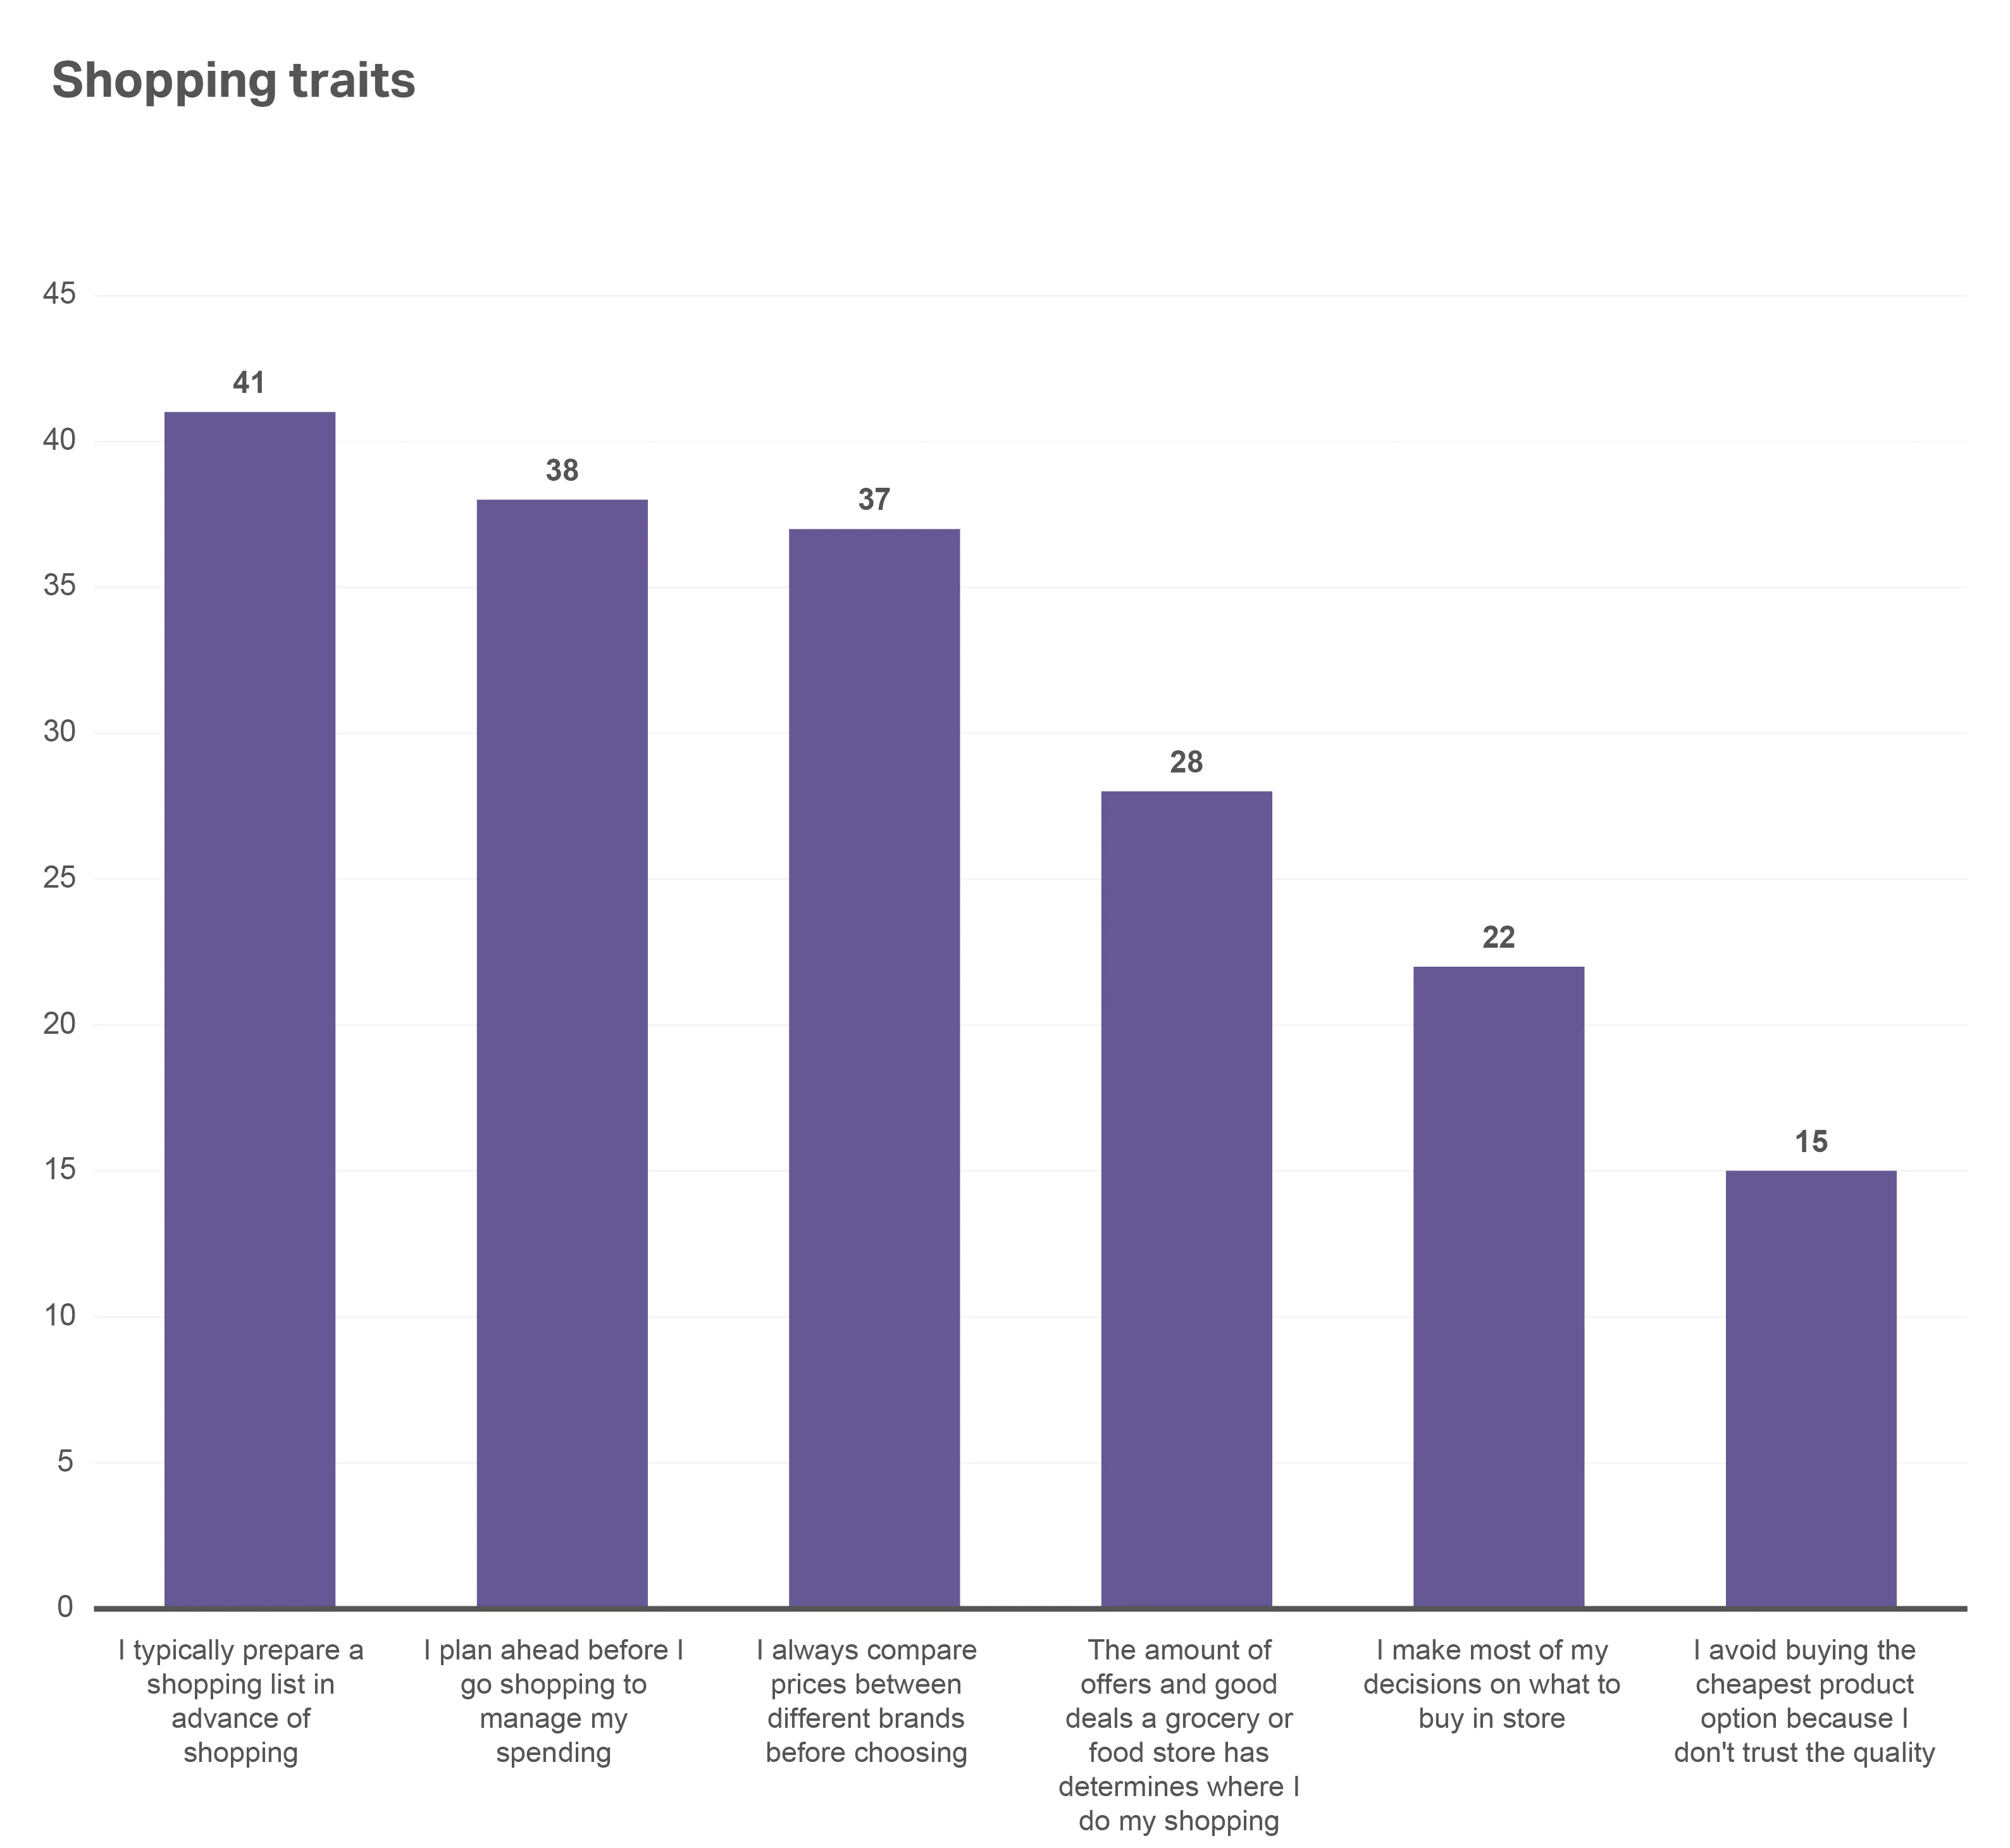
While regular shopping trips aren’t immune to impulse purchases, our data shows that many global shoppers at least have a plan in place when they go into a store. Four in 10 (41%) say they prepare a shopping list in advance, and 38% plan ahead specifically to manage their spending—compared with 22% who say they make most of their purchase decisions while in the store.
Price is always a factor, of course, but it may be less associated with product quality than brands might assume. While 28% of shoppers say that good deals determine where they do their shopping, only 15% say they avoid buying the cheapest product option because they don’t trust the quality. Shoppers know what they’re shopping for but are open to a wide range of choices depending on which one covers most of their needs.
Shoppers are likely to know what they’re shopping for, but are open to multiple brand options
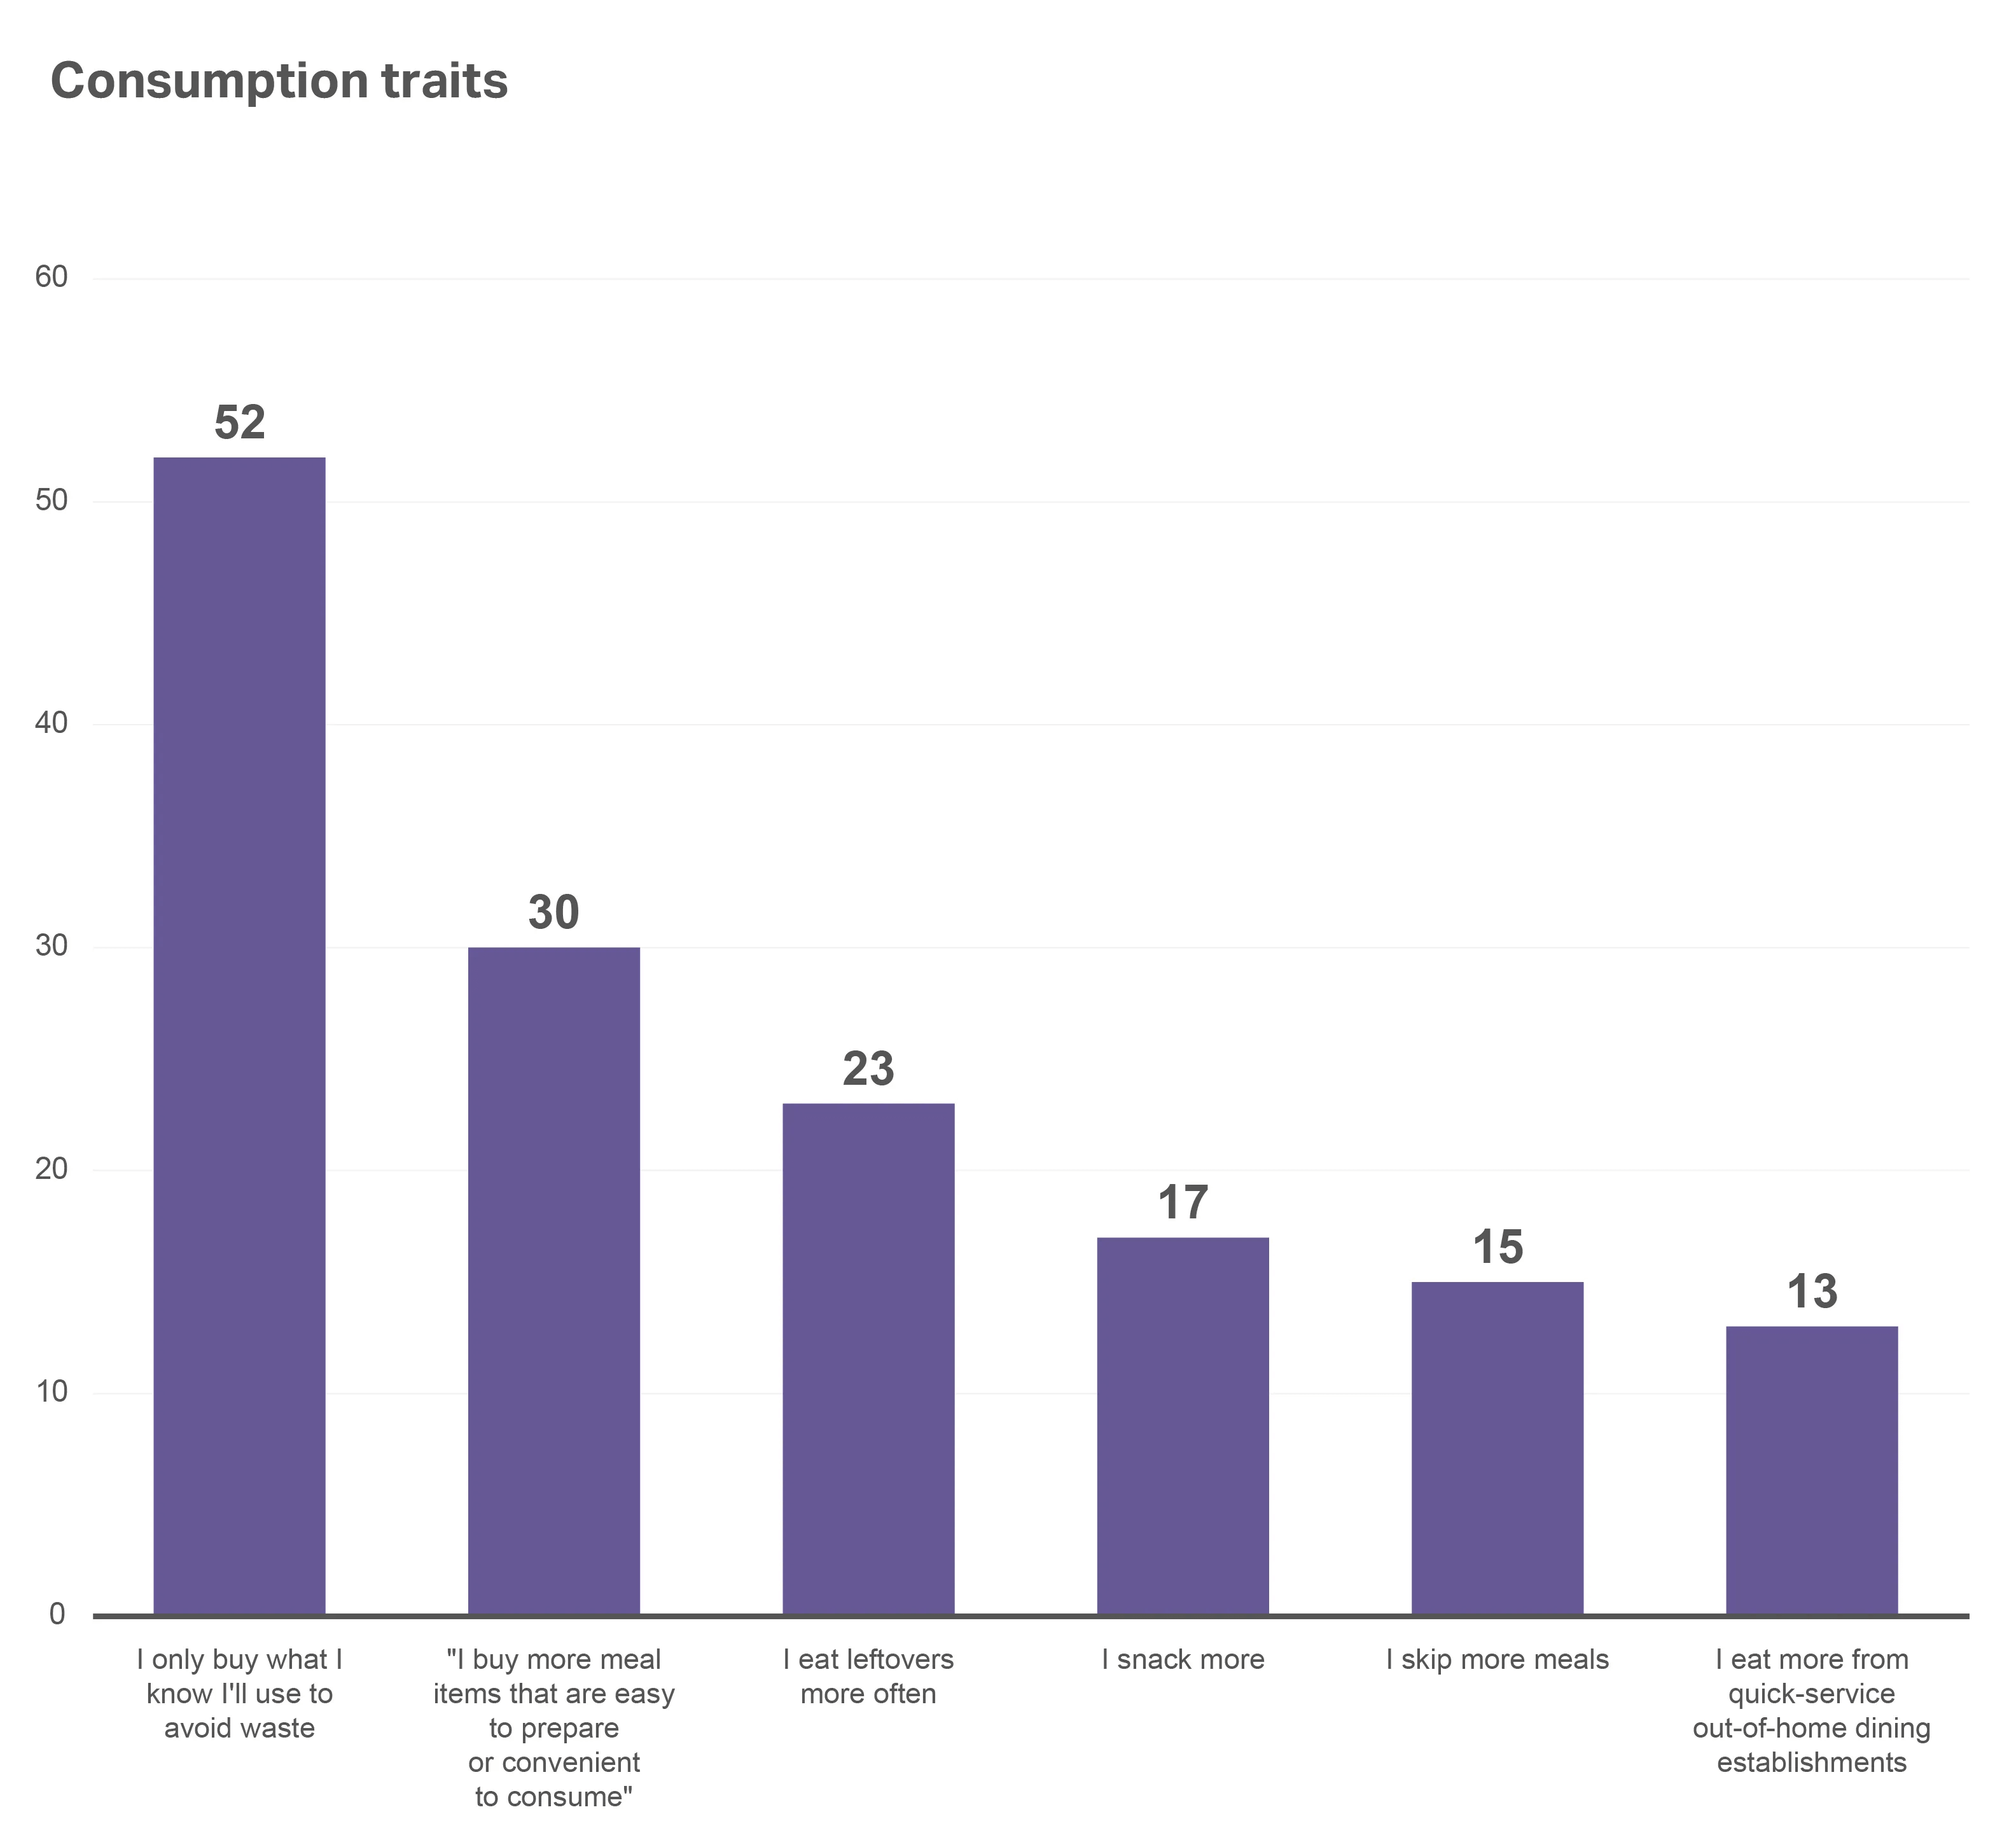
Mirroring this thoughtful approach, when asked to think about their consumption habits in the last year, 52% of respondents said they only buy what they know they’ll use to avoid waste. Shoppers also prioritized buying meal items that are easy to prepare/convenient to consume (30%) over skipping meals (15%) or eating at quick-service out-of-home dining establishments (13%). Manufacturers and retailers need to demonstrate product traits that can help shoppers cut corners while still consistently delivering on quality promises.
Consumers are focused on eliminating waste and maximizing convenient meals
In short, today’s shoppers are open to a wider range of brands—even when they have a shopping list in hand—and aren’t afraid to deviate from their plan if they find a new brand that helps them accomplish their goals.
Cultural fluency trumps global gloss
Gone are the days when manufacturers and retailers could roll out the same campaign—across the same distribution channels—in every market and expect to win. Consumers in places such as West Africa, Southeast Asia, and the Middle East are looking for brands that customize products and marketing to local nuance, language, and design aesthetics. They also want brands to meet them where they are—in-store and online.
For example, every Chinese respondent across our global survey has used a social media platform to purchase a product, compared with just 53% of global respondents. This digital experience is now embedded into China’s shopping DNA, and brands that don’t meet the Chinese consumer effectively across social media should expect to lose in this market.
Product claims winning with US consumers
Product labeling has become essential relative to earning trust and aligning with consumer values. For example, in the US, clean label is becoming an increasingly important attribute when examining global product growth. Clean label products currently account for 10% of US sales, but they’re growing at a rate of +7.5% vs. last year—compared with a growth rate of 5.9% for all FMCG products. The dollar buy rate for clean label products has similarly grown +5.9% vs. last year—and indexes at 136 compared with FMCG overall.
FMCG product claims impact growth
| Growing faster vs. FMCG goods overall | Growing at the same rate vs. FMCG goods overall | Growing slower vs. FMCG goods overall |
| Clean label | Sustainable packaging | All-natural ingredients |
| Environmental sustainability | Natural positioning | Artisanal |
| Social responsibility | Free from preservatives | Nutrient dense |
| Non-GMO | Made in US | Fiber-related claims |
| Protein rich | Fortified | |
| Organic |
Key takeaways
Shoppers today are balancing practical needs with values that build trust. The last few years have shifted priorities: Shoppers are prioritizing simplicity, health, and minimizing waste. That mindset influences how they plan trips, what they put in their baskets, and which brands they purchase for the first time—and which brands they stay loyal to.
AI has added a new dimension to this equation, and the technology is just getting started. Beyond productivity gains for manufacturers and retailers, its real impact lies in the consumer experience. Faster, smoother checkouts, accurate inventory, advanced customer service, and personalized offers are all working to reduce friction and reinforce reliability—qualities that signal to shoppers that a brand should be trusted.
At the same time, shoppers are approaching purchases with more intention. They remain open to alternatives if another brand more closely aligns with their values or offers better convenience. This creates opportunity for manufacturers and retailers who can clearly demonstrate quality, ease, and alignment with consumer priorities—whether that’s via product claims, the right assortment, or transparent labels.
Looking ahead, building trust will depend on striking the right balance: global scale paired with cultural fluency, technology that delivers both efficiency and empathy, and brand promises that map to continually evolving lifestyles. The companies that earn loyalty will be those that not only adapt to shoppers’ changing habits but are also able to prove that they understand what matters most to consumers.

Chapter 3: Seamless commerce: The omni revolution continues
Digital integration and accessibility
Commerce is undergoing a transformation: Consumers no longer shop channels; they move across platforms, touchpoints, and moments. Around the globe, digital tools are revolutionizing CPG baskets. Livestreamed shopping is the norm in China, WhatsApp and voice ordering are part of everyday life in Latin America (LATAM), and in-store digital augmentation (e.g., smart shelf technology, augmented reality) is accelerating in Europe and India.
Amid this transformation, a new reality is beginning to surface. Let’s look at several critical changes brands must make to compete.

Retailers are the new media platforms
Brand visibility—and in-store distribution—now depends on paid access and data fluency. Retailers that leverage retail media networks (RMNs), creator commerce, or platform-exclusive SKUs can monetize attention and real estate, in addition to the product.
The transformational power and potential of retail media

The path to purchase is nonlinear
Something we’ve observed over the last few years is that discovery and conversion are decoupled. Consumers may discover a product on social media, compare it on a search engine, then buy it through a messaging app. To capture the sale, brands must be present across the shopper journey and not just on the shelf.
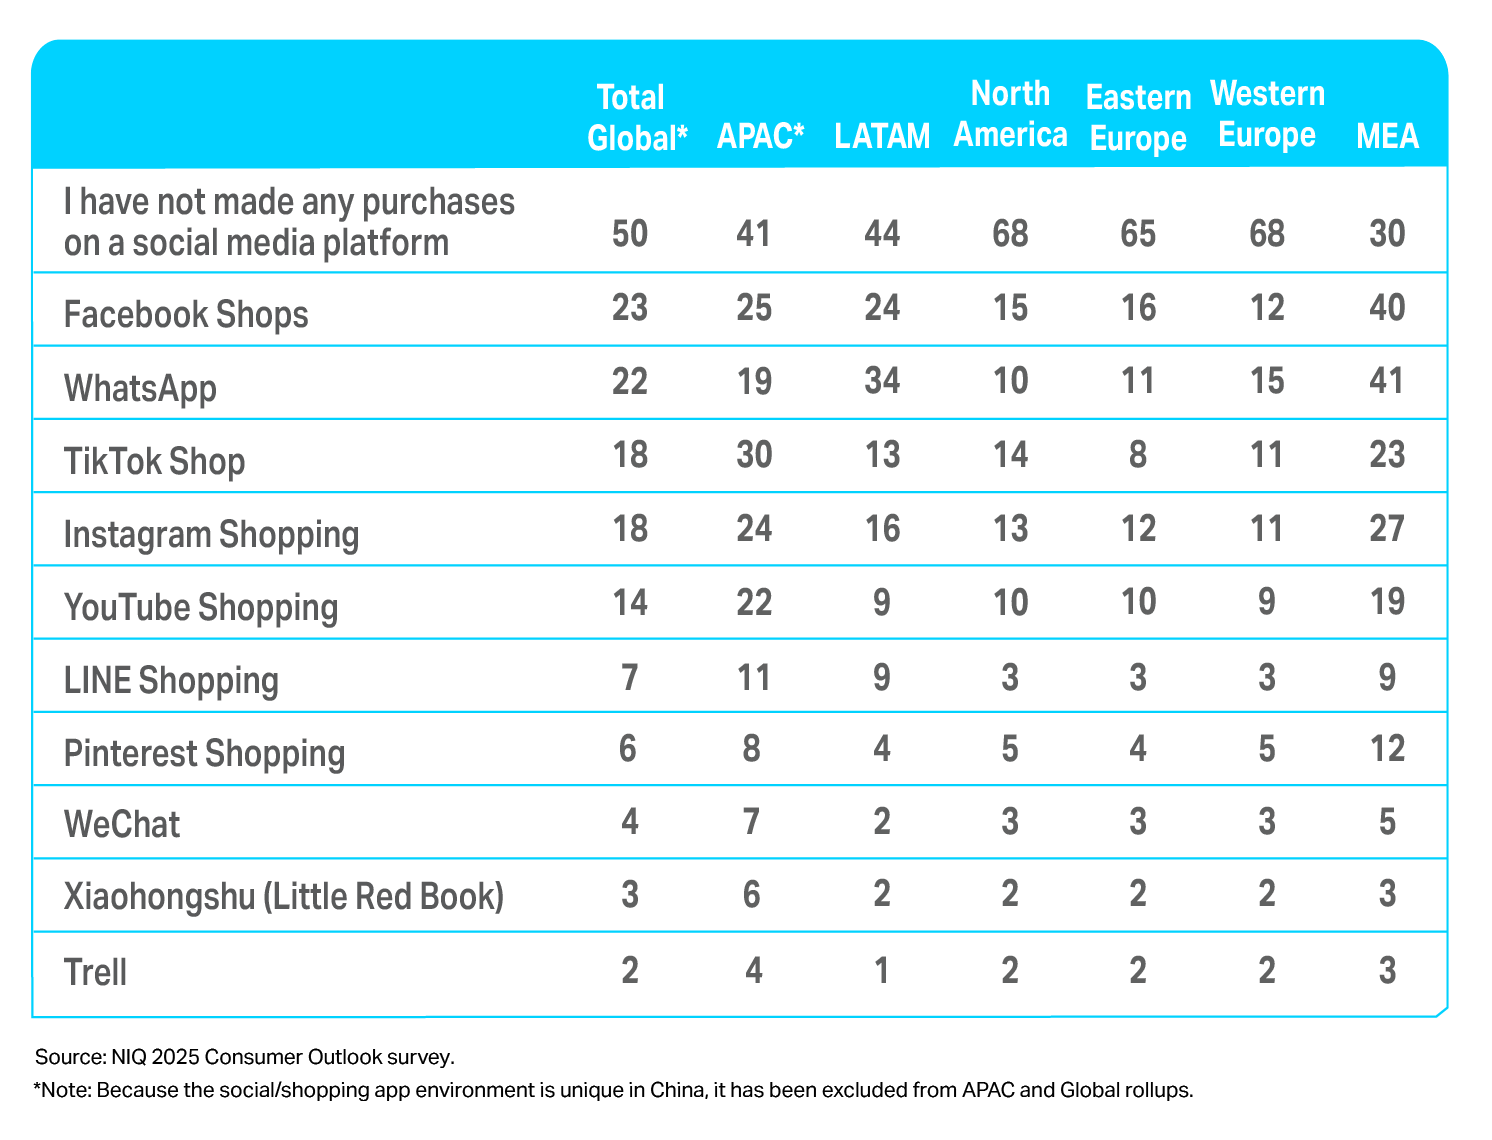
Social shopping is gaining steam
Today, social shopping is strongest in Asia Pacific (APAC) and Middle East & Africa (MEA), but its adoption is growing globally. TikTok, in particular, is driving social shopping growth in many markets, and its users often spend more online. A lack of trust in the security of payment information is what typically holds consumers back.
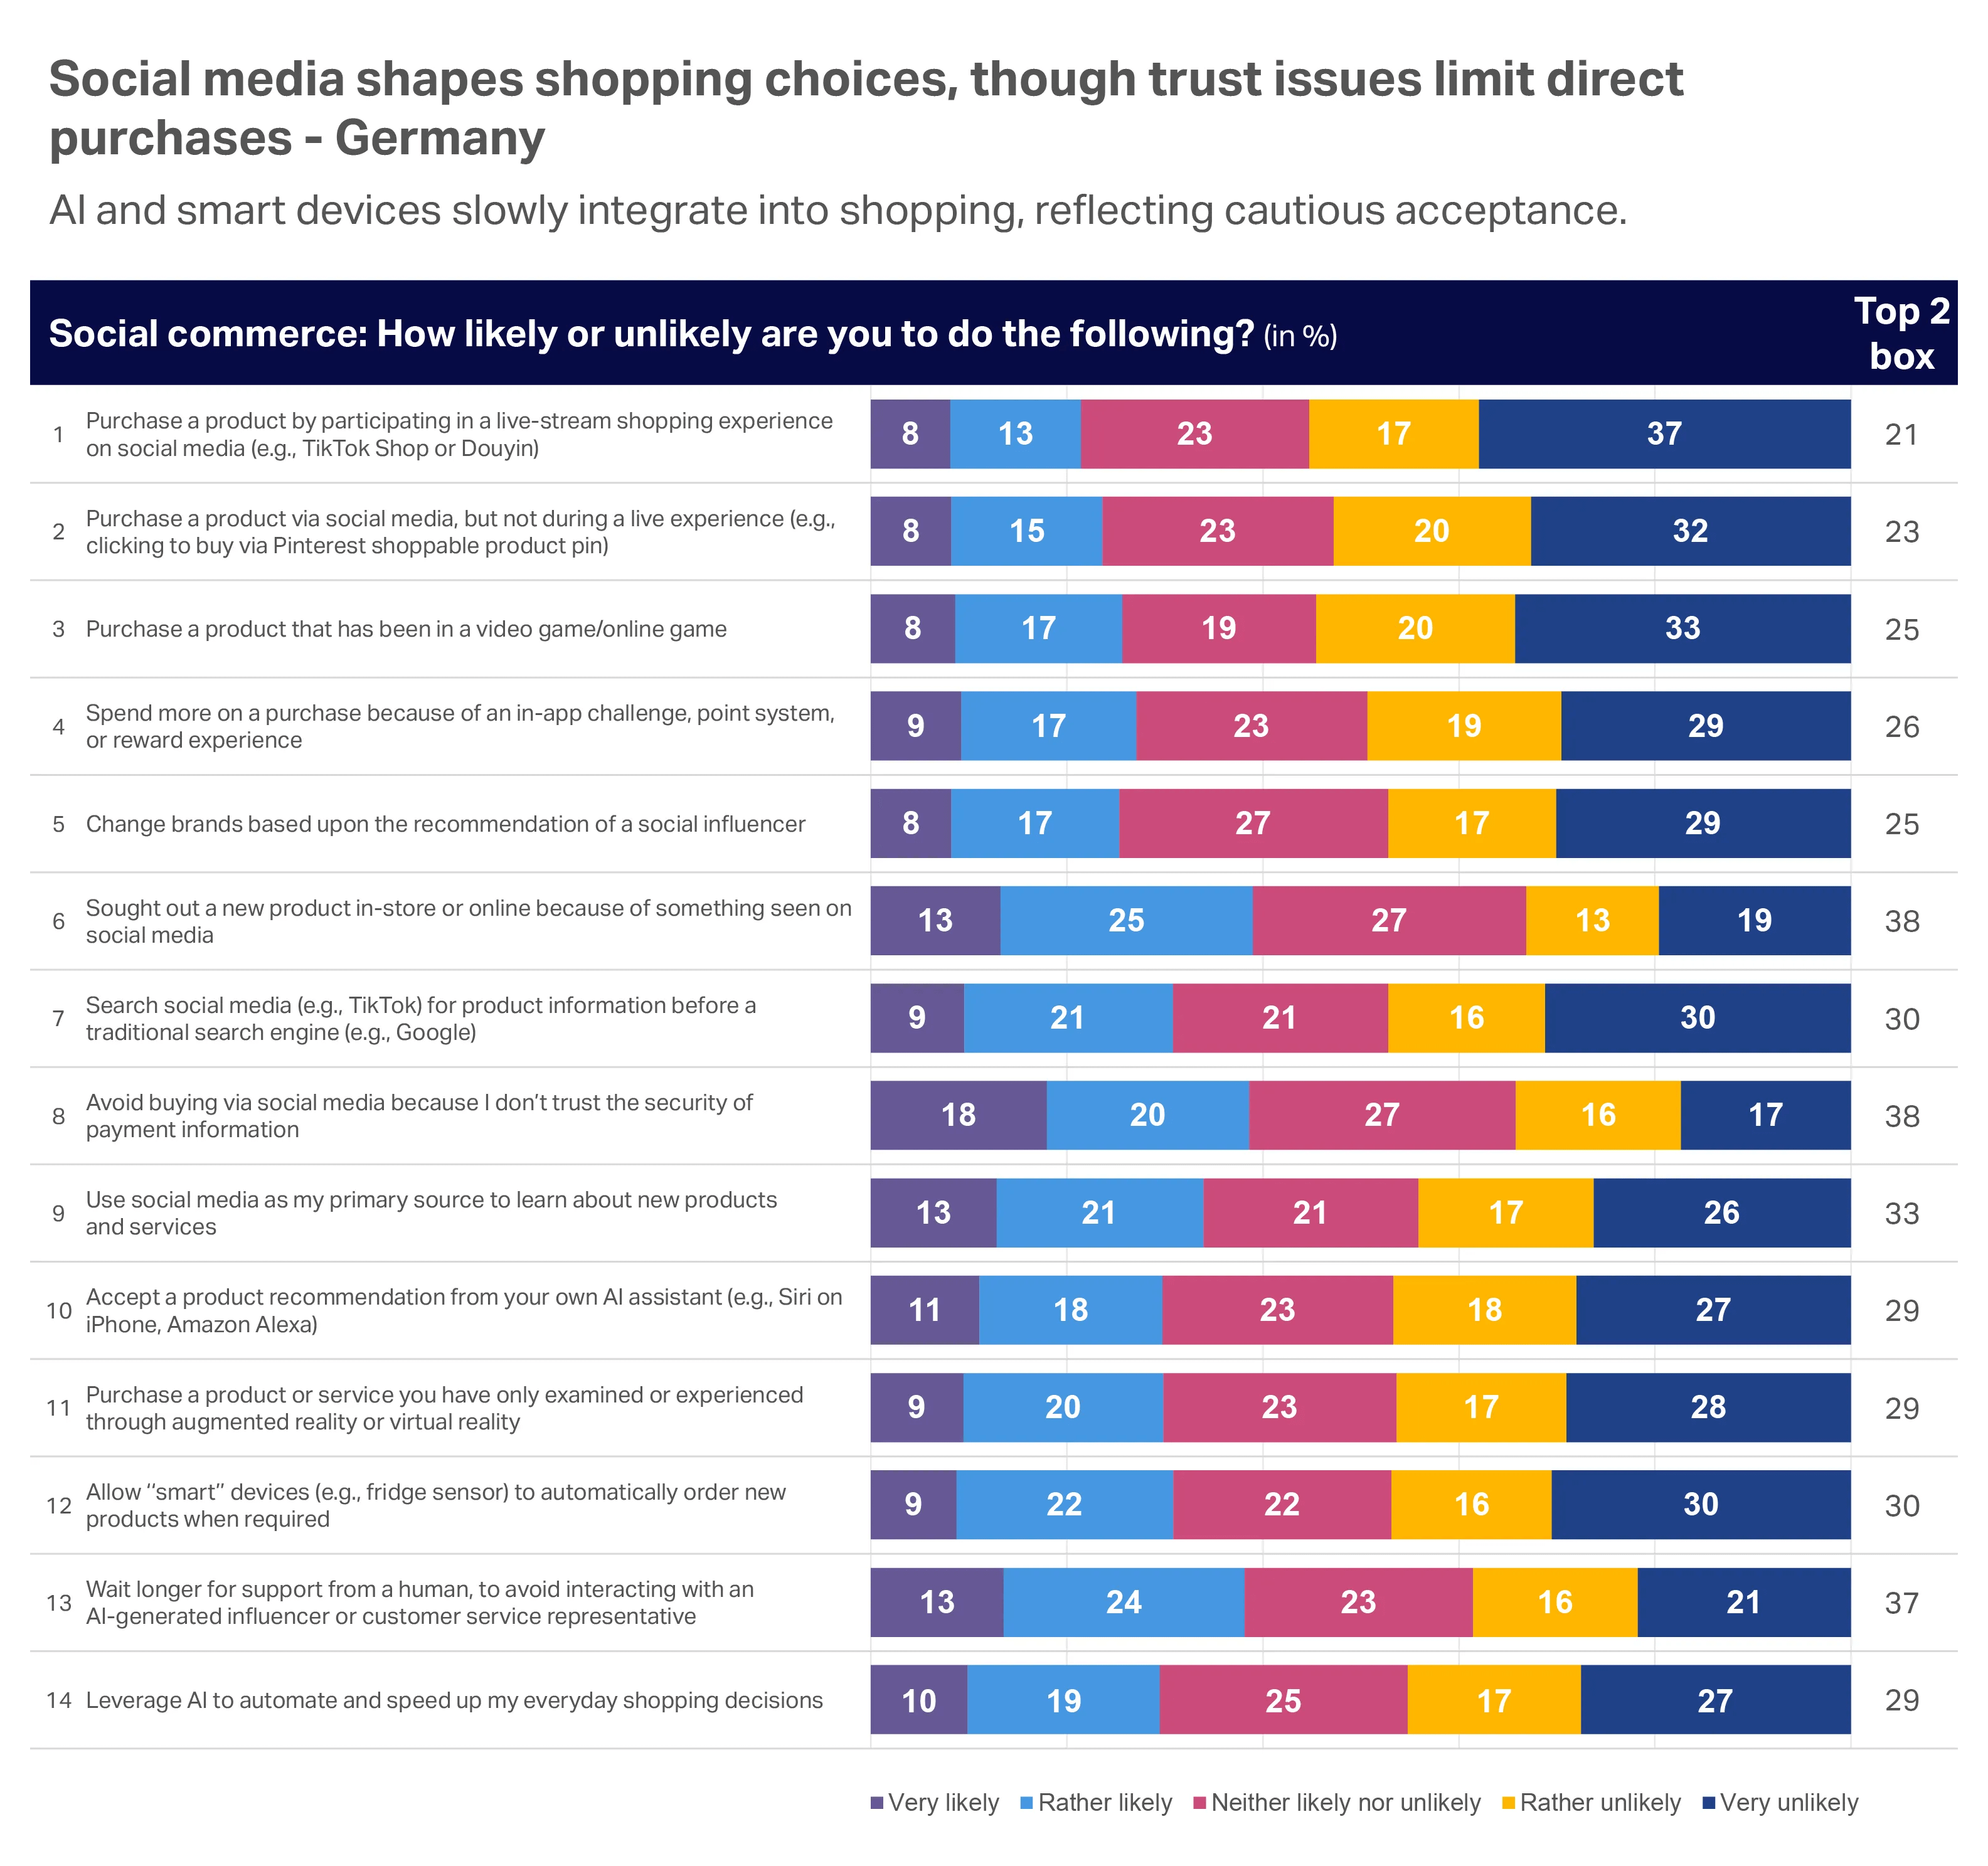
Base: All German online grocery shoppers surveyed
Have you ever purchased a product directly through any of these social media platforms?
Seamless doesn’t mean digital-only
E-commerce may be the fastest growing channel globally, but that’s not the full story. For example, in South Asia and Sub-Saharan Africa, growth is accelerating via the integration of local store networks (e.g., Kirana, Spaza shops) with digital platforms.
In the US, Expanded Omnishopper data insights reflect this trend, as in-store purchases lost 3 share points to online purchases when compared with last year, but they still make up around 77% of FMCG sales. In-store also lost 2.3% of occasions per buyer per year, while online occasions are up 16%. However, the dollar spend per household per year in-store ($8,222) remains almost three times higher than online ($2,737). Knowing this, brands should look to digital for growth but should not lose focus on serving in-store consumers as well.
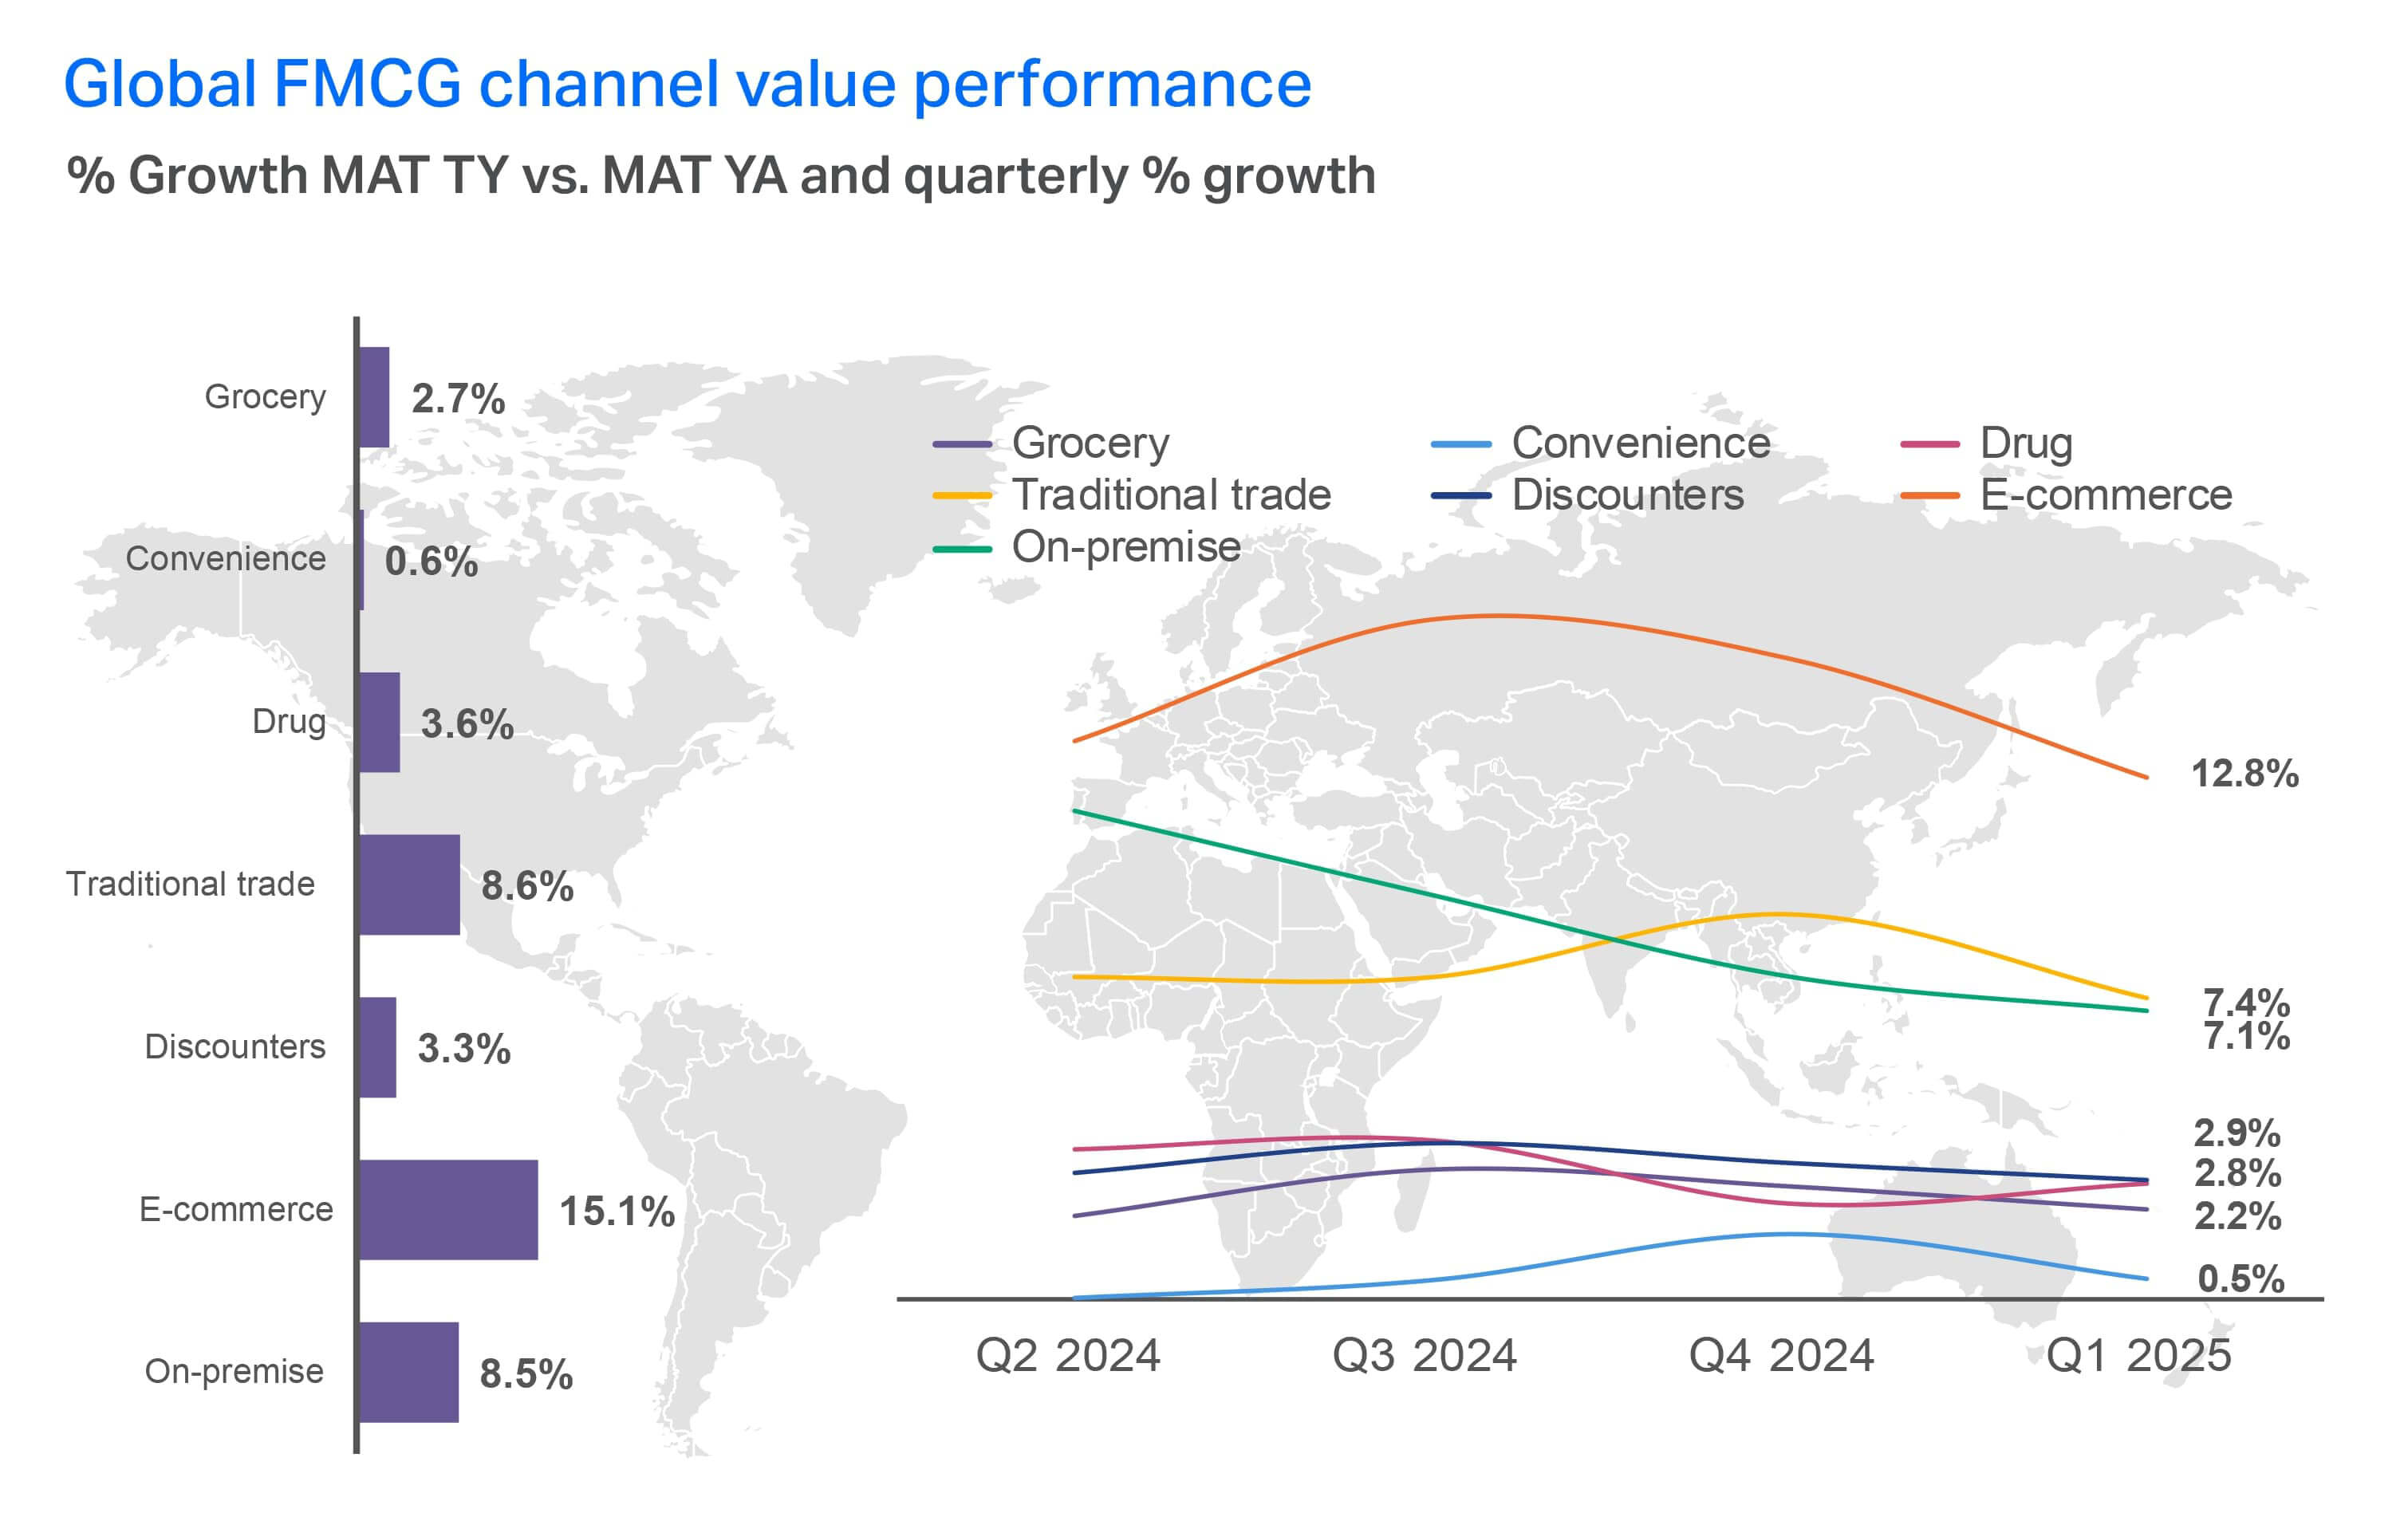
Global FMCG channel value performance

When we look at value performance by region, you can see that LATAM and APAC are experiencing growth across traditional trade and on-premise. And superettes are delivering the fastest value growth in grocery. In the US, Expanded Omnishopper data shows that online sales are shifting grocery’s dollar share (-1.2 points) toward mass merchandisers (+0.8 points), while online and in-store is favoring warehouse club retailers (+1 point). Drug stores (2.8 share points) and dollar stores (3.5 share points) continue to be small contributors to FMCG sales. They are both down over last year, driven by fewer in-store sales.
Small superettes delivered the fastest value growth among grocery channels in the MAT, increasing 8%
Key takeaways
Commerce continues to shift from structured channels toward seamless journeys. Shoppers are no longer bound to one path. They move fluidly between social platforms, search engines, messaging apps, RMNs, and stores. Discovery and purchase are increasingly disconnected, which changes how brands must think about visibility and conversion. Retailers themselves are evolving into media platforms, using retail media networks and exclusive digital offerings to monetize both data and shelf space.
The rise of social commerce adds another layer of change. Platforms like TikTok and WhatsApp are fueling rapid adoption across APAC and LATAM, while Europe and North America follow at a slower but steady pace.
Yet, despite the growth of digital, in-store remains dominant—nearly three-quarters of FMCG sales still occur offline, with household spend almost three times higher in physical retail than online. This balance underscores the importance of scale and presence across formats.
Looking forward, success will not come from digital acceleration alone. Manufacturers and retailers must capture growth by expanding occasions and building volume both online and in-store, while giving consumers confidence, control, and a sense of simplicity across the journey. The winners will be those who deliver consistency in a fragmented world, meeting shoppers wherever they choose to engage.

Chapter 4: Trends to watch
Lifestyle changes, supply chain volatility, and consumer trust will lead the way to 2026
The most disruptive signals of change are no longer on the periphery. Global brands need to monitor early-adopter shifts that promise to redefine category norms and rewire value perception—particularly across health, climate, and technology.
The anti-obesity medication (AOM) effect is going global
Over one-third of global consumers say they’re likely to use a medication or drug to support weight loss. AOMs are helping millions of consumers reduce their appetites and, in turn, are fundamentally shifting the way those who take them view food, wellness, and their bodies. While adoption of these medications varies by region, their increased use is creating space for innovation in functional snacking, portion-controlled formats, and metabolic health.
We’re seeing incrementality in CPG for conscious snacking, fiber and protein, digestive health, supplements and vitamins, and gum and mints. Consumers are also shifting spend away from food excess, tobacco, and alcohol in favor of monthly doses of medications, as well as lifestyle and fitness activities.
>50%
of consumers are willing to pay more for:
- Fresh products without preservatives
- Healthier options (low/no sugar, salt, carb, fat, caffeine, alcohol)
- GMO free/Organic/Natural
The desire for weight loss isn’t purely aesthetic. Learn more about what’s driving consumers’ appetite for AOMs in NIQ’s Global State of Health & Wellness 2025 report.
AOM-companion/friendly claims on packaging is still an emerging space. In the United States today, products that state these claims are generating $271 million in sales, according to NIQ’s Retail Measurement Services (RMS) data, yet FMCG products that qualify to make such claims represent $117 billion in total sales. This presents manufacturers and retailers with a unique opportunity to start making AOM-supportive claims on products and/or launch AOM-targeted product lines.
FMCG brands in the grocery space should also take note that research shows that consumers taking AOMs are consuming up to 40% fewer calories. In the US, this is leading to a 6% reduction in grocery spend (9% for high-income households). Products taking the hit are often ultra-processed foods like chips and savory snacks (-11%), sweet bakery items (-9%), and soft drinks (-7%). Some experts believe these declines could reduce snack food growth by as much as $12 billion through 2035.
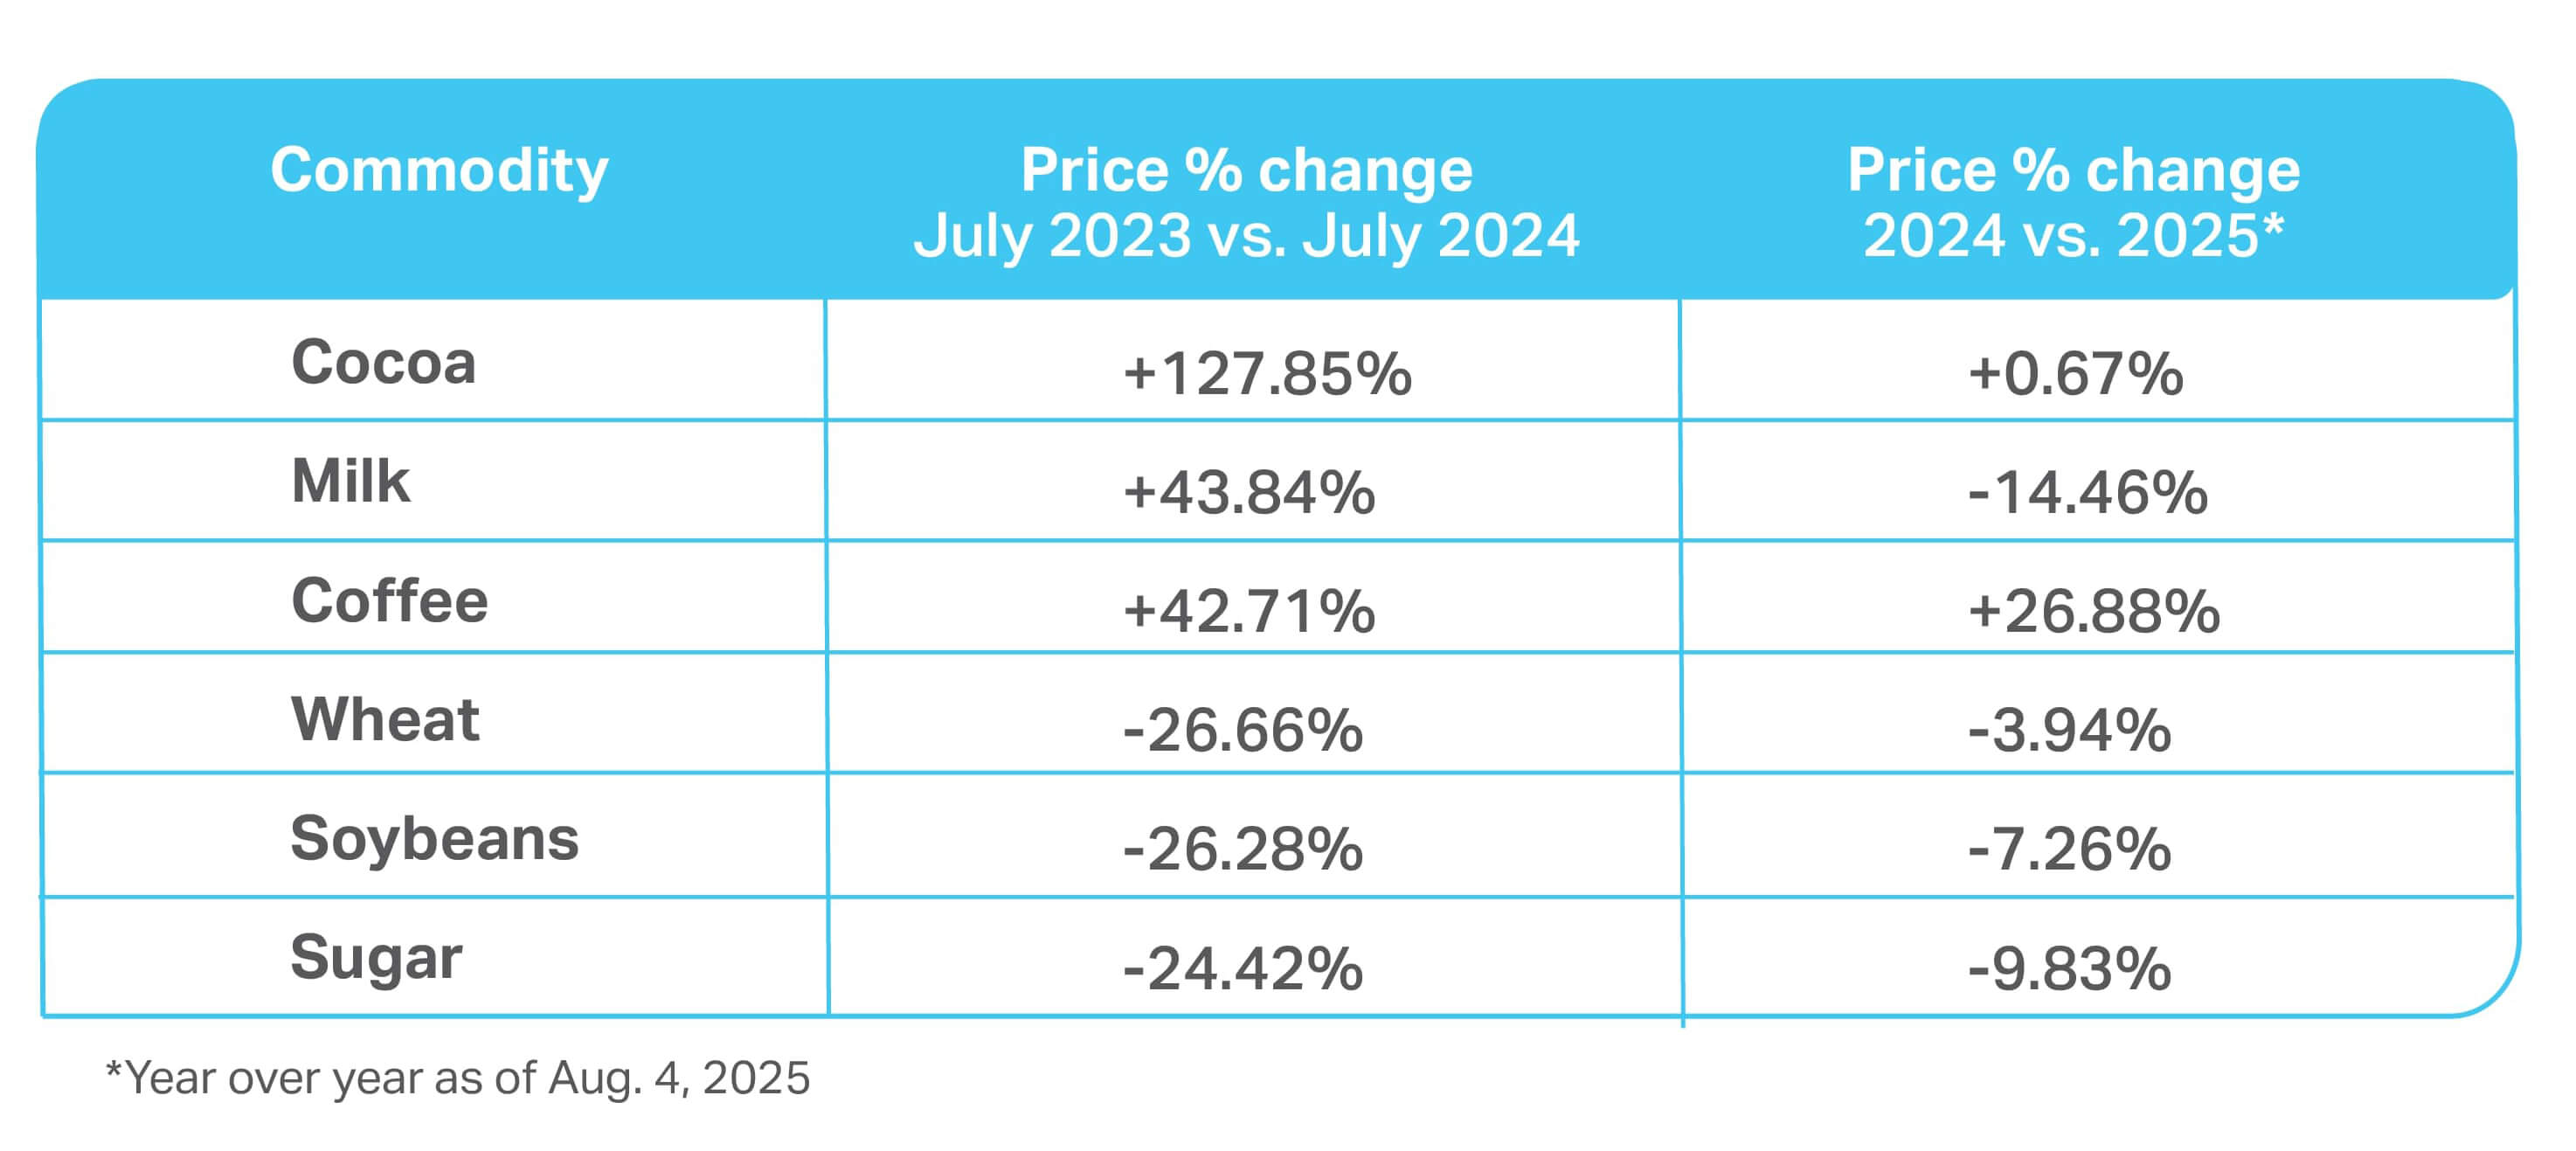
Commodity volatility is the new constant
Last year, global cocoa prices surged, and now, the rising price of coffee is reinforcing that volatility is here to stay. Commodities like these—plus oil, grains, eggs, and proteins—are setting new price floors that will likely never return to pre-2024 levels.
In this environment, companies must consider both short-term options—like reducing pack size or raising prices—and longer-term reformulations that reduce ingredient dependency while balancing cost, transparency, and sensory expectations consumers demand. Each strategy comes with its own challenges. Our tools can help you explore innovation and pricing scenarios to maximize revenue.
Commodity prices continue to fluctuate
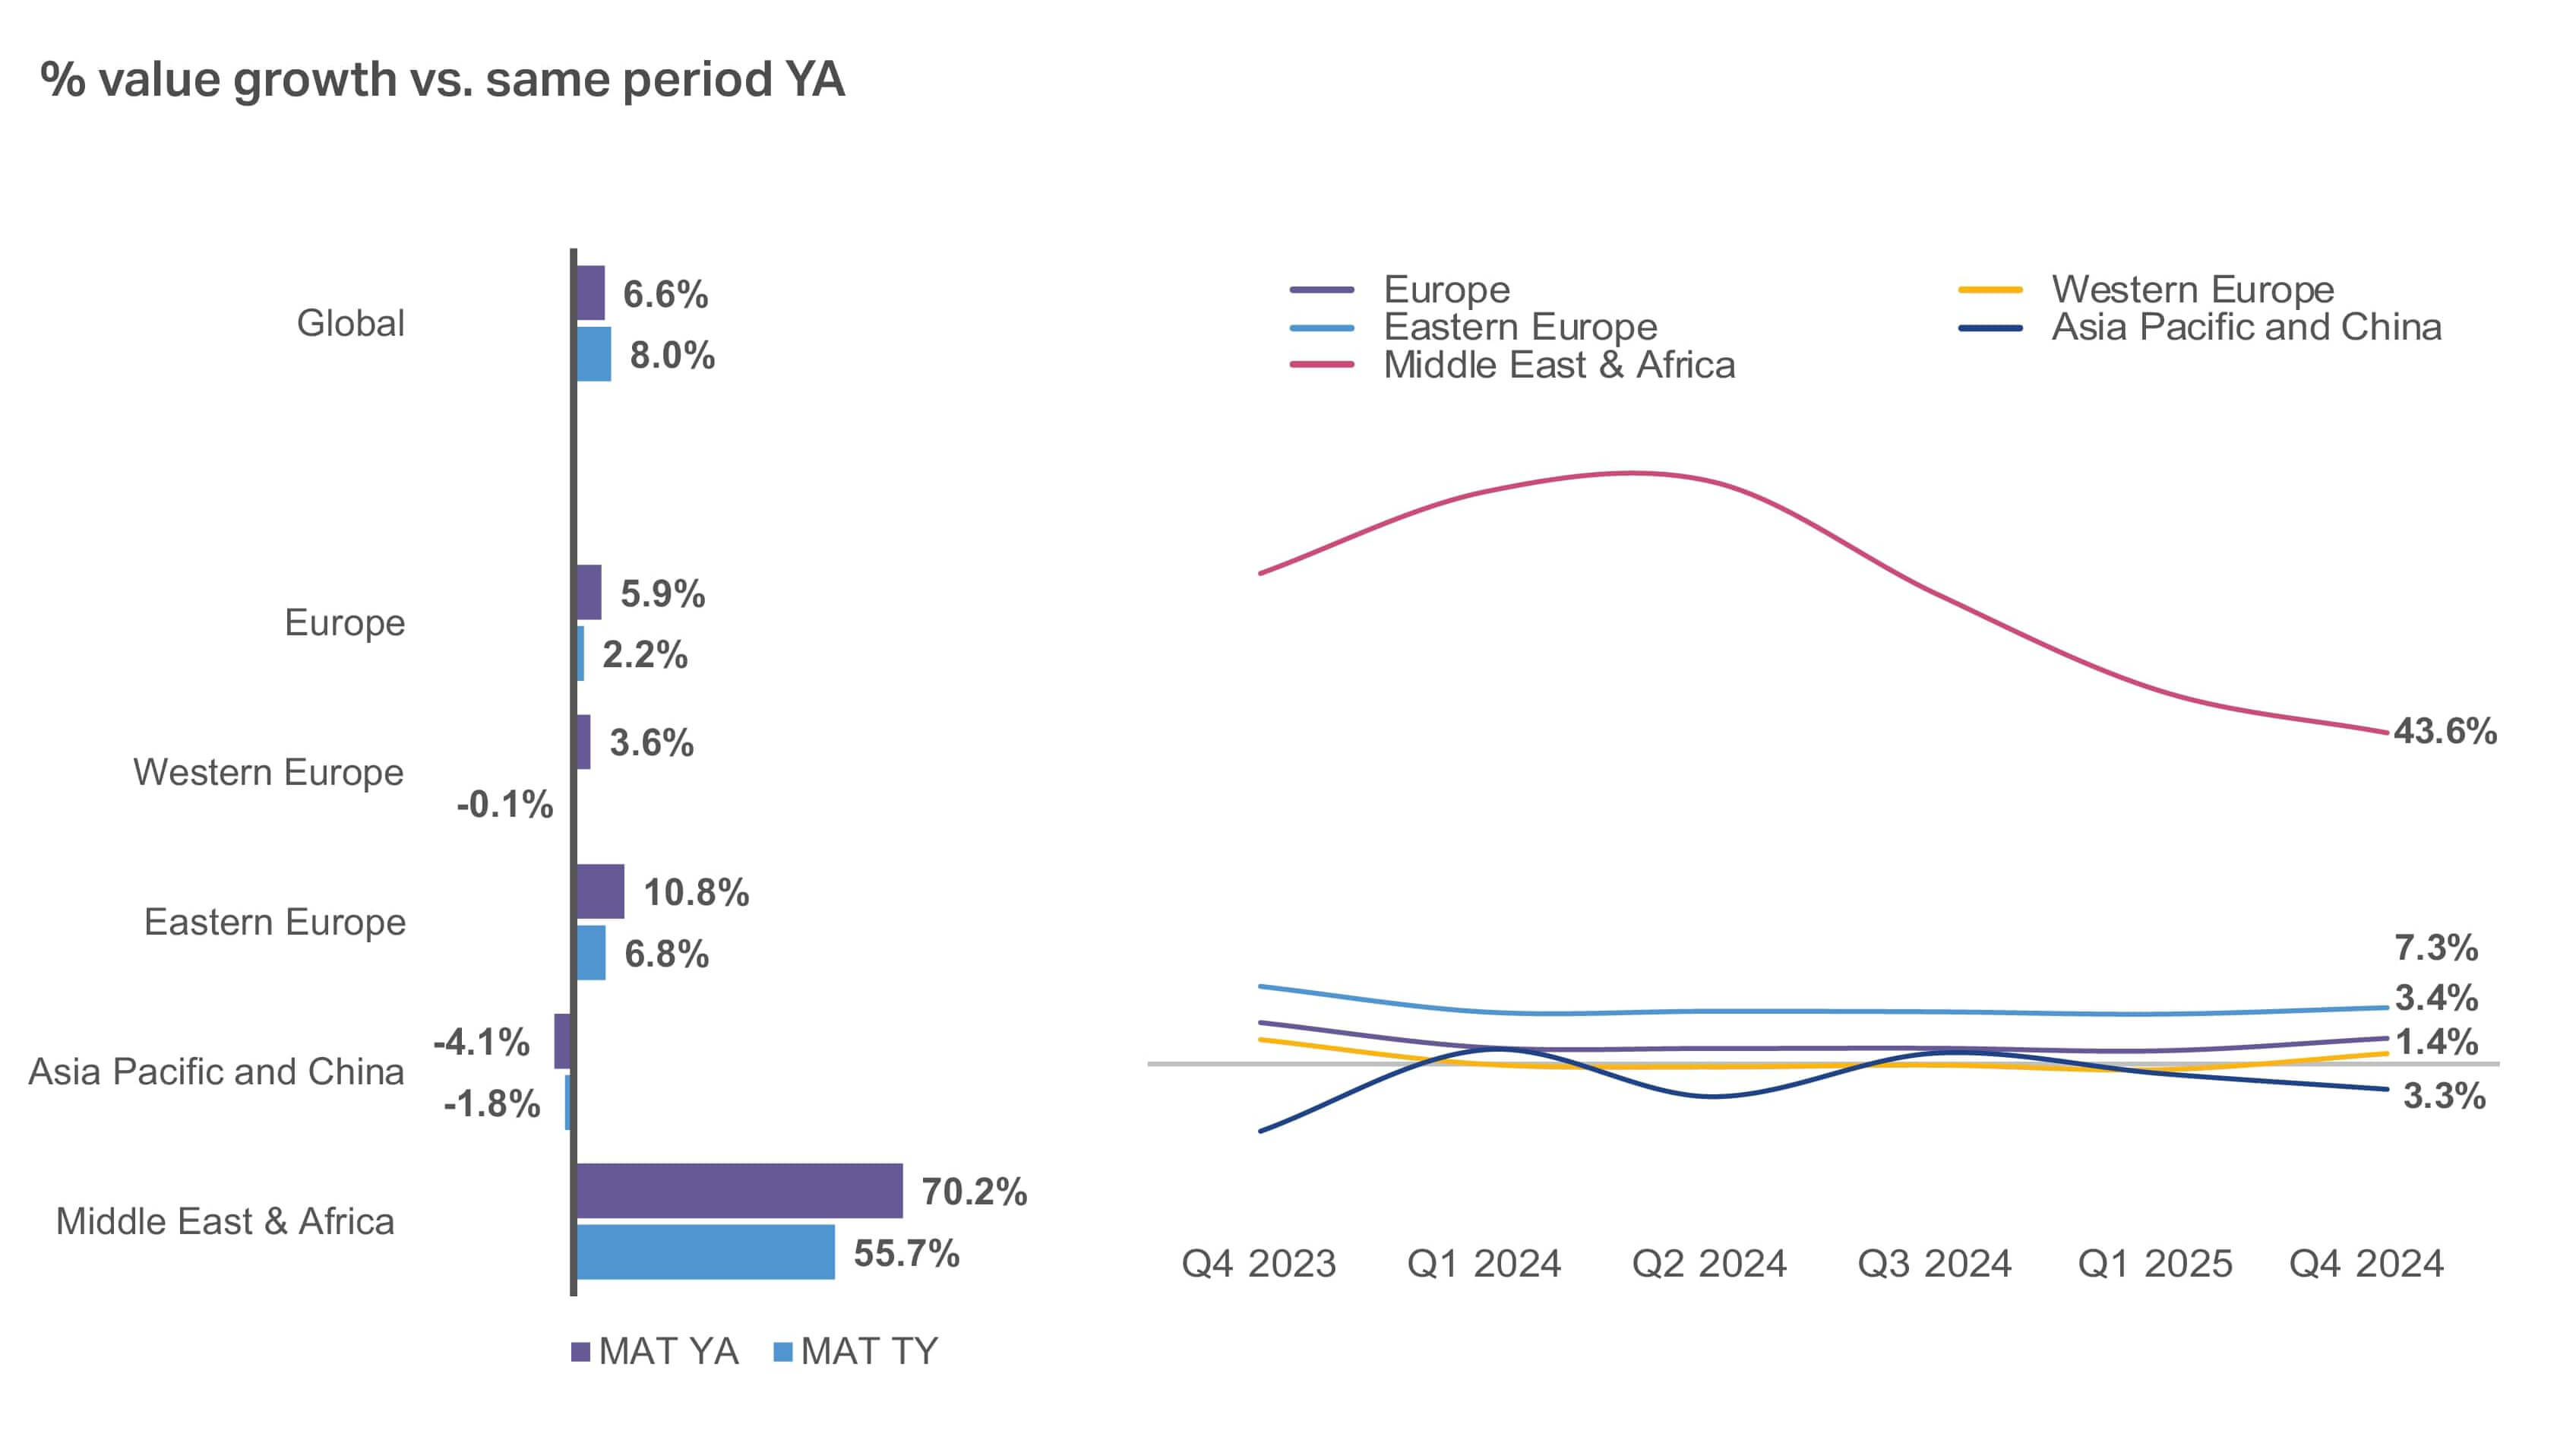
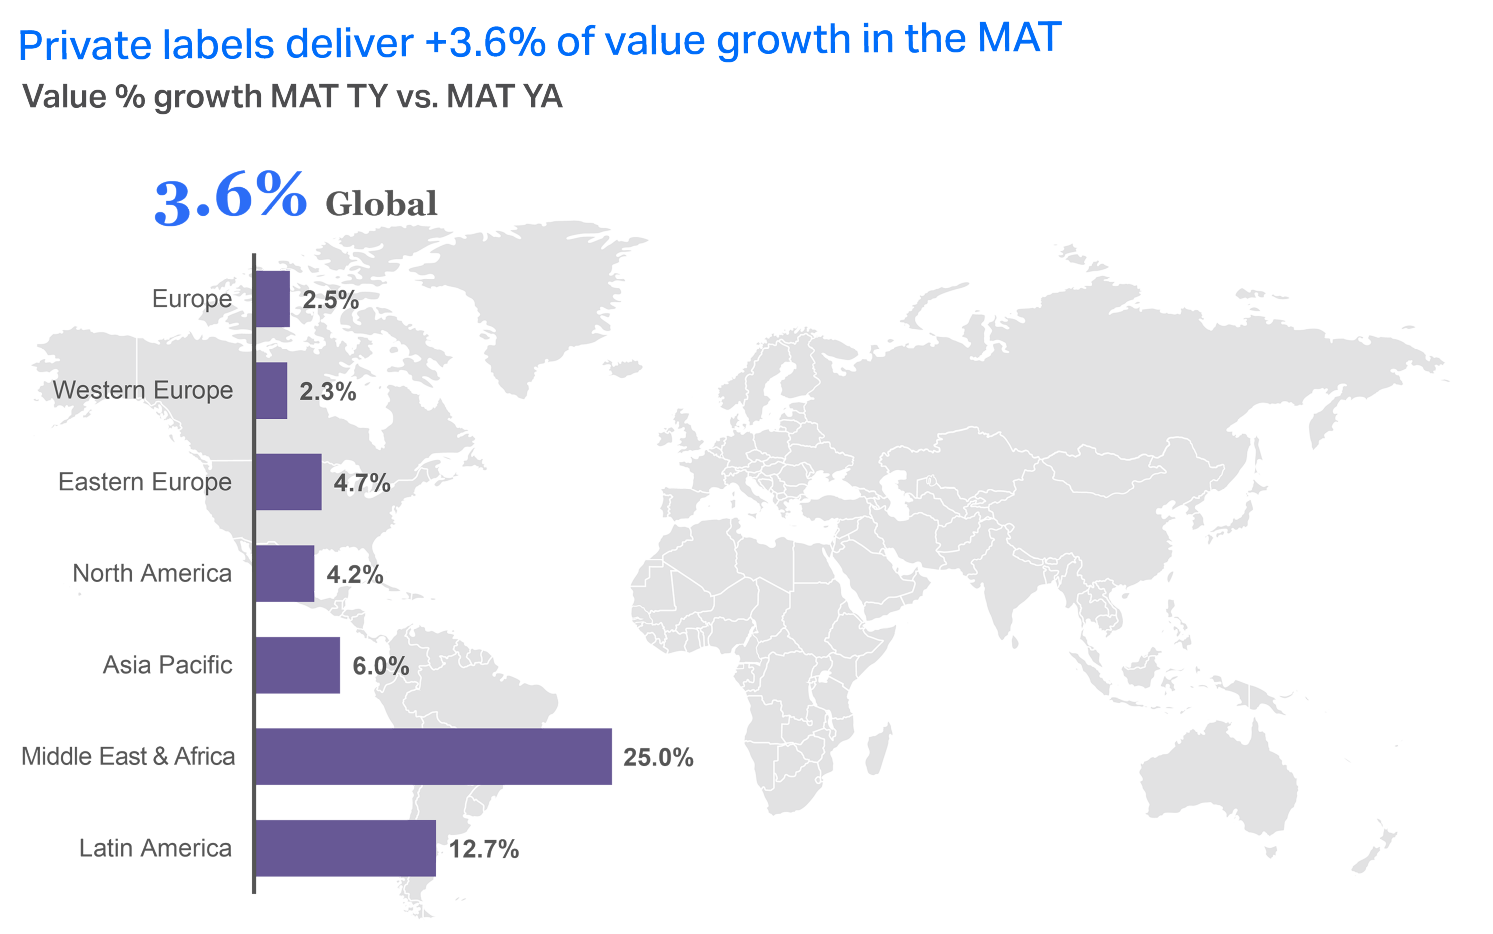
Private label is no longer a trade-down
Note: Russia no longer included in QBN reports from Q2 ’24 release
With innovation, clean ingredients, and localized trust, private label brands are now competing as first-choice options across Europe, Asia, and LATAM. In fact, private labels are now delivering value growth in most regions—with Western Europe leading the way.
A large portion of this growth is driven by consumer perception that many products within the private label category are highly substitutable with branded products. Consumers are also no longer shopping private label only because it’s more affordable. Thanks to retailer investments in quality and marketing, shoppers see many store brands as equal to or superior to national brands.
Private labels gained share across most regions in the MAT, except in Eastern Europe
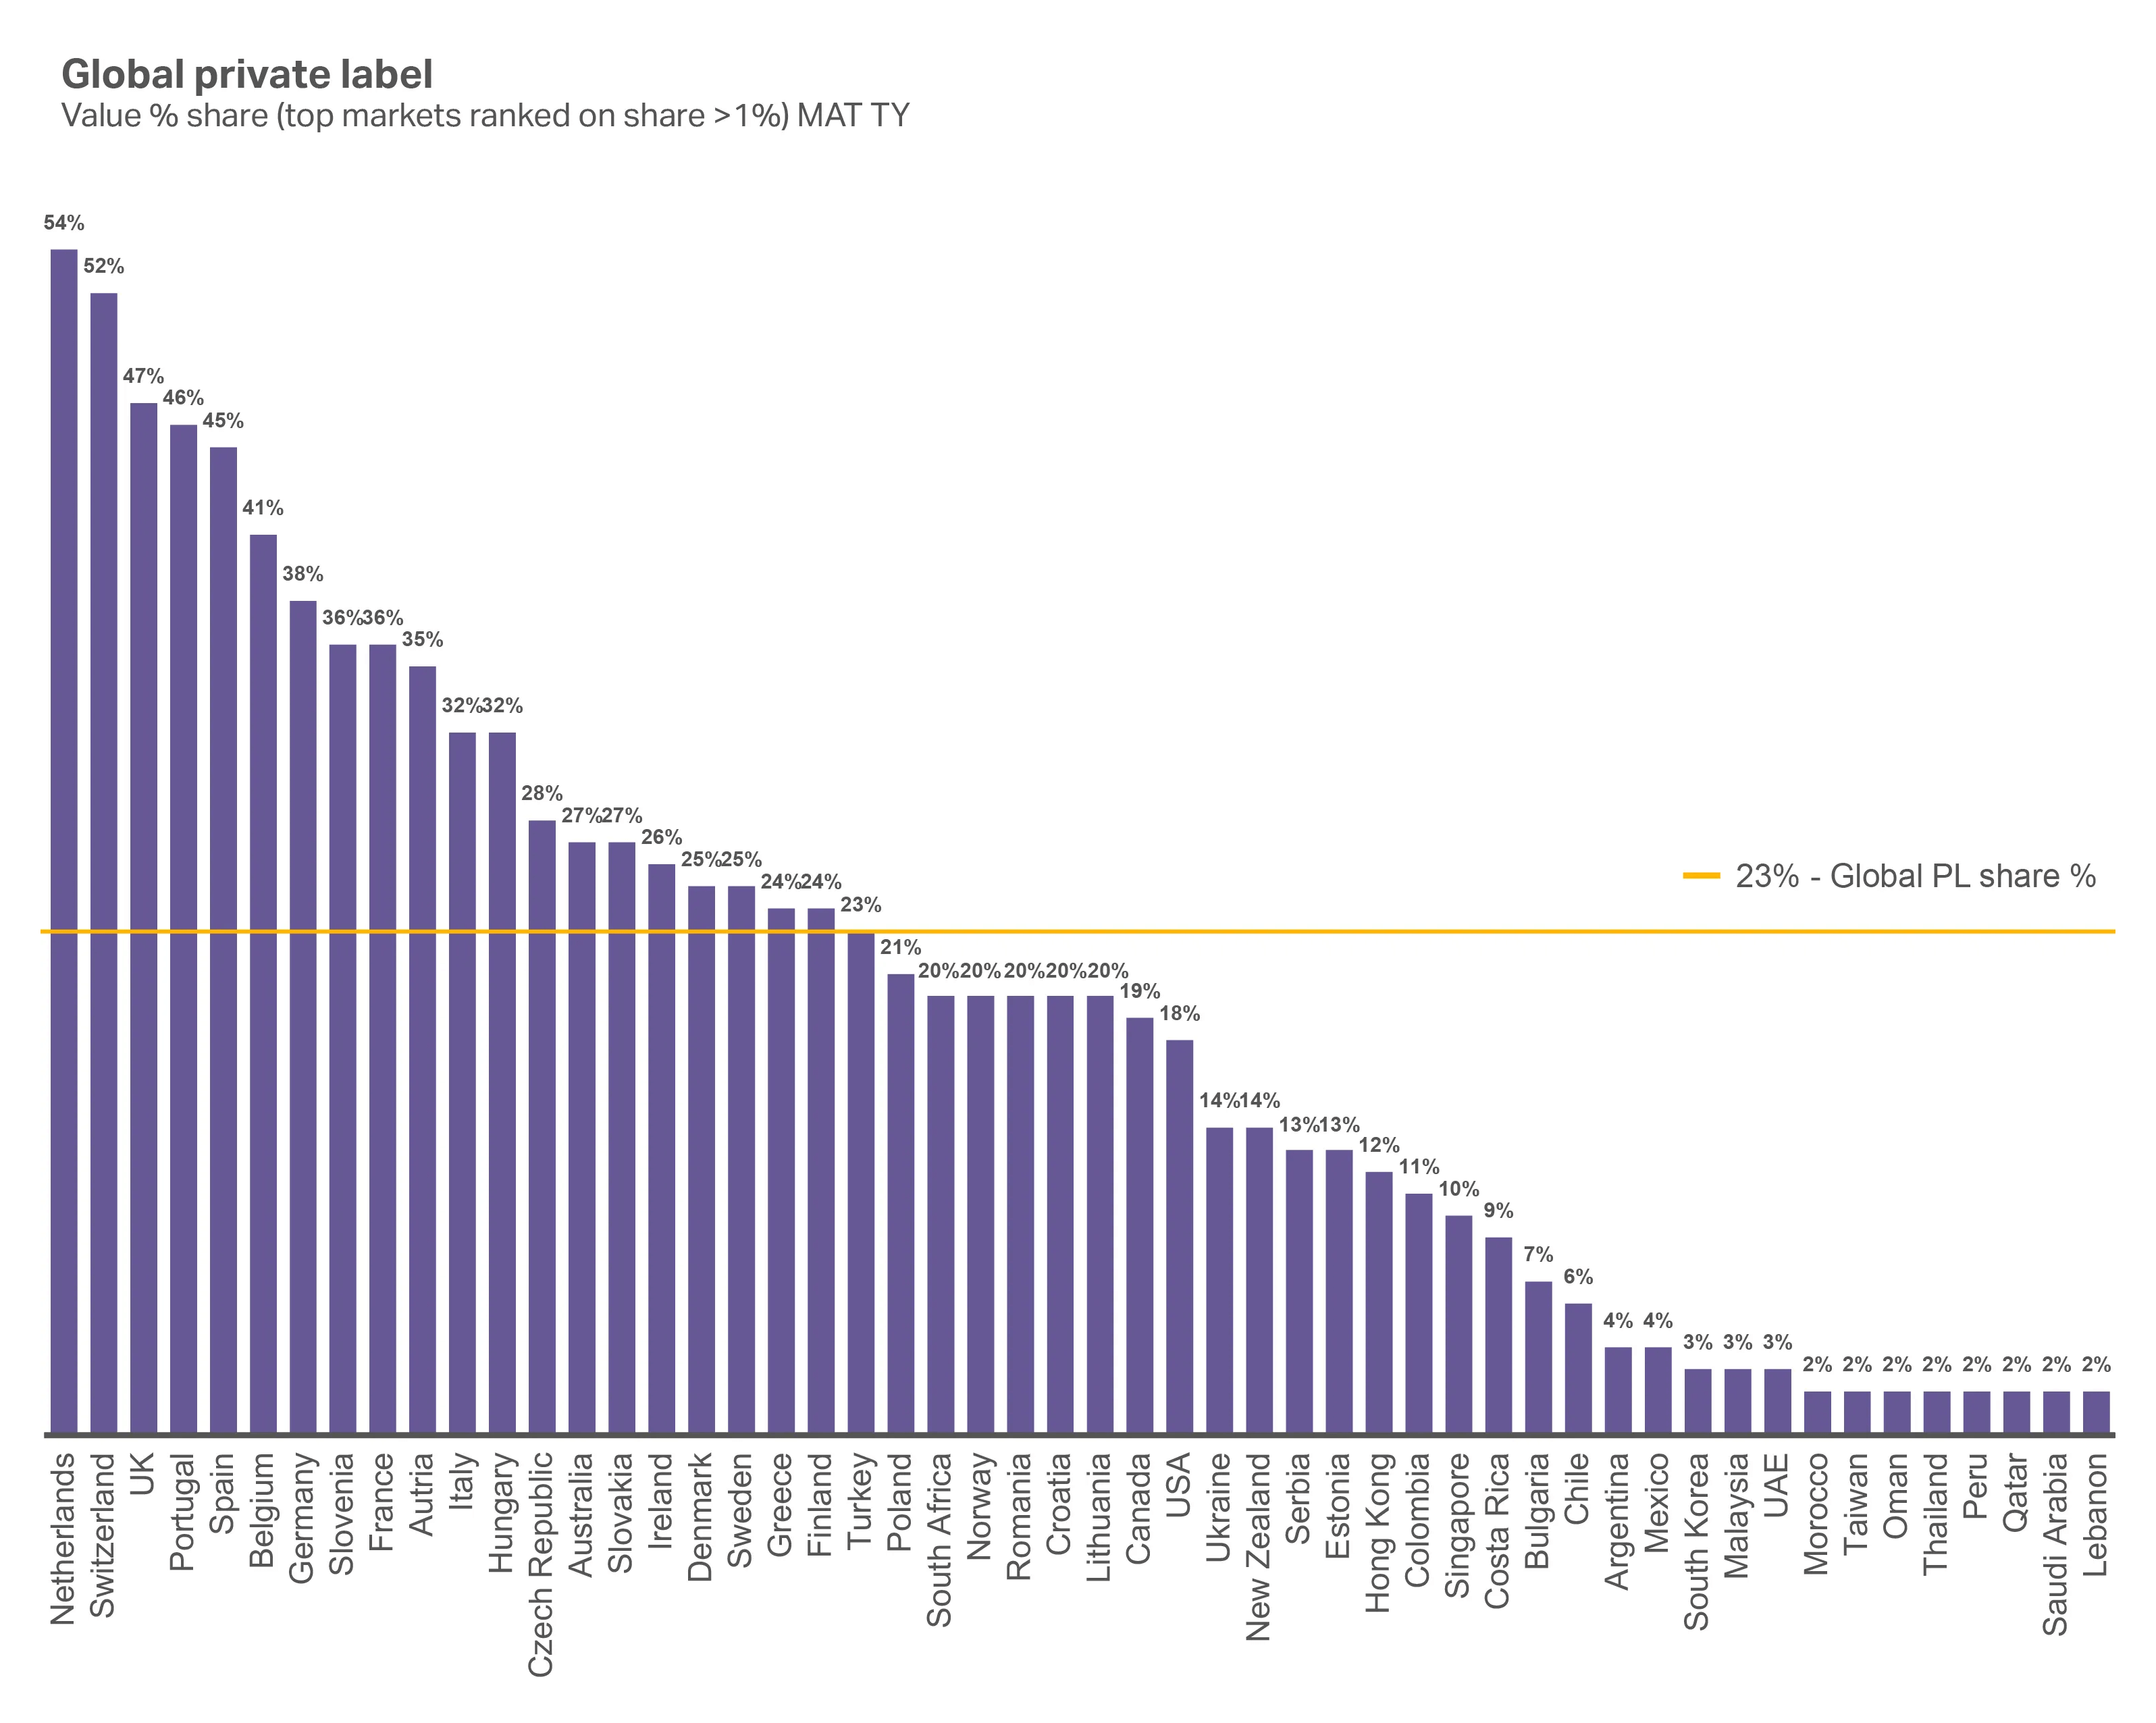
Though private labels are growing, they still only command a small percentage of value share in many markets. Stores have an incredible opportunity to capture their piece of this growth by developing or expanding upon private label portfolios.
NIQ Retail Pulse data reveals that there’s also a shift moving into 2026 toward premium store brands. For example, in Germany, we’re seeing a 13% increase in shoppers buying premium brands. A similar story spans many markets, including the UK (+19%), Poland (+16%), Italy (+14%), South Africa (+8%), Spain (+5%), and the United Arab Emirates (+4%).
Only Saudi Arabia (-7%), Thailand (-4%), and the Netherlands (-2%) showed a pullback on premium.
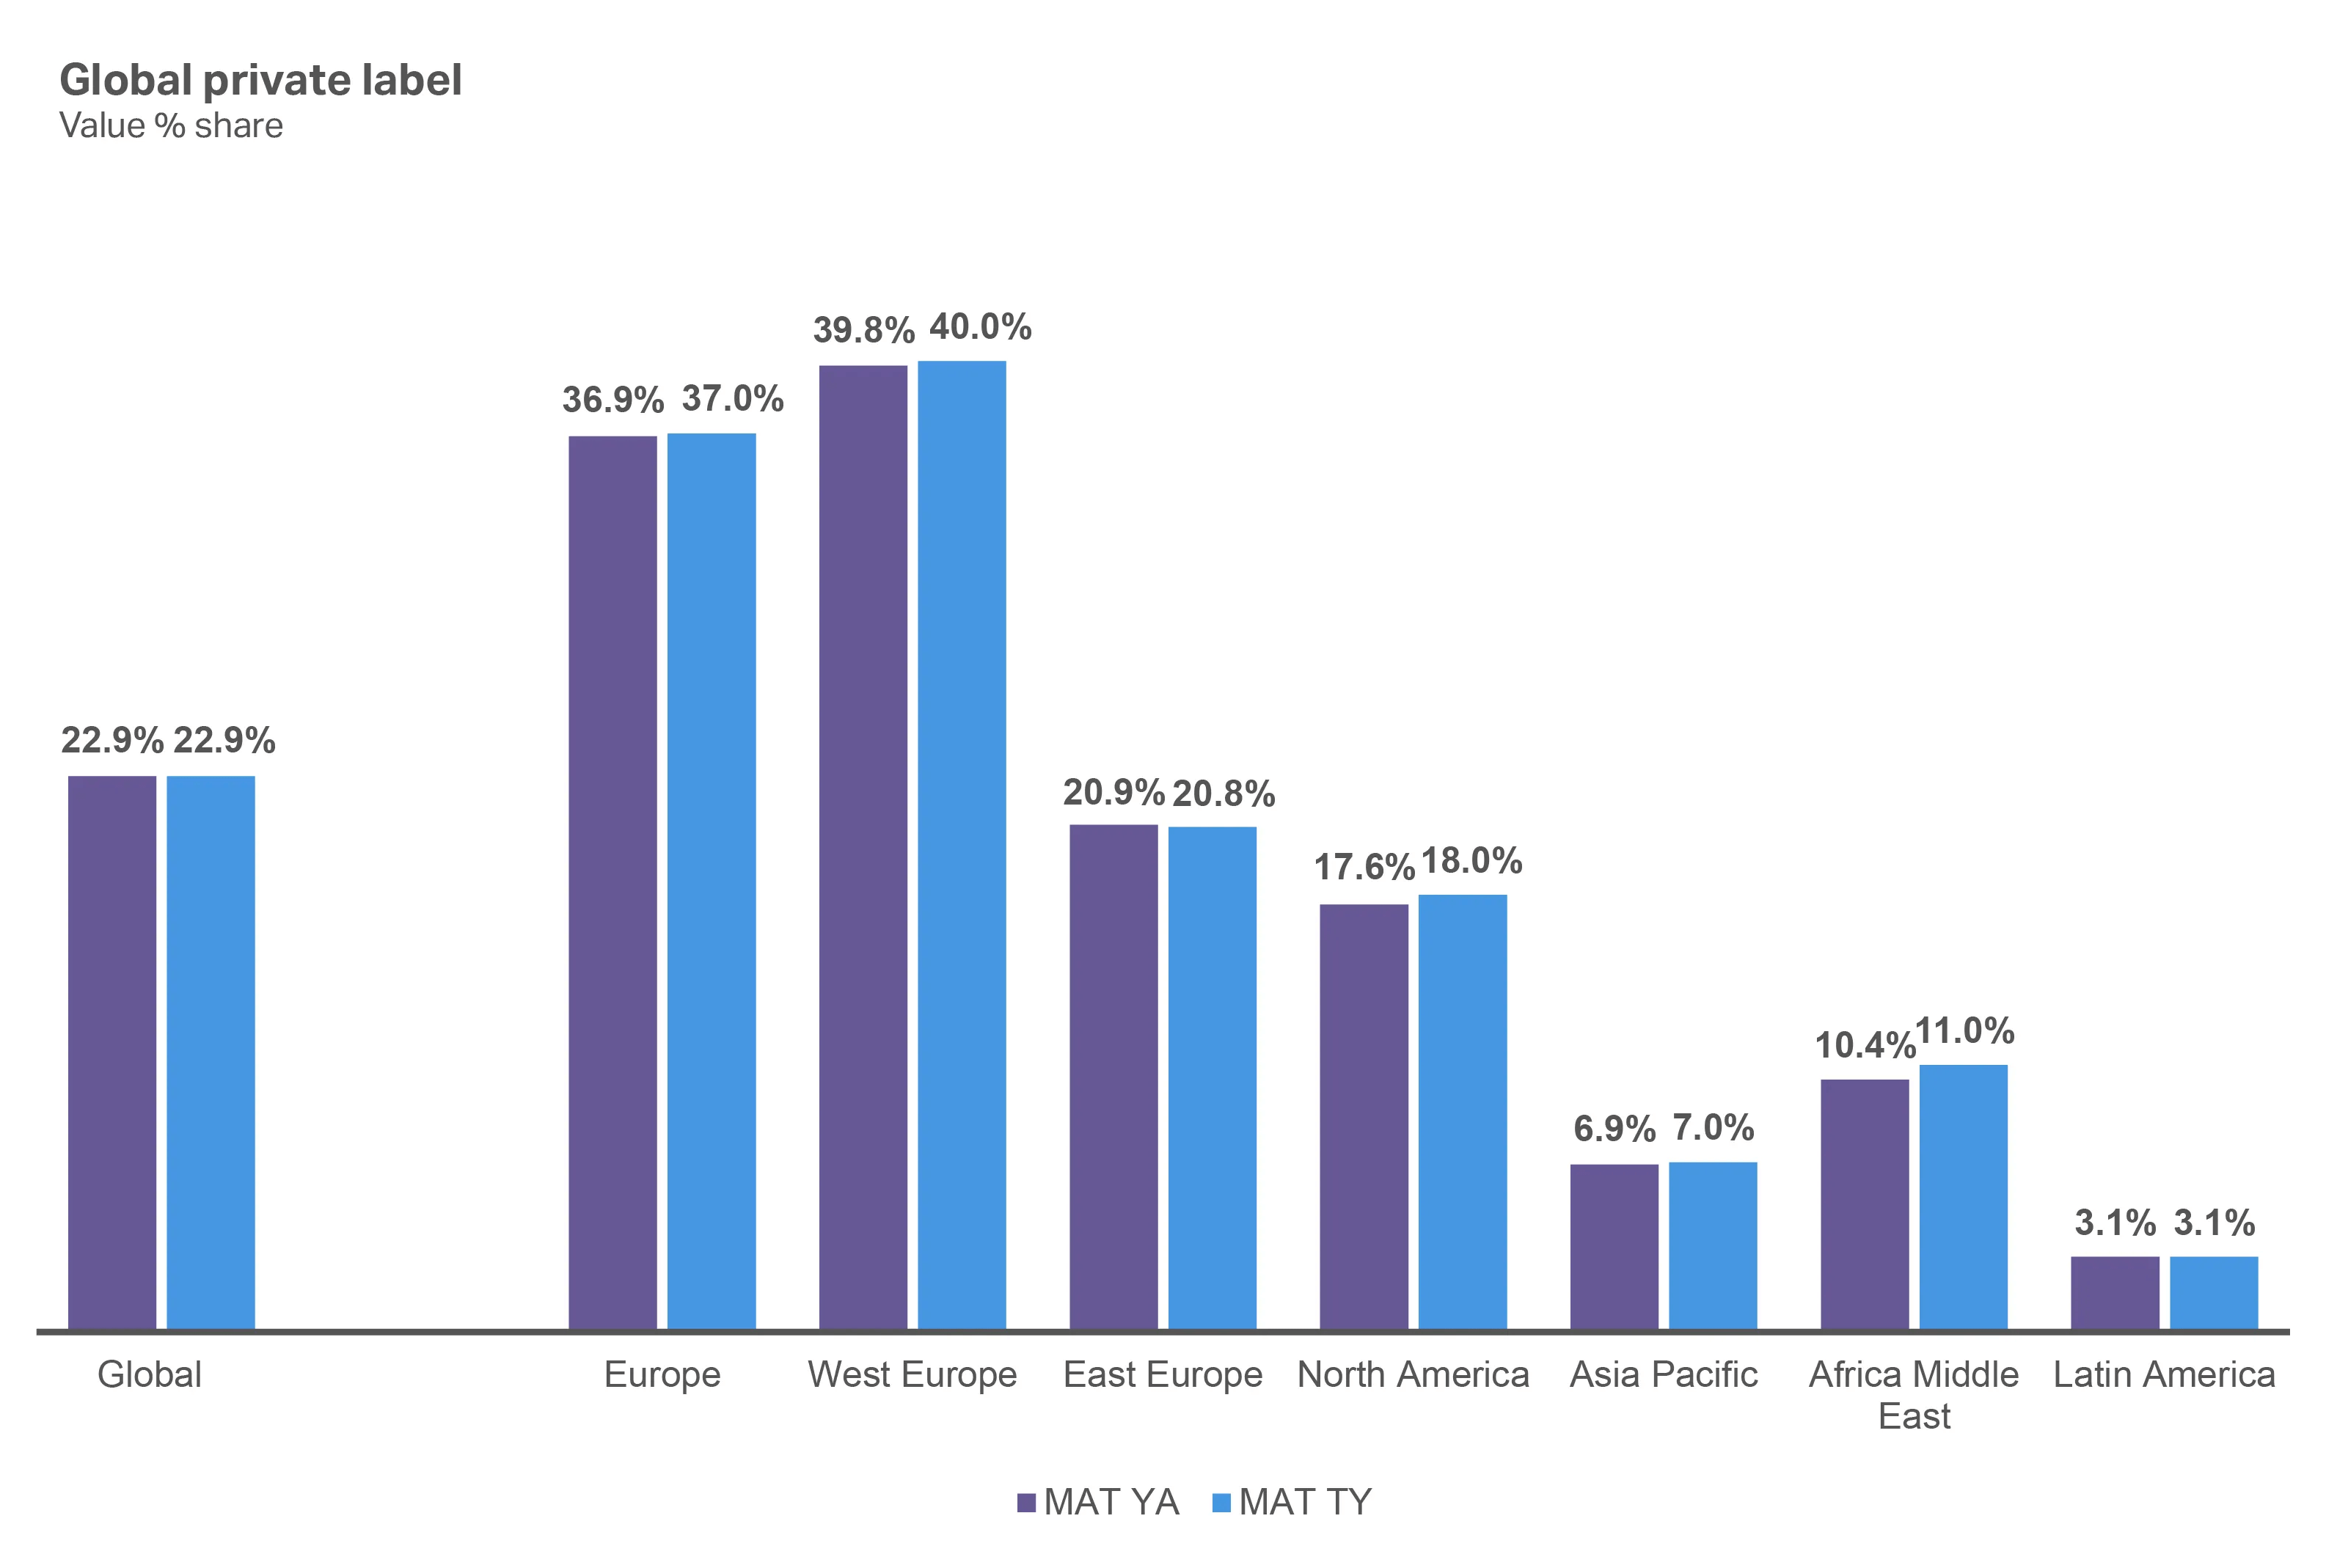
The strongest markets for private labels are in Western Europe
Meanwhile, private labels still have less than 2% share in most markets in the Middle East & Africa.

Large retailers are doubling down on private label

Walmart’s “Bettergoods” brand nears half a billion dollars in sales
- 400 products across culinary experiences, plant-based, and “made without”
- 70% of products priced under $5
Target’s “Good & Gather” brand worth $4B in 2024
- 2,500+ products, with around 50% priced under $5
- Over one-third of all grocery trips include a Good & Gather item
7-Eleven outsells national brands with “7-Select” brand
- Private label products increasing sales across categories by double digits
- 87% of the chain’s US consumers buy 7-Select brand products
$238.7B
in inflated ad costs from AI scrapers and bots in 2024
Source: “Bot Traffic Drains Ad Budget, Costing Businesses $238.7B in 2024”
Artificial Intelligence (AI) is rewriting discovery and search
AI-powered product discovery is becoming the go-to for consumers, though distrust persists in the AI/agentic shopping space. As the technology continues to advance, retailers simply can’t afford to not properly leverage AI as they attempt to attract, convert, and build lasting brand loyalty with today’s global consumer.
AI is already disrupting the SEO and ad spaces, making it difficult for retailers to reach consumers using conventional methods. Content is now being overhauled to help with discovery for the new generative engine optimization (GEO), while bot traffic is distorting ad campaign metrics.
Trust can be fragmented
With so much disruption across channels, manufacturers and retailers must look at every channel and how they can earn trust that transfers across channels. If a brand is trusted in-store but not online, that’s going to limit an omnichannel experience. Taking a holistic approach to trust becomes more important as social, retail, and conversational AI increasingly shape discovery.
In a world with increased focus on data-driven immediacy, it’s important to also invest in long-term strategies like community commerce. It’s about creating a space where like-minded consumers can have conversations, interact directly with the brand, and be granted exclusive access as a reward for their involvement. Additionally, community commerce platforms often also include peer-to-peer selling, group buying, and creator-led marketplaces that can build a loyal and vocal following of brand ambassadors.
Key takeaways
Signals once seen as outliers are quickly becoming mainstream forces reshaping global consumption.
The rise of AOMs is altering not just individual behavior but entire categories, reducing calorie intake, pulling spend from indulgent and excess-driven products, and creating new demand for functional, portion-controlled, and wellness-oriented solutions. More than half of consumers say they’ll pay a premium for fresh, clean, and healthier options, amplifying the effect and accelerating opportunities for brands that can credibly deliver on claims tied to health, naturalness, and metabolic support.
At the same time, commodity volatility is now an ongoing reality. Cocoa and coffee prices have surged, while grains and proteins remain unstable, setting higher long-term price floors. This turbulence forces companies to juggle immediate tactics—like pack size changes or price adjustments—while also considering deeper reformulations and innovation to protect margins without eroding consumer trust. In parallel, private labels are shaking off their value-tier reputation, expanding into premium territory and increasingly seen by shoppers as equal to, or even better than, national brands.
Finally, technology is rewriting the path to discovery. AI-driven search and shopping are upending how products are found and how ads are measured, even as trust in agent-led purchasing remains low. With almost half of internet traffic now non-human and ad spend distorted by bots, the stakes are rising for brands and retailers to adapt quickly.
The companies that will win are those that anticipate these disruptions—health shifts, cost shocks, private label competition, and AI disruption—and turn them into engines of innovation, trust, and growth.

Chapter 5: Your guide to 2026
Key takeaways for manufacturers and retailers
We’ve covered a lot of ground in this report. Now, it’s time to turn insights into action. Here’s a quick summary of the key takeaways your brand should focus on to win with consumers in 2026.
Strategically separate myths from realities with our key takeaways
| Myth | Reality | Your next steps for 2026 |
| Improved consumer confidence reflects an automatic willingness to spend. | Shoppers’ financial realities haven’t changed drastically in the last year. Their confidence instead reflects an acceptance of the volatile retail reality. | Brands and retailers must work to understand the product traits desired by consumers and deliver the tangible benefits that simplify shoppers’ lives to earn purchases. |
| Continued growth in private label products proves consumers are still shopping the cheapest option. | Many private label offerings have closed the quality gap and leaned into product innovation to earn a spot within a narrow range of products being considered by consumers. | Brands and private labels should lean on each other to expand the size of the prize and unlock incremental consumer spending with products that offer price, quality, and values in one aligned proposition. |
| Brands and retailers need to go all-in on e-commerce. | E-commerce is just one piece of the puzzle. Social commerce, quick commerce, retail media networks, e-commerce, and brick-and-mortar shopping are all converging into one ecosystem. | Retailers and manufacturers must be prepared to deliver frictionless, personalized shopping pathways across all channels, rather than putting all their eggs in one basket. |
| Constant disruption in retail has lowered consumer expectations. | The opposite is true! Consumers are demanding that manufacturers and retailers lean into innovation and technology to solve disruption before it affects them. | What does this look like in action? Think manufacturers who can quickly pivot when commodity prices force reformulation, retailers who can utilize AI to optimize customer service and personalization, and brands that highlight product labeling to serve shoppers on anti-obesity medications. Companies that can find—and capitalize on—opportunities to solve for volatility before it inconveniences their consumers will win. |
Bridging insight to action with NIQ: The Full View™
Solutions for manufacturers and retailers
State of consumers and economic uncertainty
This year’s survey shows that while consumers may finally be coming out of their inflationary slump, they’re now keeping an eye on political instability and escalating global conflict, making them wonder if now is the right time to buy. As opportunity in 2026 shifts from price-led growth to volume and occasion-led growth, retailers and manufacturers will need to focus on increasing shopping occasions and unit volumes while giving consumers emotional reassurance. Brands and retailers need solutions that allow them to offer fewer, clearer choices that deliver price, quality, and values in one aligned proposition
Solutions:


Brand trust
Today’s consumers are seeking lived alignment where performance earns trust. Functional quality is the biggest factor influencing trust in both high-growth and mature markets. Better-for-you claims, ingredient simplicity, and clean formulations are important, but the product must also meet consumer expectations for quality and consistency. While quality and consistency are the foundation of consumer trust, brands have to dig deeper to connect with the unique shopper values and traits that define that trust from person to person.
Solutions:
Seamless commerce
Consumers no longer shop channels; they move across platforms, touchpoints, and moments. Around the globe, digital tools are revolutionizing CPG baskets as shoppers are no longer bound to one path. Discovery and purchase are increasingly disconnected, which changes how brands must think about visibility and conversion. Manufacturers and retailers must capture growth by expanding occasions and building volume both online and in-store, while giving consumers confidence, control, and a sense of simplicity across the journey.
Solutions:


Trends to watch
Signals once seen as outliers are quickly becoming mainstream forces reshaping global consumption. The companies that will win are those that anticipate these disruptions—health shifts, cost shocks, private label competition, and AI disruption—and turn them into engines of innovation, trust, and growth.
Solutions:
Make your next big move
With NIQ’s consumer intelligence solutions. Contact us today to discuss your 2026 growth plan.